AMD Radeon RX 7900M vs AMD Radeon RX 7700S
AMD Radeon RX 7900M ► remove from comparison
The AMD Radeon RX 7900M is a mobile upper high-end graphics card based on the Navi 31 chip (RDNA 3 architecture) manufactured in 5nm. It features 4,608 cores (72 CUs - compute units) and 16 GB of fast GDDR6 graphics memory connected with a 256 Bit memory bus. The chip also includes 64 MB Infinity Cache. The clock speed of the cores will depend on the laptop according to AMD. The specified game clock speed is 1825 MHz (most likely at 180 W TGP).
AMD compares the performance to the mobile RTX 4080 and shows a number of games where the 7900M is on average 7% faster. Raytracing is supported in hardware, but usually slower than the Nvidia counterpart. Nvidia also has the advantage of DLSS support in selected games.
The Navi 31 chip is manufactured at TSMC in the current 5nm process. The power consumption (TGP) is specified at 160 to 180 Watt (200 Watt including SmartShift from the CPU).
AMD Radeon RX 7700S ► remove from comparison
The AMD Radeon RX 7700S is a mobile upper mid-range graphics card based on the Navi 33 chip (RDNA 3 architecture) manufactured in 6nm. It features 2,048 cores (32 CUs - compute units) and 8 GB of fast GDDR6 graphics memory connected with a 128 Bit memory bus. The chip also includes 32 MB Infinity Cache. The clock speed of the cores will depend on the laptop according to AMD. The specified game clock speed is 2200 MHz (most likely at 100 W TGP). The 7700S is the power efficient version of the RX 7600M XT with slightly reduced clock speeds (-100 MHz) and TDP (-20W max).
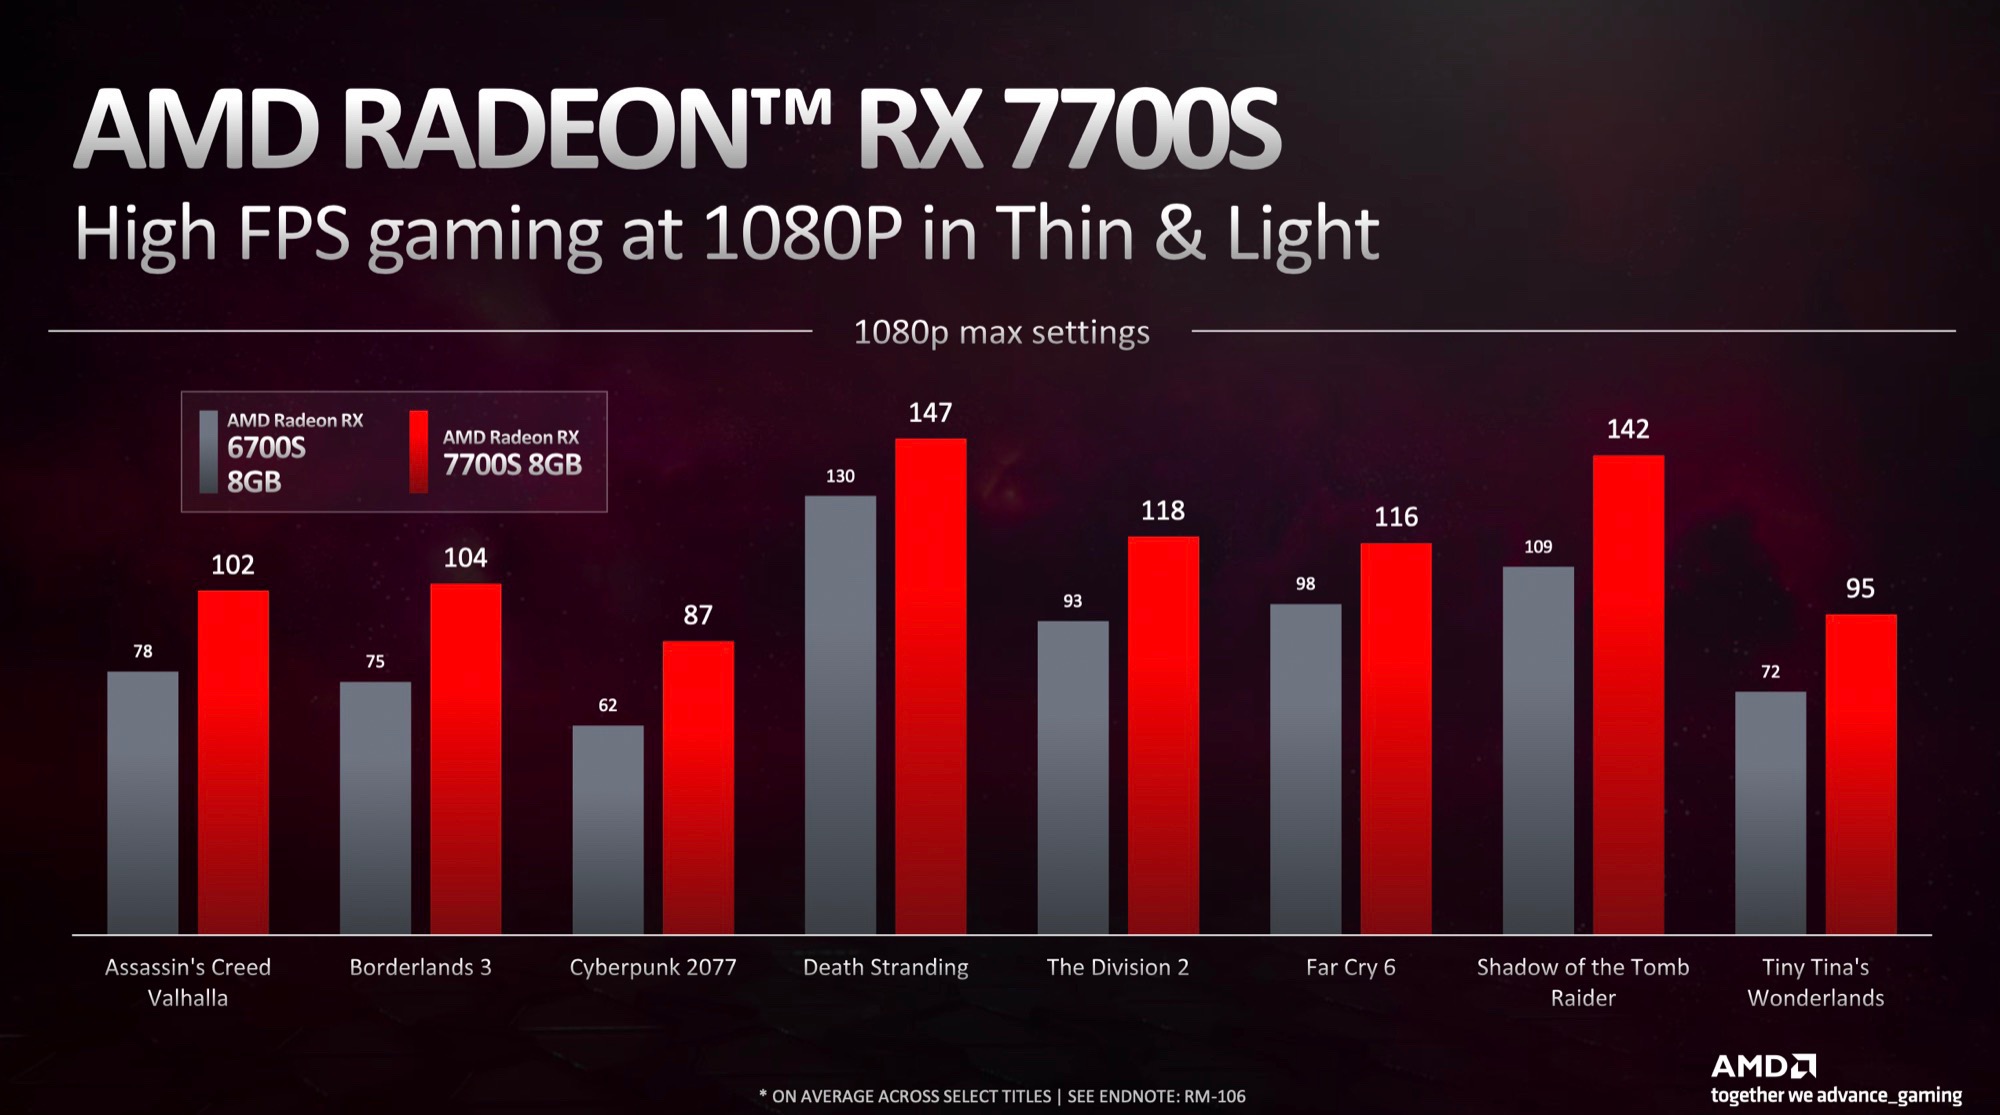
AMD compares the performance to the old Radeon RX 6700S , that is easily beaten by the 7700S. As the theoretical performance is only slightly below the 7600M XT (at 100W TGP), the 7700S should also beat the RTX 3060 desktop GPU . Although the Raytracing performance did increase for RDNA 3, the GeForce GPUs are still faster in this regard.
The Navi 33 chip is manufactured at TSMC in the current 6nm process (versus 4nm of Nvidia RTX 4000 series). The power consumption (TGP) is specified at 75 to 100 Watt.
AMD Radeon RX 7900M AMD Radeon RX 7700S Radeon RX 7000M Series Codename Navi 31 Navi 33 Architecture RDNA 3 RDNA 3 Pipelines 4608 - unified 2048 - unified ROPs 192 64 Core Speed 1825 - 2090 (Boost) MHz 2200 (Boost) MHz Theoretical Performance 77.05 TFLOPS FP16, 38.52 TFLOPS FP32 31 TFLOPS FP16, 20.5 TFLOPS FP32 Cache L3: 64 MB L3: 32 MB Memory Speed 18000 MHz 18000 MHz Memory Bus Width 256 Bit 128 Bit Memory Type GDDR6 GDDR6 Max. Amount of Memory 16 GB 8 GB Shared Memory no no Memory Bandwidth 576 GB/s 288 GB/s API DirectX 12_2, Shader 6.7, OpenGL 4.6, OpenCL 2.2, Vulkan 1.3 DirectX 12, Shader 6.4, OpenGL 4.6 Power Consumption 180 Watt (160 - 200 Watt TGP) 100 Watt (75 - 100 Watt TGP) Transistors 53.9 Billion 13.3 Billion technology 5 nm 6 nm Notebook Size large large Date of Announcement 19.10.2023 05.01.2023 Link to Manufacturer Page www.amd.com www.amd.com Die Size 204 mm²
Benchmarks 3DMark - 3DMark Time Spy Score
18114 Points (52%)
10294 Points (30%)
GPU TDP 100 W TDP 180 W 57% 100%
3DMark - 3DMark Time Spy Graphics
19434 Points (51%)
10206 Points (27%)
GPU TDP 100 W TDP 180 W 53% 100%
3DMark - 3DMark Fire Strike Standard Score
40123 Points (71%)
21865 Points (39%)
GPU TDP 100 W TDP 180 W 54% 100%
3DMark - 3DMark Fire Strike Standard Graphics
50241 Points (57%)
24246 Points (27%)
GPU TDP 100 W TDP 180 W 48% 100%
3DMark 11 - 3DM11 Performance Score
41670 Points (58%)
32427 Points (45%)
GPU TDP 100 W TDP 180 W 78% 100%
3DMark 11 - 3DM11 Performance GPU
59943 Points (52%)
37918 Points (33%)
GPU TDP 100 W TDP 180 W 63% 100%
Cinebench R15 + AMD Radeon RX 7900M Cinebench R15 - Cinebench R15 OpenGL 64 Bit
369 fps (22%)
Cinebench R15 OpenGL 64 Bit + AMD Radeon RX 7700S
282 fps (16%)
GPU TDP 100 W TDP 180 W 76% 100%
Cinebench R15 OpenGL Ref. Match 64 Bit + AMD Radeon RX 7900M Cinebench R15 - Cinebench R15 OpenGL Ref. Match 64 Bit
97.9 % (98%)
Cinebench R15 OpenGL Ref. Match 64 Bit + AMD Radeon RX 7700S
97.9 % (98%)
GPU TDP 100 W TDP 180 W 100% 100%
Basemark GPU 1.2 - Basemark GPU 1.2 Vulkan Official Medium Offscreen 1080
104.6 fps (1%)
104.6 fps (1%)
GPU TDP 100 W TDP 180 W 100% 100%
Basemark GPU 1.2 - Basemark GPU 1.2 Vulkan Official High Offscreen 2160
3.6 fps (1%)
3.6 fps (1%)
GPU TDP 100 W TDP 180 W 100% 100%
Geekbench 6.2 - Geekbench 6.2 GPU OpenCL
140024 Points (41%)
73082 Points (21%)
GPU TDP 100 W TDP 180 W 52% 100%
Geekbench 6.2 - Geekbench 6.2 GPU Vulkan
138222 Points (45%)
31001 Points (10%)
GPU TDP 100 W TDP 180 W 22% 100%
Power Consumption - Furmark Stress Test Power Consumption - external Monitor *
313 Watt (44%)
167.5 Watt (24%)
GPU TDP 100 W TDP 180 W 137% 100%
Power Consumption - The Witcher 3 Power Consumption - external Monitor *
167 Watt (23%)
171.3 Watt (24%)
GPU TDP 100 W TDP 180 W 100% 101%
Power Consumption - Witcher 3 Power Consumption *
216 Watt (47%)
171.9 Watt (38%)
GPU TDP 100 W TDP 180 W 118% 100%
Power Consumption - Witcher 3 ultra Power Efficiency - external Monitor
0.6 fps per Watt (48%)
Emissions Witcher 3 Fan Noise + AMD Radeon RX 7900M Emissions - Witcher 3 Fan Noise
53.6 dB(A) (86%)
Witcher 3 Fan Noise + AMD Radeon RX 7700S
51.9 dB(A) (83%)
GPU TDP 100 W TDP 180 W 97% 100%
Average Benchmarks AMD Radeon RX 7900M → 100% n=12 Average Benchmarks AMD Radeon RX 7700S → 67% n=12
- Range of benchmark values for this graphics card
- Average benchmark values for this graphics card
* Smaller numbers mean a higher performance
1 This benchmark is not used for the average calculation
Game Benchmarks The following benchmarks stem from our benchmarks of review laptops. The performance depends on the used graphics memory, clock rate, processor, system settings, drivers, and operating systems. So the results don't have to be representative for all laptops with this GPU. For detailed information on the benchmark results, click on the fps number.
100%
Radeon RX 7900M:
104.8 fps
100%
Radeon RX 7900M:
71.7 fps
100%
Radeon RX 7900M:
37.3 fps
Radeon RX 7700S:
100.7 fps
100%
Radeon RX 7900M:
130.7 fps
52%
Radeon RX 7700S:
68.1 fps
100%
Radeon RX 7900M:
129.6 fps
47%
Radeon RX 7700S:
60.7 fps
100%
Radeon RX 7900M:
85.2 fps
44%
Radeon RX 7700S:
37.3 fps
100%
Radeon RX 7900M:
37.7 fps
42%
Radeon RX 7700S:
15.8 fps
Radeon RX 7700S:
106.8 fps
100%
Radeon RX 7900M:
152.4 fps
50%
Radeon RX 7700S:
76.4 fps
100%
Radeon RX 7900M:
152.6 fps
48%
Radeon RX 7700S:
73.6 fps
100%
Radeon RX 7900M:
118.5 fps
43%
Radeon RX 7700S:
51.1 fps
100%
Radeon RX 7900M:
65.8 fps
38%
Radeon RX 7700S:
24.7 fps
100%
Radeon RX 7900M:
86.2 fps
100%
Radeon RX 7900M:
83.6 fps
100%
Radeon RX 7900M:
54.8 fps
100%
Radeon RX 7900M:
296 fps
57%
Radeon RX 7700S:
168 fps
100%
Radeon RX 7900M:
102.8 fps
46%
Radeon RX 7700S:
47.7 fps
100%
Radeon RX 7900M:
69.3 fps
43%
Radeon RX 7700S:
29.9 fps
100%
Radeon RX 7900M:
36.1 fps
31%
Radeon RX 7700S:
11.3 fps
Radeon RX 7700S:
183.5 fps
Radeon RX 7700S:
140.4 fps
100%
Radeon RX 7900M:
150.2 fps
47%
Radeon RX 7700S:
71.2 fps
100%
Radeon RX 7900M:
106.8 fps
44%
Radeon RX 7700S:
47.3 fps
100%
Radeon RX 7900M:
56 fps
41%
Radeon RX 7700S:
23.1 fps
100%
Radeon RX 7900M:
135 fps
100%
Radeon RX 7900M:
93.3 fps
100%
Radeon RX 7900M:
44.3 fps
100%
Radeon RX 7900M:
207 fps
100%
Radeon RX 7900M:
198 fps
100%
Radeon RX 7900M:
139 fps
100%
Radeon RX 7900M:
76 fps
Radeon RX 7700S:
449 [X] Framework Laptop 16 1.47.22.14 D3D12
AMD Ryzen 9 7940HS 4GHz
Radeon RX 7700S
min:
142.6 fps, P1:
335 fps, max:
711 fps
fps
Radeon RX 7700S:
202 [X] Framework Laptop 16 1.47.22.14 D3D12
AMD Ryzen 9 7940HS 4GHz
Radeon RX 7700S
min:
102.7 fps, P1:
166.3 fps, max:
380 fps
fps
Radeon RX 7700S:
167.4 [X] Framework Laptop 16 1.47.22.14 D3D12
AMD Ryzen 9 7940HS 4GHz
Radeon RX 7700S
min:
88.3 fps, P1:
121 fps, max:
423 fps
fps
100%
Radeon RX 7900M:
344 [X] Alienware m18 R1 AMD 1.47.22.14 D3D12
AMD Ryzen 9 7945HX 2.5GHz
Radeon RX 7900M
min:
145.8 fps, P1:
227 fps, max:
549 fps
fps
42%
Radeon RX 7700S:
143.9 [X] Framework Laptop 16 1.47.22.14 D3D12
AMD Ryzen 9 7940HS 4GHz
Radeon RX 7700S
min:
84.9 fps, P1:
104.3 fps, max:
353 fps
fps
100%
Radeon RX 7900M:
249 [X] Alienware m18 R1 AMD 1.47.22.14 D3D12
AMD Ryzen 9 7945HX 2.5GHz
Radeon RX 7900M
min:
137.9 fps, P1:
183.7 fps, max:
466 fps
fps
37%
Radeon RX 7700S:
91.9 [X] Framework Laptop 16 1.47.22.14 D3D12
AMD Ryzen 9 7940HS 4GHz
Radeon RX 7700S
min:
66 fps, P1:
75.1 fps, max:
157.7 fps
fps
100%
Radeon RX 7900M:
130.5 [X] Alienware m18 R1 AMD 1.47.22.14 D3D12
AMD Ryzen 9 7945HX 2.5GHz
Radeon RX 7900M
min:
79.1 fps, P1:
110.9 fps, max:
204 fps
fps
37%
Radeon RX 7700S:
47.9 [X] Framework Laptop 16 1.47.22.14 D3D12
AMD Ryzen 9 7940HS 4GHz
Radeon RX 7700S
min:
38.8 fps, P1:
42.4 fps, max:
68.5 fps
fps
100%
Radeon RX 7900M:
128 fps
91%
Radeon RX 7700S:
117 fps
100%
Radeon RX 7900M:
123 fps
66%
Radeon RX 7700S:
81 fps
100%
Radeon RX 7900M:
103 fps
38%
Radeon RX 7700S:
39 fps
100%
Radeon RX 7900M:
83.7 fps
78%
Radeon RX 7700S:
65 fps
100%
Radeon RX 7900M:
64.3 fps
73%
Radeon RX 7700S:
46.8 fps
100%
Radeon RX 7900M:
152.8 fps
49%
Radeon RX 7700S:
74.8 fps
100%
Radeon RX 7900M:
114.6 fps
48%
Radeon RX 7700S:
54.5 fps
100%
Radeon RX 7900M:
69.3 fps
42%
Radeon RX 7700S:
29 fps
Radeon RX 7700S:
159.8 fps
100%
Radeon RX 7900M:
162.8 fps
96%
Radeon RX 7700S:
156.5 fps
100%
Radeon RX 7900M:
146.2 fps
94%
Radeon RX 7700S:
136.8 fps
100%
Radeon RX 7900M:
122.5 fps
70%
Radeon RX 7700S:
85.3 fps
Radeon RX 7700S:
392.2 fps
Radeon RX 7700S:
277.5 fps
Radeon RX 7700S:
147.1 fps
100%
Radeon RX 7900M:
167.7 fps
50%
Radeon RX 7700S:
84 fps
100%
Radeon RX 7900M:
116 fps
37%
Radeon RX 7700S:
43 fps
Radeon RX 7700S:
178.6 fps
100%
Radeon RX 7900M:
172.9 fps
99%
Radeon RX 7700S:
170.6 fps
100%
Radeon RX 7900M:
105 fps
91%
Radeon RX 7700S:
95.8 fps
100%
Radeon RX 7900M:
105.6 fps
64%
Radeon RX 7700S:
67.1 fps
100%
Radeon RX 7900M:
146 fps
47%
Radeon RX 7700S:
68.4 fps
Average Gaming AMD Radeon RX 7900M → 100% Average Gaming 30-70 fps → 100%
Average Gaming AMD Radeon RX 7700S → 55% Average Gaming 30-70 fps → 50%
AMD Radeon RX 7900M low med. high ultra QHD 4K Alan Wake 2 104.8 71.7 37.3 Cyberpunk 2077 2.0 Phantom Liberty 130.7 129.6 85.2 37.7 Baldur's Gate 3 152.4 152.6 118.5 65.8 Ratchet & Clank Rift Apart 86.2 83.6 54.8 F1 22 296 102.8 69.3 36.1 Tiny Tina's Wonderlands 150.2 106.8 56 Cyberpunk 2077 1.6 135 93.3 44.3 Shadow of the Tomb Raider 207 198 139 76 Strange Brigade 344 249 130.5 Far Cry 5 128 123 103 X-Plane 11.11 83.7 64.3 Final Fantasy XV Benchmark 152.8 114.6 69.3 Dota 2 Reborn 162.8 146.2 122.5 The Witcher 3 167.7 116 GTA V 172.9 105 105.6 146 < 30 fps < 60 fps < 120 fps ≥ 120 fps 2 7 3 9 9 3 6 6 3
AMD Radeon RX 7700S low med. high ultra QHD 4K Cyberpunk 2077 2.0 Phantom Liberty 100.7 80.5 68.1 60.7 37.3 15.8 Baldur's Gate 3 106.8 88 76.4 73.6 51.1 24.7 F1 22 251 221 168 47.7 29.9 11.3 Tiny Tina's Wonderlands 183.5 140.4 92 71.2 47.3 23.1 Strange Brigade 449 202 167.4 143.9 91.9 47.9 Far Cry 5 148 130 123 117 81 39 X-Plane 11.11 97.6 79.3 65 46.8 Final Fantasy XV Benchmark 206 106 74.8 54.5 29 Dota 2 Reborn 174 159.8 156.5 136.8 85.3 The Witcher 3 392.2 277.5 147.1 84 43 GTA V 184 178.6 170.6 95.8 67.1 68.4 < 30 fps < 60 fps < 120 fps ≥ 120 fps 3 8 4 7 5 6 1 6 2 1 4 3 5 4 2
For more games that might be playable and a list of all games and graphics cards visit our Gaming List
v1.26
log 18. 23:48:06
#0 checking url part for id 11620 +0s ... 0s
#1 checking url part for id 11554 +0s ... 0s
#2 not redirecting to Ajax server +0s ... 0s
#3 did not recreate cache, as it is less than 5 days old! Created at Thu, 16 May 2024 05:40:59 +0200 +0.001s ... 0.001s
#4 composed specs +0.125s ... 0.126s
#5 did output specs +0s ... 0.126s
#6 start showIntegratedCPUs +0s ... 0.126s
#7 getting avg benchmarks for device 11620 +0.025s ... 0.151s
#8 got single benchmarks 11620 +0.009s ... 0.16s
#9 getting avg benchmarks for device 11554 +0.002s ... 0.161s
#10 got single benchmarks 11554 +0.008s ... 0.17s
#11 got avg benchmarks for devices +0s ... 0.17s
#12 min, max, avg, median took s +0.088s ... 0.257s
#13 before gaming benchmark output +0s ... 0.257s
#14 Got 109 rows for game benchmarks. +0.04s ... 0.297s
#15 composed SQL query for gamebenchmarks +0s ... 0.298s
#16 got data and put it in $dataArray +0.01s ... 0.307s
#17 benchmarks composed for output. +0.031s ... 0.338s
#18 calculated avg scores. +0s ... 0.338s
#19 return log +0.038s ... 0.376s
Please share our article, every link counts!
Redaktion, 2017-09- 8 (Update: 2023-07- 1)
 Deutsch
 English
 Español
 Français
 Italiano
 Nederlands
 Polski
 Português
 Русский
 Türkçe
 Svenska
 Chinese
 Magyar