NVIDIA GeForce 920M
The NVIDIA GeForce 920M (sometimes also NVIDIA GeForce GT 920M) is an entry level DirectX 12 graphics card. It is based on the 28 nm Kepler architecture and uses the same GK208 chip as the GeForce GT 730M , 825M and 740M . The 384 shaders are clocked at 954 MHz, while the memory (64-bit DDR3 interface) runs at 900 MHz (1800 MHz effective).
Architecture
GK208 is based on the Kepler architecture and offers two shader blocks, called SMX, each with 192 shaders for a total of 384 shader cores. The shaders are clocked at the same speed as the rest of the chip. Furthermore, the GK208 chip has 16 TMUs and 8 ROPs on a 64-bit memory interface.
PCIe 3.0 is now supported by the mobile Kepler series and GPU Boost 2.0 mode can automatically overclock the card if the laptop cooling system allows it. This feature is available on any notebook with a graphics card from the 800M series.
Performance
The GeForce 920M offers a performance similar to the AMD Radeon R7 M260 or R7 M360 and will handle modern games (as of 2014/2015) in low settings only. For comparison, a GeForce 930M is about 20 to 30 percent faster than the 920M.
Features
The feature set of the 920M corresponds to the GT 730M and 825M. This includes support for up to 4 active displays. Furthermore, high resolution monitors of up to 3840x2160 pixels can now be connected using DisplayPort 1.2 or HDMI 1.4a if available. HD-Audio codecs, such as Dolby TrueHD and DTS-HD, can be transmitted via bitstream mode through the HDMI port. However, as most laptops will feature Optimus, the integrated GPU will likely have direct control over the display ports and may limit the feature set available by the Nvidia Kepler cards.
The 5th generation PureVideo HD video processor (VP5) offers hardware decoding of HD videos. Common codecs such as MPEG-1/2, MPEG-4 ASP, H.264 and VC1/WMV9 are fully supported up to 4K resolutions while VC1 and MPEG-4 are supported up to 1080p. Two streams can be decoded in parallel for features such as Picture-in-Picture. Another feature is the inclusion of a dedicated video encoding engine similar to Intel QuickSync that can be accessed via the NVENCI API.
Power Consumption
The power consumption of the GeForce 920M is similar to the 825M and suited for 13-inch laptops and above.
GeForce 900M Series Codename N16V-GM-S Architecture Kepler Pipelines 384 - unified Core Speed 954 MHz Memory Speed 1800 MHz Memory Bus Width 64 Bit Memory Type DDR3 Max. Amount of Memory 4 GB Shared Memory no API DirectX 12 (FL 11_0), Shader 5.0, OpenGL 4.5 Transistor Count 1.3 Billion technology 28 nm Features Optimus, PhysX, Verde Drivers, CUDA, 3D Vision, 3DTV Play, GPU Boost 2.0 Date of Announcement 27.01.2015 Link to Manufacturer Page www.geforce.com
Benchmarks Performance Rating - 3DMark 11 + Fire Strike + Time Spy
0.5 pt (2%)
...
...
max:
3DMark - 3DMark Time Spy Score
363 Points (1%)
Model CPU GPU RAM Value MSI CX61 2QC 2970M MS-16GD 2970M GeForce 920M 954 / 1001 MHz 2 GB 1366x768 display8 GB 363
...
...
max:
3DMark - 3DMark Time Spy Graphics
329 Points (1%)
Model CPU GPU RAM Value MSI CX61 2QC 2970M MS-16GD 2970M GeForce 920M 954 / 1001 MHz 2 GB 1366x768 display8 GB 329
...
...
max:
3DMark - 3DMark Ice Storm Unlimited Graphics
min: 85619 avg: 89910 median: 90619 (10%) max: 93491 Points
...
...
max:
3DMark - 3DMark Ice Storm Extreme Graphics
min: 35690 avg: 39047 median: 39046.5 (5%) max: 42403 Points
...
...
max:
3DMark - 3DMark Cloud Gate Score
min: 4167 avg: 5212 median: 5240.5 (6%) max: 5778 Points
...
...
max:
3DMark - 3DMark Cloud Gate Graphics
min: 7053 avg: 7333 median: 7242 (2%) max: 8206 Points
...
...
max:
3DMark - 3DMark Fire Strike Standard Score
min: 1023 avg: 1051 median: 1047.5 (2%) max: 1099 Points
...
...
max:
3DMark - 3DMark Fire Strike Standard Graphics
min: 1120 avg: 1165 median: 1161.5 (1%) max: 1259 Points
...
...
max:
3DMark - 3DMark Ice Storm Graphics
min: 36457 avg: 52038 median: 51654 (6%) max: 70114 Points
...
...
max:
3DMark 11 - 3DM11 Performance Score
min: 1573 avg: 1797 median: 1822 (3%) max: 1899 Points
...
...
max:
3DMark 11 - 3DM11 Performance GPU
min: 1581 avg: 1711 median: 1718.5 (1%) max: 1816 Points
...
...
max:
3DMark Vantage 3DM Vant. Perf. total + 3DMark Vantage - 3DM Vant. Perf. total
min: 5518 avg: 5587 median: 5587 (2%) max: 5656 Points
...
...
max:
3DM Vant. Perf. GPU no PhysX + 3DMark Vantage - 3DM Vant. Perf. GPU no PhysX
min: 4924 avg: 5033 median: 5032.5 (3%) max: 5141 Points
...
...
max:
3DMark 03 - 3DMark 03 - Standard
23055 Points (12%)
...
...
3DMark 05 - 3DMark 05 - Standard
14564 Points (16%)
...
...
max:
3DMark 06 3DMark 06 - Standard 1280x1024 +
min: 8626 avg: 9190 median: 9003.5 (12%) max: 10128 Points
...
...
max:
Unigine Heaven 2.1 - Heaven 2.1 high
22.1 fps (4%)
...
...
SPECviewperf 11 specvp11 snx-01 + SPECviewperf 11 - specvp11 snx-01
min: 3.23 avg: 3.5 median: 3.5 (2%) max: 3.68 fps
...
...
specvp11 tcvis-02 + SPECviewperf 11 - specvp11 tcvis-02
min: 1.28 avg: 1.3 median: 1.3 (1%) max: 1.31 fps
...
...
specvp11 sw-02 + SPECviewperf 11 - specvp11 sw-02
min: 7.34 avg: 8.1 median: 8.1 (6%) max: 8.85 fps
...
...
specvp11 proe-05 + SPECviewperf 11 - specvp11 proe-05
min: 1.5 avg: 1.7 median: 1.7 (2%) max: 1.9 fps
...
...
specvp11 maya-03 + SPECviewperf 11 - specvp11 maya-03
min: 6.27 avg: 6.5 median: 6.5 (5%) max: 6.72 fps
...
...
max:
specvp11 lightwave-01 + SPECviewperf 11 - specvp11 lightwave-01
min: 14.75 avg: 15.2 median: 15.2 (16%) max: 15.55 fps
...
...
max:
specvp11 ensight-04 + SPECviewperf 11 - specvp11 ensight-04
min: 17.77 avg: 18.3 median: 18.3 (9%) max: 18.73 fps
...
...
specvp11 catia-03 + SPECviewperf 11 - specvp11 catia-03
min: 7.22 avg: 7.4 median: 7.4 (4%) max: 7.67 fps
...
...
Cinebench R10 Cinebench R10 Shading (32bit) + Cinebench R10 - Cinebench R10 Shading (32bit)
min: 1793 avg: 4768 median: 5181.5 (4%) max: 6030 points
...
...
Cinebench R11.5 Cinebench R11.5 OpenGL 64 Bit + Cinebench R11.5 - Cinebench R11.5 OpenGL 64 Bit
min: 10.21 avg: 31.3 median: 34 (12%) max: 39.83 fps
...
...
max:
Cinebench R15 Cinebench R15 OpenGL 64 Bit + Cinebench R15 - Cinebench R15 OpenGL 64 Bit
min: 15.32 avg: 41 median: 44.3 (3%) max: 51.3 fps
...
...
Cinebench R15 OpenGL Ref. Match 64 Bit + Cinebench R15 - Cinebench R15 OpenGL Ref. Match 64 Bit
99.6 % (100%)
...
...
GFXBench - GFXBench Car Chase Offscreen
28.7 fps (3%)
Model CPU GPU RAM Value MSI CX61 2QC 2970M MS-16GD 2970M GeForce 920M 954 / 1001 MHz 2 GB 8 GB 28.7
...
...
GFXBench 3.1 - GFXBench Manhattan ES 3.1 Offscreen
min: 33.9 avg: 35.6 median: 35.6 (1%) max: 37.3 fps
...
...
GFXBench 3.0 - GFXBench 3.0 Manhattan Offscreen
min: 44.5 avg: 46.9 median: 46.9 (3%) max: 49.2 fps
...
...
GFXBench (DX / GLBenchmark) 2.7 GFXBench T-Rex HD Offscreen C24Z16 + GFXBench (DX / GLBenchmark) 2.7 - GFXBench T-Rex HD Offscreen C24Z16
min: 95.8 avg: 98.4 median: 98.4 (1%) max: 100.9 fps
...
...
LuxMark v2.0 64Bit - LuxMark v2.0 Room GPU
280 Samples/s (1%)
...
...
max:
LuxMark v2.0 64Bit - LuxMark v2.0 Sala GPU
586 Samples/s (1%)
...
...
max:
ComputeMark v2.1 - ComputeMark v2.1 Result
1323 points (1%)
...
...
max:
Power Consumption - Furmark Stress Test Power Consumption - external Monitor *
49.2 Watt (7%)
Model CPU GPU RAM Value MSI CX61 2QC 2970M MS-16GD 2970M GeForce 920M 954 / 1001 MHz 2 GB 8 GB 49.2
...
...
max:
Power Consumption - The Witcher 3 Power Consumption - external Monitor *
46.1 Watt (6%)
Model CPU GPU RAM Value MSI CX61 2QC 2970M MS-16GD 2970M GeForce 920M 954 / 1001 MHz 2 GB 8 GB 46.1
...
...
max:
- Range of benchmark values for this graphics card
- Average benchmark values for this graphics card
* Smaller numbers mean a higher performance
Game Benchmarks The following benchmarks stem from our benchmarks of review laptops. The performance depends on the used graphics memory, clock rate, processor, system settings, drivers, and operating systems. So the results don't have to be representative for all laptops with this GPU. For detailed information on the benchmark results, click on the fps number.
...
max:
» The benchmarks indicate that the game is not playable in the tested settings.
...
max:
...
max:
...
max:
...
max:
» With all tested laptops playable in detail settings ultra.
...
...
max:
...
max:
» The benchmarks indicate that the game is not playable in the tested settings.
...
max:
» The benchmarks indicate that the game is not playable in the tested settings.
...
...
max:
» The benchmarks indicate that the game is not playable in the tested settings.
...
...
max:
...
...
max:
» The benchmarks indicate that the game is not playable in the tested settings.
...
...
max:
» The benchmarks indicate that the game is not playable in the tested settings.
...
...
max:
...
...
...
...
max:
» With all tested laptops playable in detail settings low.
...
...
max:
...
max:
...
max:
» With all tested laptops playable in detail settings low.
...
...
max:
» The benchmarks indicate that the game is not playable in the tested settings.
...
...
» The benchmarks indicate that the game is not playable in the tested settings.
...
max:
» The benchmarks indicate that the game is not playable in the tested settings.
...
...
max:
...
max:
...
max:
» The benchmarks indicate that the game is not playable in the tested settings.
...
max:
...
...
max:
» The benchmarks indicate that the game is not playable in the tested settings.
...
...
max:
» The benchmarks indicate that the game is not playable in the tested settings.
...
...
max:
» The benchmarks indicate that the game is not playable in the tested settings.
...
...
...
» The benchmarks indicate that the game is not playable in the tested settings.
...
...
max:
» The benchmarks indicate that the game is not playable in the tested settings.
...
...
...
...
...
max:
» With all tested laptops playable in detail settings low.
...
...
max:
...
...
max:
...
...
max:
...
max:
» The benchmarks indicate that the game is not playable in the tested settings.
...
...
max:
» The benchmarks indicate that the game is not playable in the tested settings.
...
...
max:
» The benchmarks indicate that the game is not playable in the tested settings.
...
...
max:
...
...
max:
» With all tested laptops playable in detail settings low.
...
...
max:
...
max:
...
max:
» The benchmarks indicate that the game is not playable in the tested settings.
...
max:
...
...
max:
...
max:
» With all tested laptops playable in detail settings low.
...
max:
...
...
» The benchmarks indicate that the game is not playable in the tested settings.
...
...
max:
» The benchmarks indicate that the game is not playable in the tested settings.
...
...
max:
» The benchmarks indicate that the game is not playable in the tested settings.
...
...
» The benchmarks indicate that the game is not playable in the tested settings.
...
max:
...
...
» The benchmarks indicate that the game is not playable in the tested settings.
...
...
...
...
max:
» The benchmarks indicate that the game is not playable in the tested settings.
...
max:
» The benchmarks indicate that the game is not playable in the tested settings.
...
...
0 Tooltip CX61 2QC 2970M MS-16GD: Ø54.4 (52.6-55.8)
...
...
» With all tested laptops playable in detail settings high.
...
...
...
...
max:
» With all tested laptops playable in detail settings low.
...
...
...
...
max:
...
...
max:
» With all tested laptops playable in detail settings low.
...
max:
...
...
max:
» The benchmarks indicate that the game is not playable in the tested settings.
...
...
max:
» With all tested laptops playable in detail settings low.
Additional Benchmarks
Medium / Off FXAA 1366x768
32.1 [X] MSI CX61 2QC 2970M MS-16GD 672392
Intel Celeron 2970M 2.2GHz
GeForce 920M
min:
27 fps, max:
37 fps
...
max:
...
...
...
...
max:
...
...
max:
» With all tested laptops playable in detail settings med..
...
...
max:
...
...
max:
» The benchmarks indicate that the game is not playable in the tested settings.
...
...
...
...
» With all tested laptops playable in detail settings low.
...
...
max:
...
max:
» The benchmarks indicate that the game is not playable in the tested settings.
...
max:
» The benchmarks indicate that the game is not playable in the tested settings.
...
...
max:
...
...
max:
» The benchmarks indicate that the game is not playable in the tested settings.
...
...
...
...
...
» With all tested laptops playable in detail settings med..
Additional Benchmarks
Medium (Render Scale 100 %) 2xAF FXAA 1920x1080
22.1 [X] MSI CX61 2QC 2970M MS-16GD 672392
Intel Celeron 2970M 2.2GHz
GeForce 920M
min:
18 fps, max:
27 fps
...
...
...
» The benchmarks indicate that the game is not playable in the tested settings.
...
...
...
...
» The benchmarks indicate that the game is not playable in the tested settings.
...
...
» The benchmarks indicate that the game is not playable in the tested settings.
...
...
...
...
» The benchmarks indicate that the game is not playable in the tested settings.
...
...
max:
...
...
max:
» The benchmarks indicate that the game is not playable in the tested settings.
...
...
» The benchmarks indicate that the game is not playable in the tested settings.
...
...
» The benchmarks indicate that the game is not playable in the tested settings.
...
...
max:
...
...
max:
...
max:
...
max:
» The benchmarks indicate that the game is not playable in the tested settings.
...
...
max:
...
...
max:
...
...
max:
...
...
max:
» With all tested laptops playable in detail settings low.
...
...
max:
...
...
max:
...
...
max:
...
max:
» The benchmarks indicate that the game is not playable in the tested settings.
0 (!) [X] MSI CX61 2QC 2970M MS-16GD Intel Celeron 2970M 2.2GHz
GeForce 920M
Problem during benchmarking occured: game wont start black screen due to dual core CPU?34.7 ~ 17 fps
+ Compare
- Hide Comparison
...
...
...
max:
...
...
» The benchmarks indicate that the game is not playable in the tested settings.
...
...
max:
» The benchmarks indicate that the game is not playable in the tested settings.
...
...
...
...
...
...
...
max:
» The benchmarks indicate that the game is not playable in the tested settings.
...
...
max:
...
...
max:
» The benchmarks indicate that the game is not playable in the tested settings.
...
...
...
...
...
...
max:
...
...
max:
» The benchmarks indicate that the game is not playable in the tested settings.
...
...
max:
...
...
max:
...
...
» With all tested laptops playable in detail settings high.
...
...
max:
...
...
max:
...
...
max:
...
...
max:
» With all tested laptops playable in detail settings med..
...
...
max:
» The benchmarks indicate that the game is not playable in the tested settings.
...
...
max:
...
...
max:
...
...
max:
...
...
max:
» With all tested laptops playable in detail settings med..
...
...
...
...
...
...
...
» The benchmarks indicate that the game is not playable in the tested settings.
...
...
max:
...
...
max:
...
...
max:
...
...
max:
» The benchmarks indicate that the game is not playable in the tested settings.
...
...
...
...
max:
...
...
...
...
» With all tested laptops playable in detail settings low.
...
...
max:
...
...
max:
...
...
max:
...
max:
» With all tested laptops playable in detail settings med..
...
...
...
...
...
...
...
...
» With all tested laptops playable in detail settings low.
...
...
...
...
...
...
...
» The benchmarks indicate that the game is not playable in the tested settings.
...
...
...
...
...
...
» The benchmarks indicate that the game is not playable in the tested settings.
...
...
max:
...
...
max:
...
...
...
...
max:
» The benchmarks indicate that the game is not playable in the tested settings.
...
...
...
...
...
...
» The benchmarks indicate that the game is not playable in the tested settings.
...
...
...
...
...
...
» The benchmarks indicate that the game is not playable in the tested settings.
...
...
...
...
...
max:
...
max:
» With all tested laptops playable in detail settings low.
...
...
max:
...
...
...
...
...
...
» With all tested laptops playable in detail settings high.
...
...
...
...
...
» The benchmarks indicate that the game is not playable in the tested settings.
...
...
...
...
...
...
...
» The benchmarks indicate that the game is not playable in the tested settings.
...
...
max:
...
...
max:
...
...
max:
...
» With all tested laptops playable in detail settings low.
...
...
...
...
...
...
...
» The benchmarks indicate that the game is not playable in the tested settings.
...
...
...
...
max:
...
...
max:
» With all tested laptops playable in detail settings high.
...
...
max:
...
...
max:
...
...
...
...
max:
» With all tested laptops playable in detail settings med..
...
...
...
...
max:
...
...
max:
...
...
» With all tested laptops playable in detail settings low.
...
...
...
...
...
...
max:
...
...
max:
» With all tested laptops playable in detail settings med..
...
...
max:
...
...
max:
...
...
max:
...
» With all tested laptops playable in detail settings low.
...
...
...
...
...
...
» With all tested laptops playable in detail settings low.
...
...
...
...
...
...
...
...
» The benchmarks indicate that the game is not playable in the tested settings.
...
...
max:
...
...
max:
...
...
max:
...
...
max:
» With all tested laptops playable in detail settings med..
...
...
...
...
...
...
» With all tested laptops playable in detail settings med..
...
...
...
...
» The benchmarks indicate that the game is not playable in the tested settings.
...
...
...
...
...
...
...
...
max:
» With most tested laptops playable in detail settings med..
...
...
...
...
...
...
...
...
» With most tested laptops playable in detail settings high.
...
...
...
...
...
...
...
...
» With all tested laptops playable in detail settings med..
...
...
max:
...
...
max:
» The benchmarks indicate that the game is not playable in the tested settings.
...
...
...
...
...
...
...
...
» With all tested laptops playable in detail settings low.
...
...
» With all tested laptops playable in detail settings ultra.
...
...
...
...
...
...
...
...
max:
» With all tested laptops playable in detail settings ultra.
...
...
...
...
...
...
...
...
» With most tested laptops playable in detail settings med..
...
...
» The benchmarks indicate that the game is not playable in the tested settings.
...
...
...
...
max:
NVIDIA GeForce GTX 580
...
...
» With all tested laptops playable in detail settings high.
For more games that might be playable and a list of all games and graphics cards visit our Gaming List
v1.26
log 17. 14:54:16
#0 no ids found in url (should be separated by "_") +0s ... 0s
#1 not redirecting to Ajax server +0s ... 0s
#2 did not recreate cache, as it is less than 5 days old! Created at Tue, 16 Apr 2024 05:39:00 +0200 +0.001s ... 0.001s
#3 composed specs +0.043s ... 0.044s
#4 did output specs +0s ... 0.044s
#5 start showIntegratedCPUs +0s ... 0.044s
#6 getting avg benchmarks for device 6220 +0.029s ... 0.073s
#7 got single benchmarks 6220 +0.04s ... 0.113s
#8 got avg benchmarks for devices +0s ... 0.113s
#9 min, max, avg, median took s +0.724s ... 0.837s
#10 before gaming benchmark output +0s ... 0.837s
#11 Got 421 rows for game benchmarks. +0.027s ... 0.864s
#12 composed SQL query for gamebenchmarks +0s ... 0.864s
#13 got data and put it in $dataArray +0.064s ... 0.928s
#14 benchmarks composed for output. +2.267s ... 3.195s
#15 return log +0.051s ... 3.246s
Notebook reviews with NVIDIA GeForce 920M graphics card
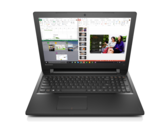
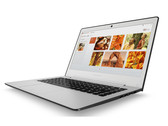
Lenovo IdeaPad 300-15IBR Notebook Review Daily companion. Large display, enough performance to handle the various daily tasks on might encounter and an attractive price point: Lenovo's IdeaPad 300 cost...
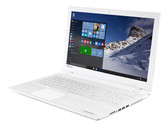
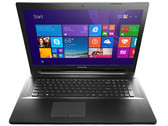
Intel Pentium N3700 | NVIDIA GeForce 920M | 15.60" | 2.3 kg
Toshiba Satellite C55-C-1NE Notebook Review Average Joe? The Toshiba Satellite C55-C is an entry-level notebook designed for word processing and multimedia tasks. The spec sheet lacks any real highlights ...
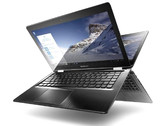
Intel Core i3-5005U | NVIDIA GeForce 920M | 15.60" | 2.2 kg
Lenovo Yoga 500-14ISK Notebook Review Don't expect too much! Lenovo's Yoga 500 is another 2-in-1 convertible with a 14-inch screen on the market. It is supposed to continue the success of the Yoga ...
Intel Core i5-6200U | NVIDIA GeForce 920M | 14.00" | 1.8 kg
Lenovo U31-70 80M5003EGE Notebook Review Lack of endurance. Lenovo's 13.3-inch subnotebook attracts with its good connectivity. However, the battery life is, unfortunately, just middling.
Intel Core i7-5500U | NVIDIA GeForce 920M | 13.30" | 1.5 kg
Lenovo B70-80 80MR0006GE Notebook Review More than mediocre? The less expensive devices from Lenovo in particular often got a very mediocre rating in the recent past; the author was obviously disappoi...
Intel Core i5-5200U | NVIDIA GeForce 920M | 17.30" | 2.8 kg
Dell Inspiron 17-5758 : Intel Core i7-5500U, 17.30", 2.8 kg
Review » Dell Inspiron 17-5758 Notebook Review
Dell Inspiron 15-5558 : Intel Core i5-5200U, 15.60", 2 kg
Review » Dell Inspiron 15-5558 Notebook Review
Asus F555LJ-XX110H : Intel Core i3-5010U, 15.60", 2.3 kg
Review » Asus F555LJ (GeForce 920M) Notebook Review
Asus K541UJ-GQ125T : Intel Core i7-7500U, 15.60", 2 kg
External Review » Asus K541UJ-GQ125T
Asus K541UJ-GQ109T : Intel Core i5-7200U, 15.60", 2 kg
External Review » Asus K541UJ-GQ109T
Asus K541UJ-GQ108T : Intel Core i5-7200U, 15.60", 2 kg
External Review » Asus K541UJ-GQ108T
Asus K541UJ-GQ481T : Intel Core i7-7500U, 15.60", 2 kg
External Review » Asus K541UJ-GQ481T
Asus K541UJ-GQ127T : Intel Core i7-7500U, 15.60", 2 kg
External Review » Asus K541UJ-GQ127T
Asus K541UJ-GQ110T : Intel Core i5-7200U, 15.60", 2 kg
External Review » Asus K541UJ-GQ110T
Asus X555SJ : Intel Pentium N3700, 15.60", 2.3 kg
External Review » Asus X555SJ
Asus K541UV-XX335T : Intel Core i7-6500U, 15.60", 2.2 kg
External Review » Asus K541UV-XX335T
Asus F556UJ-XO155T : Intel Core i3-6100U, 15.60", 2.3 kg
External Review » Asus F556UJ-XO155T
Asus X556UJ-XO044T : Intel Core i7-6500U, 15.60", 2.3 kg
External Review » Asus X556UJ-XO044T
Asus X556UJ-XO001T : Intel Core i7-6500U, 15.60", 2.3 kg
External Review » Asus X556UJ-XO001T
Lenovo Yoga 500-14ISK : Intel Core i5-6200U, 14.00", 1.8 kg
External Review » Lenovo Yoga 500-14ISK
Asus X302UJ : Intel Core i5-6200U, 13.30", 1.6 kg
External Review » Asus X302UJ
Acer Aspire E5-573G-548N : Intel Core i5-5200U, 15.60", 2.4 kg
External Review » Acer Aspire E5-573G-548N
Lenovo B70-80 80MR0006GE : Intel Core i5-5200U, 17.30", 2.8 kg
External Review » Lenovo B70-80 80MR0006GE
Toshiba Satellite C55-C-1F0 : Intel Core i3-4005U, 15.60", 2.1 kg
External Review » Toshiba Satellite C55-C-1F0
Asus X554LJ-XX002D : Intel Core i3-5010U, 15.60", 2.6 kg
External Review » Asus X554LJ-XX002D
Lenovo Yoga 500-14-80N400JKGE : Intel Core i5-5200U, 14.00", 1.8 kg
External Review » Lenovo Yoga 500-14-80N400JKGE
Dell Inspiron 15-5558 : Intel Core i5-5200U, 15.60", 2 kg
External Review » Dell Inspiron 15-5558
Dell Inspiron 17-5758 : Intel Core i7-5500U, 17.30", 2.8 kg
External Review » Dell Inspiron 17-5758-4753
Please share our article, every link counts!
» Comparison of GPUs Detailed list of all laptop GPUs sorted by class and performance.
» Benchmark List Sort and restrict laptop GPUs based on performance in synthetic benchmarks.
» Notebook Gaming List Playable games for each graphics card and their average FPS results.
Class 1
Class 2 Radeon PRO W6600M *
Class 3 UHD Graphics 32EUs
UHD Graphics 750
Class 4
Class 5 * Approximate position of the graphics adapter
Working For Notebookcheck
Are you a techie who knows how to translate? Then join our Team!
Details here
Top 10 Laptops Multimedia , Budget Multimedia , Gaming , Budget Gaming , Lightweight Gaming , Business , Budget Office , Workstation , Subnotebooks , Ultrabooks , Chromebooks
under 300 USD/Euros , under 500 USD/Euros , 1,000 USD/Euros , for University Students , Best Displays
Top 10 Smartphones Smartphones , Phablets , ≤6-inch , Camera Smartphones
Klaus Hinum (Update: 2016-01-26)