 Deutsch
 English
 Español
 Français
 Italiano
 Nederlands
 Polski
 Português
 Русский
 Türkçe
 Svenska
 Chinese
 Magyar
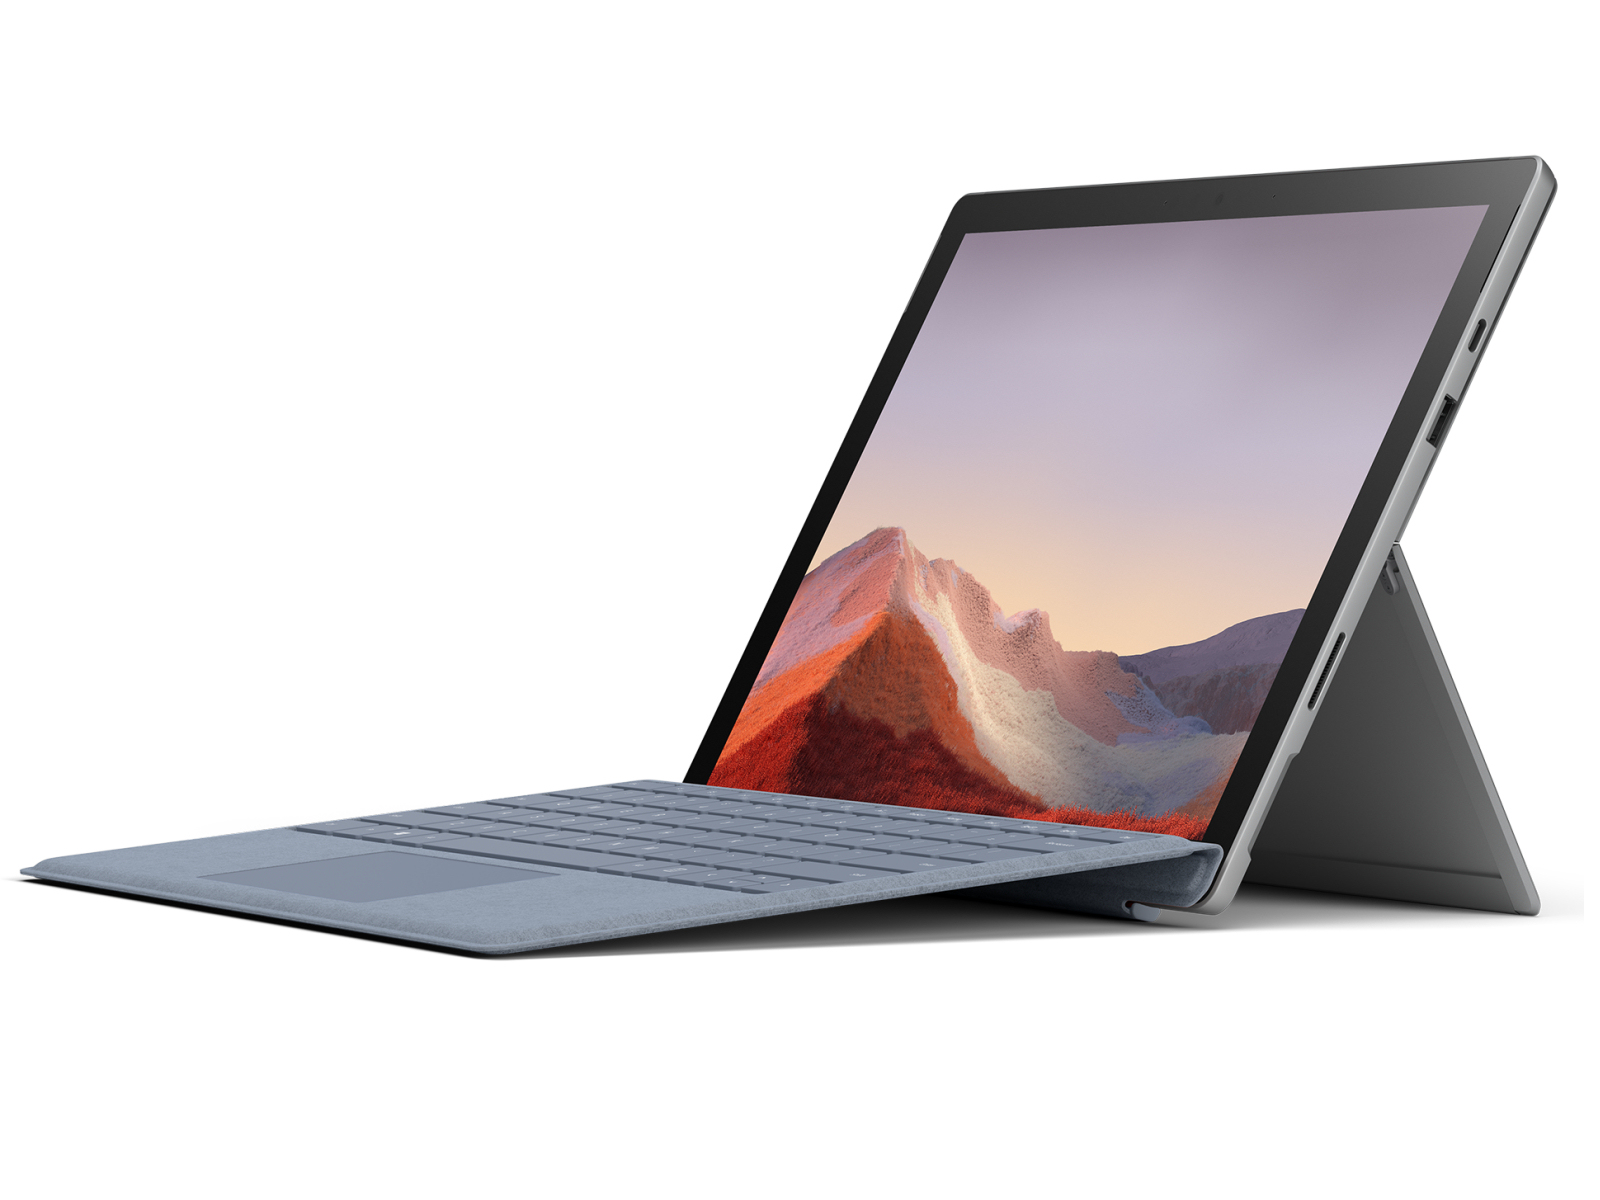
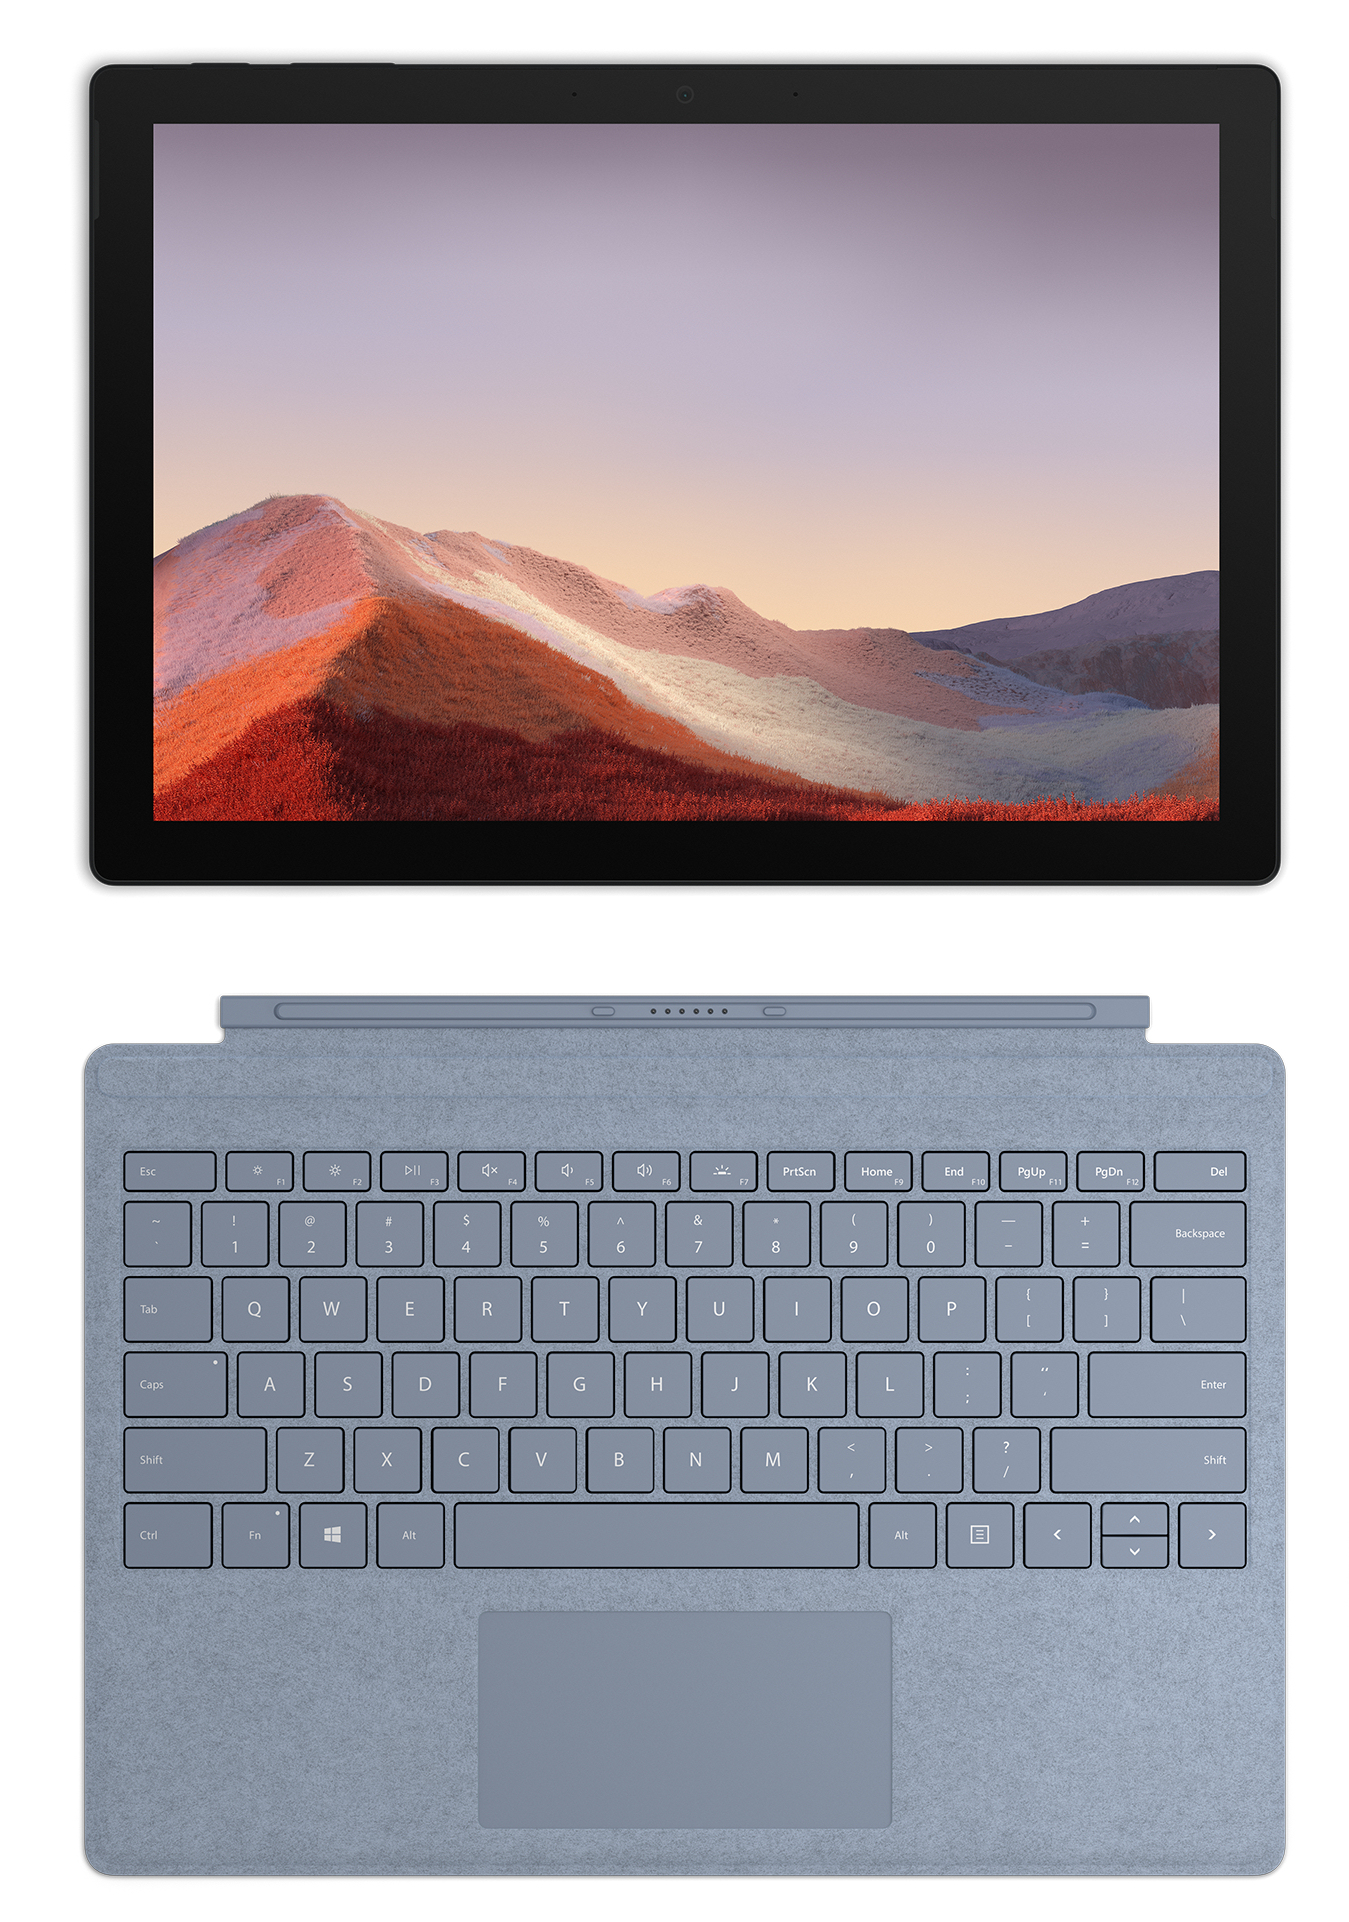
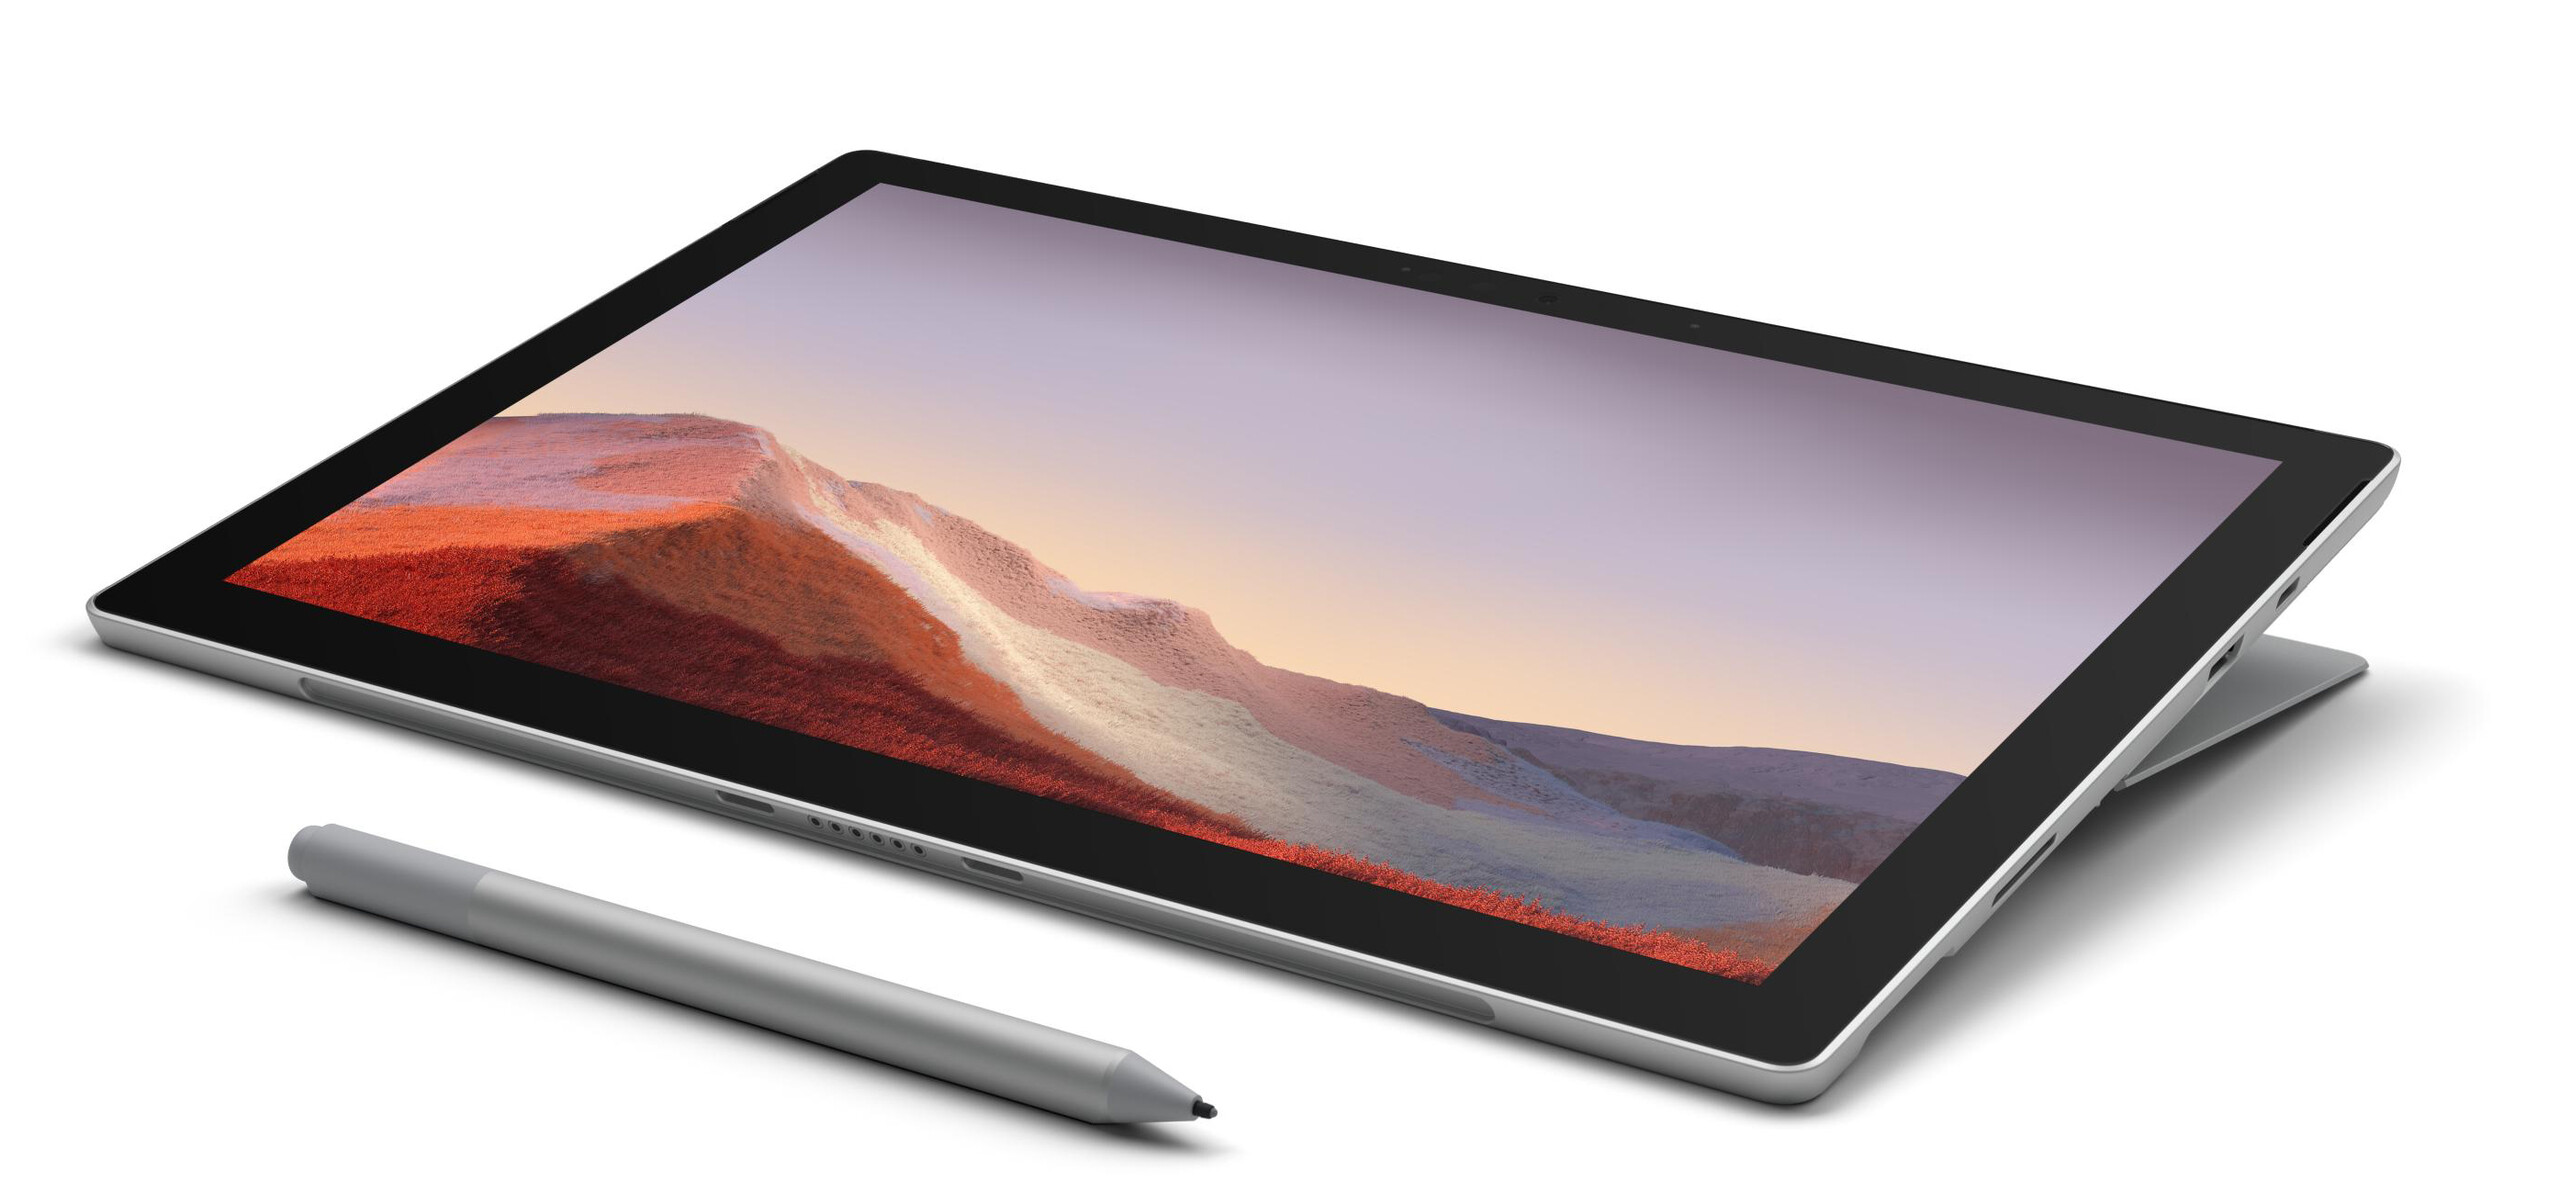
Microsoft Surface Pro 7 Plus in review: Tiger Lake provides a performance boost

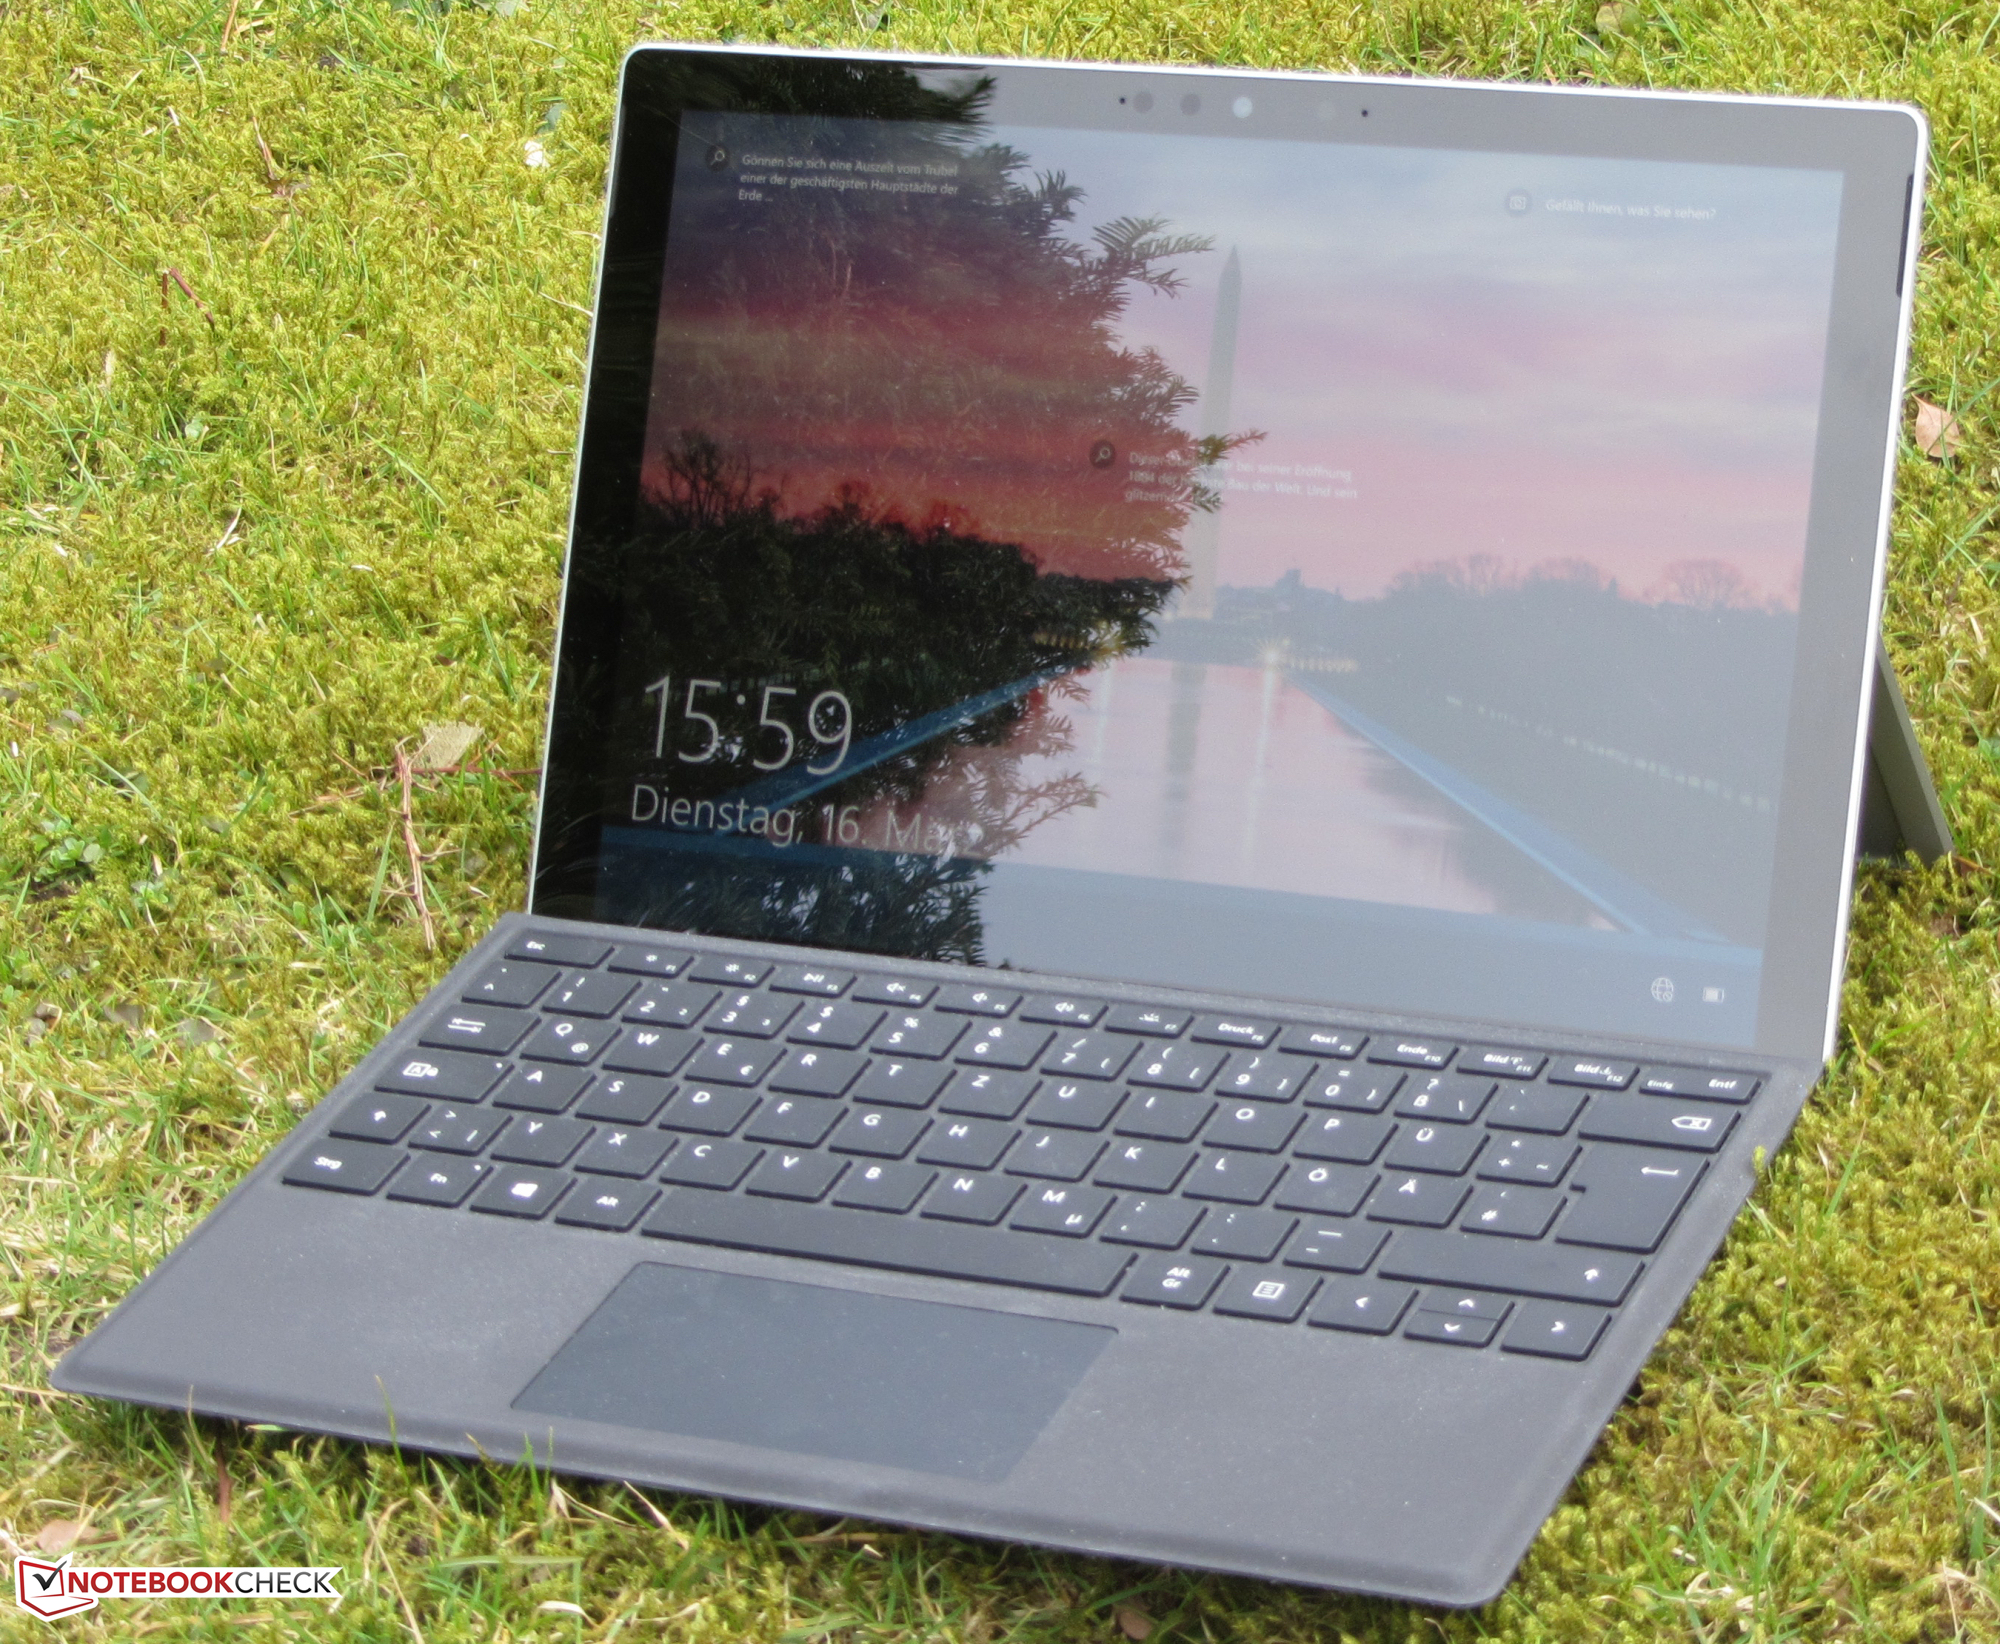
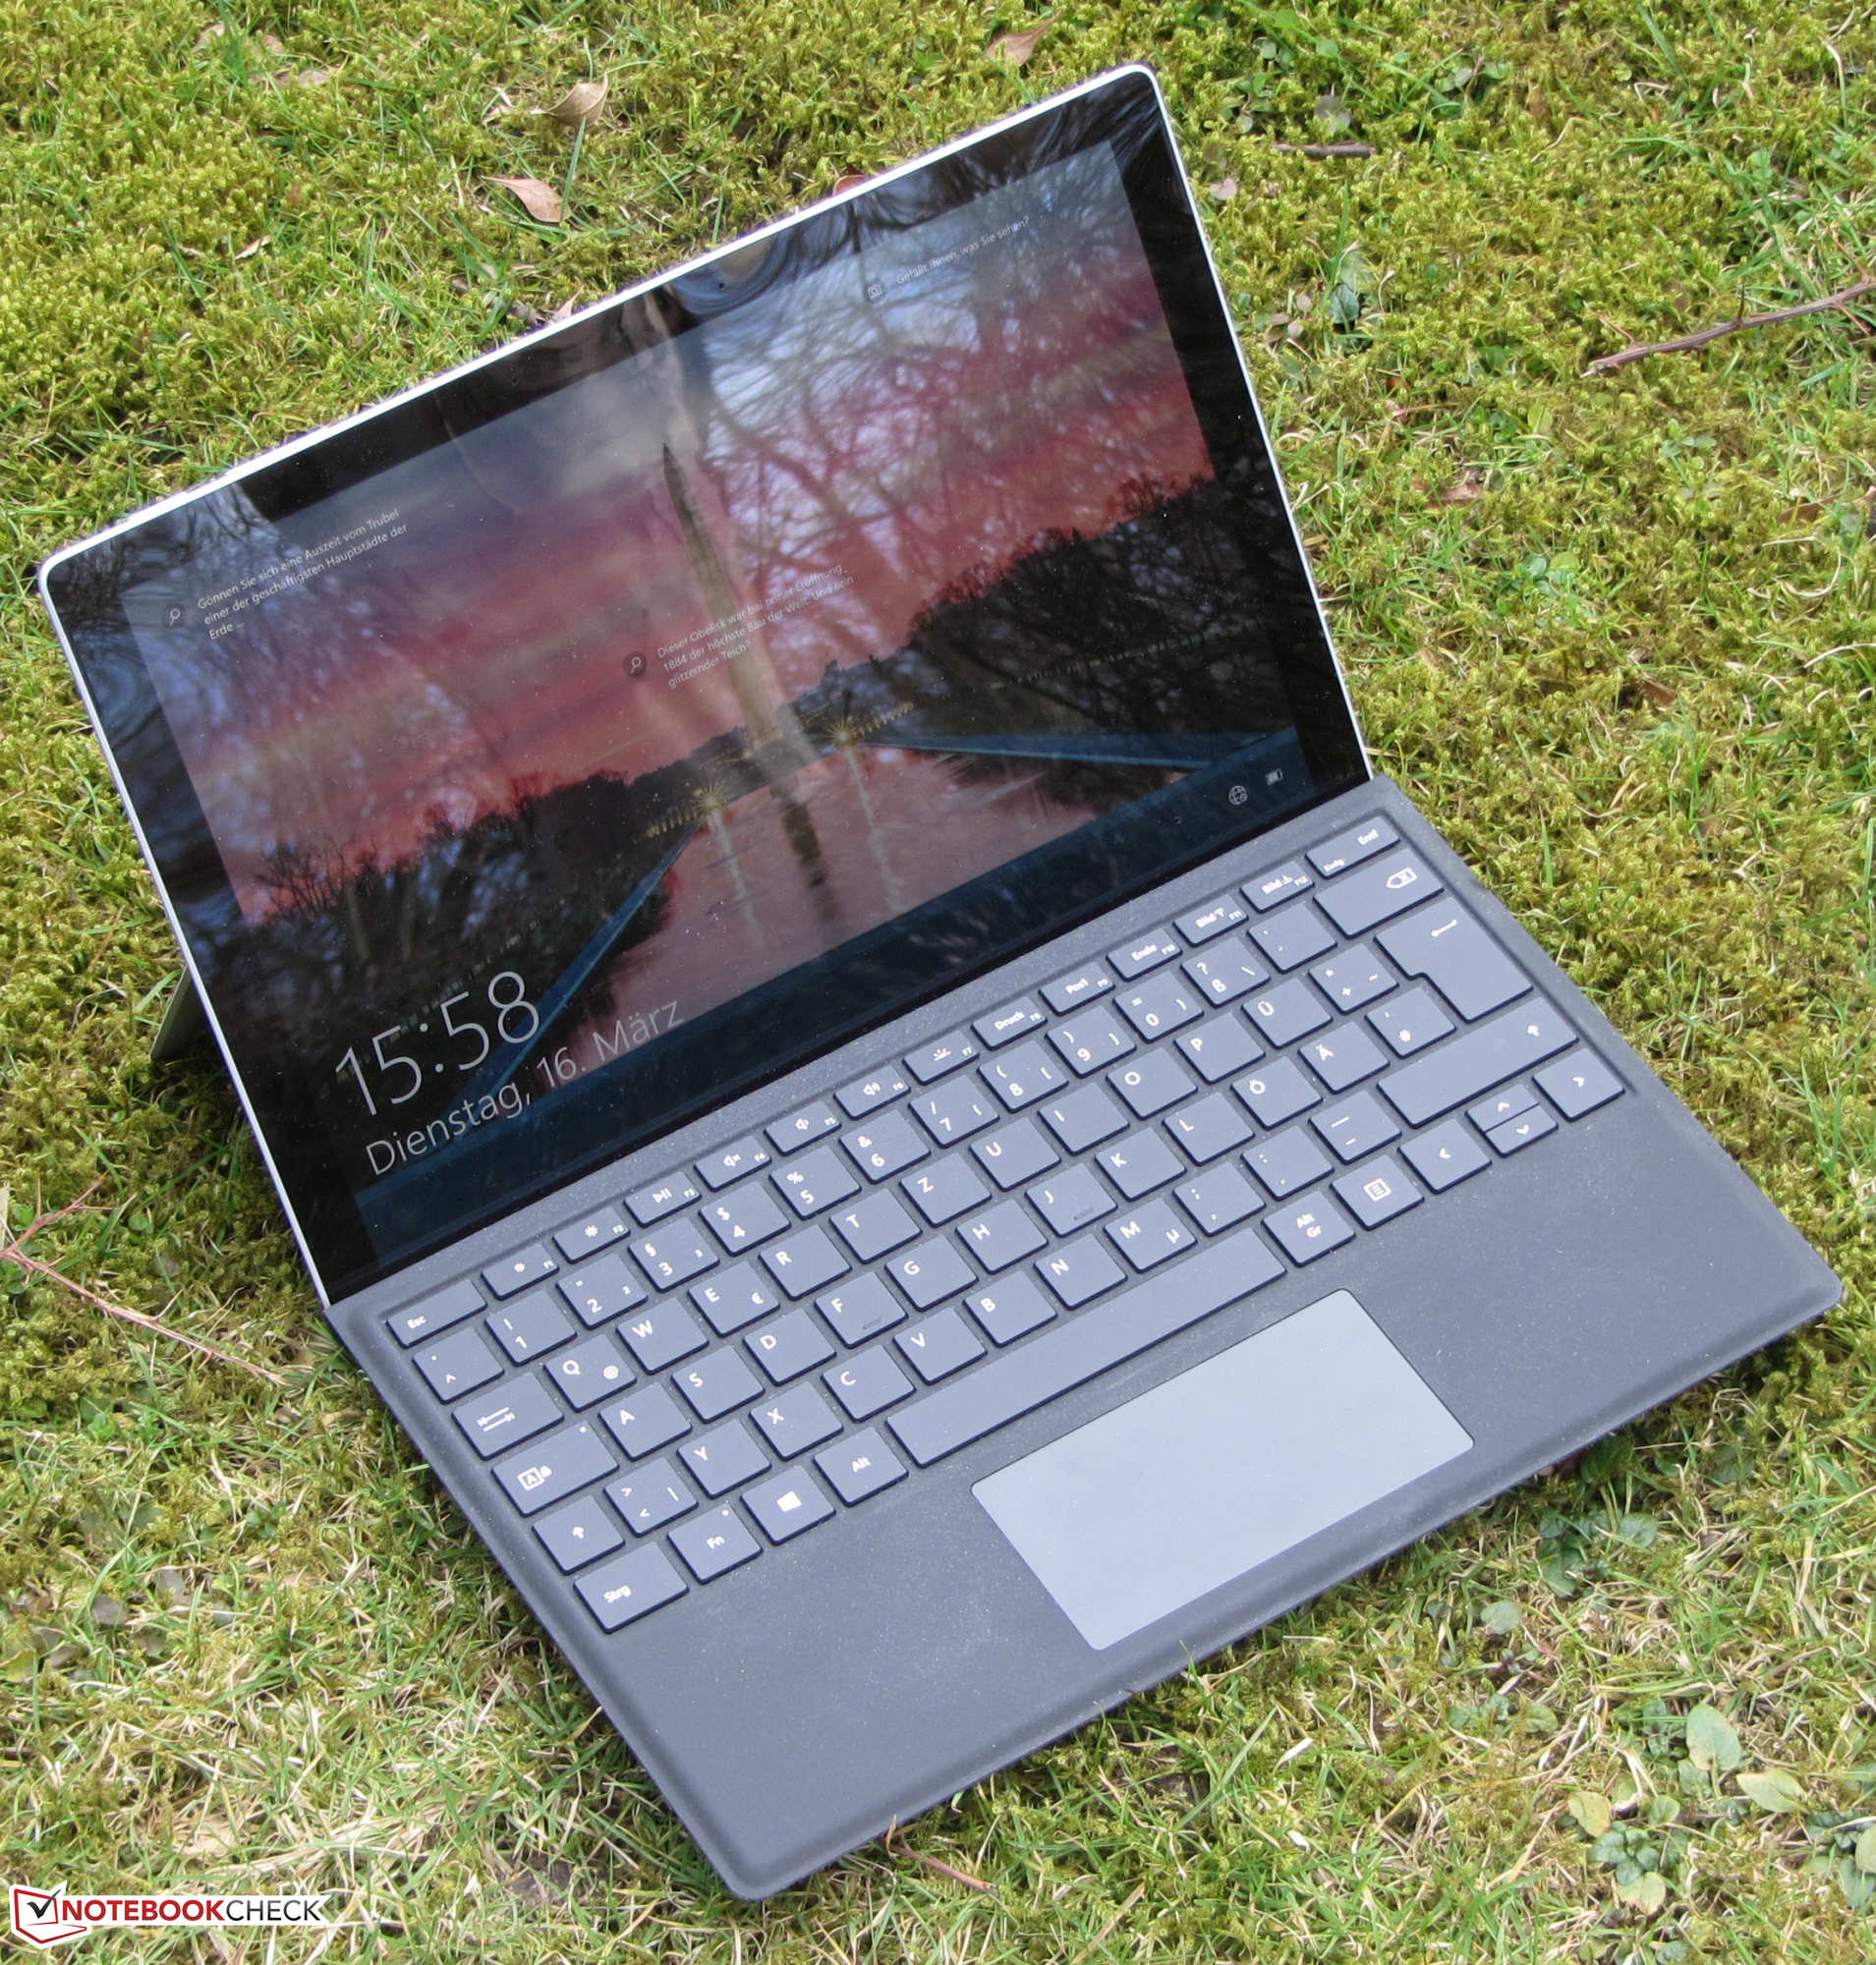
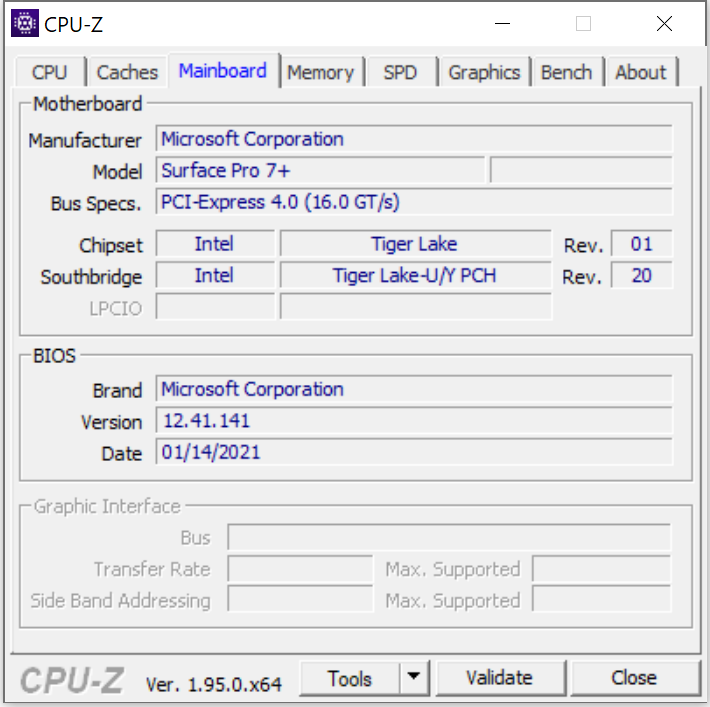
The Surface Pro 7 has been available since 2019. Therefore, Microsoft considers that the time has come to introduce some updates. Inside, there are now Tiger Lake instead of Ice Lake processors, the SSD can be replaced, the battery capacity has increased a bit, and an LTE modem is optionally available - the latter only in combination with a Core i5 processor. Externally, practically nothing has changed compared to the regular Surface Pro 7 models. The Surface Pro 7 Plus competes with the Dell Latitude 12 7210 and the Lenovo Yoga Duet 7.
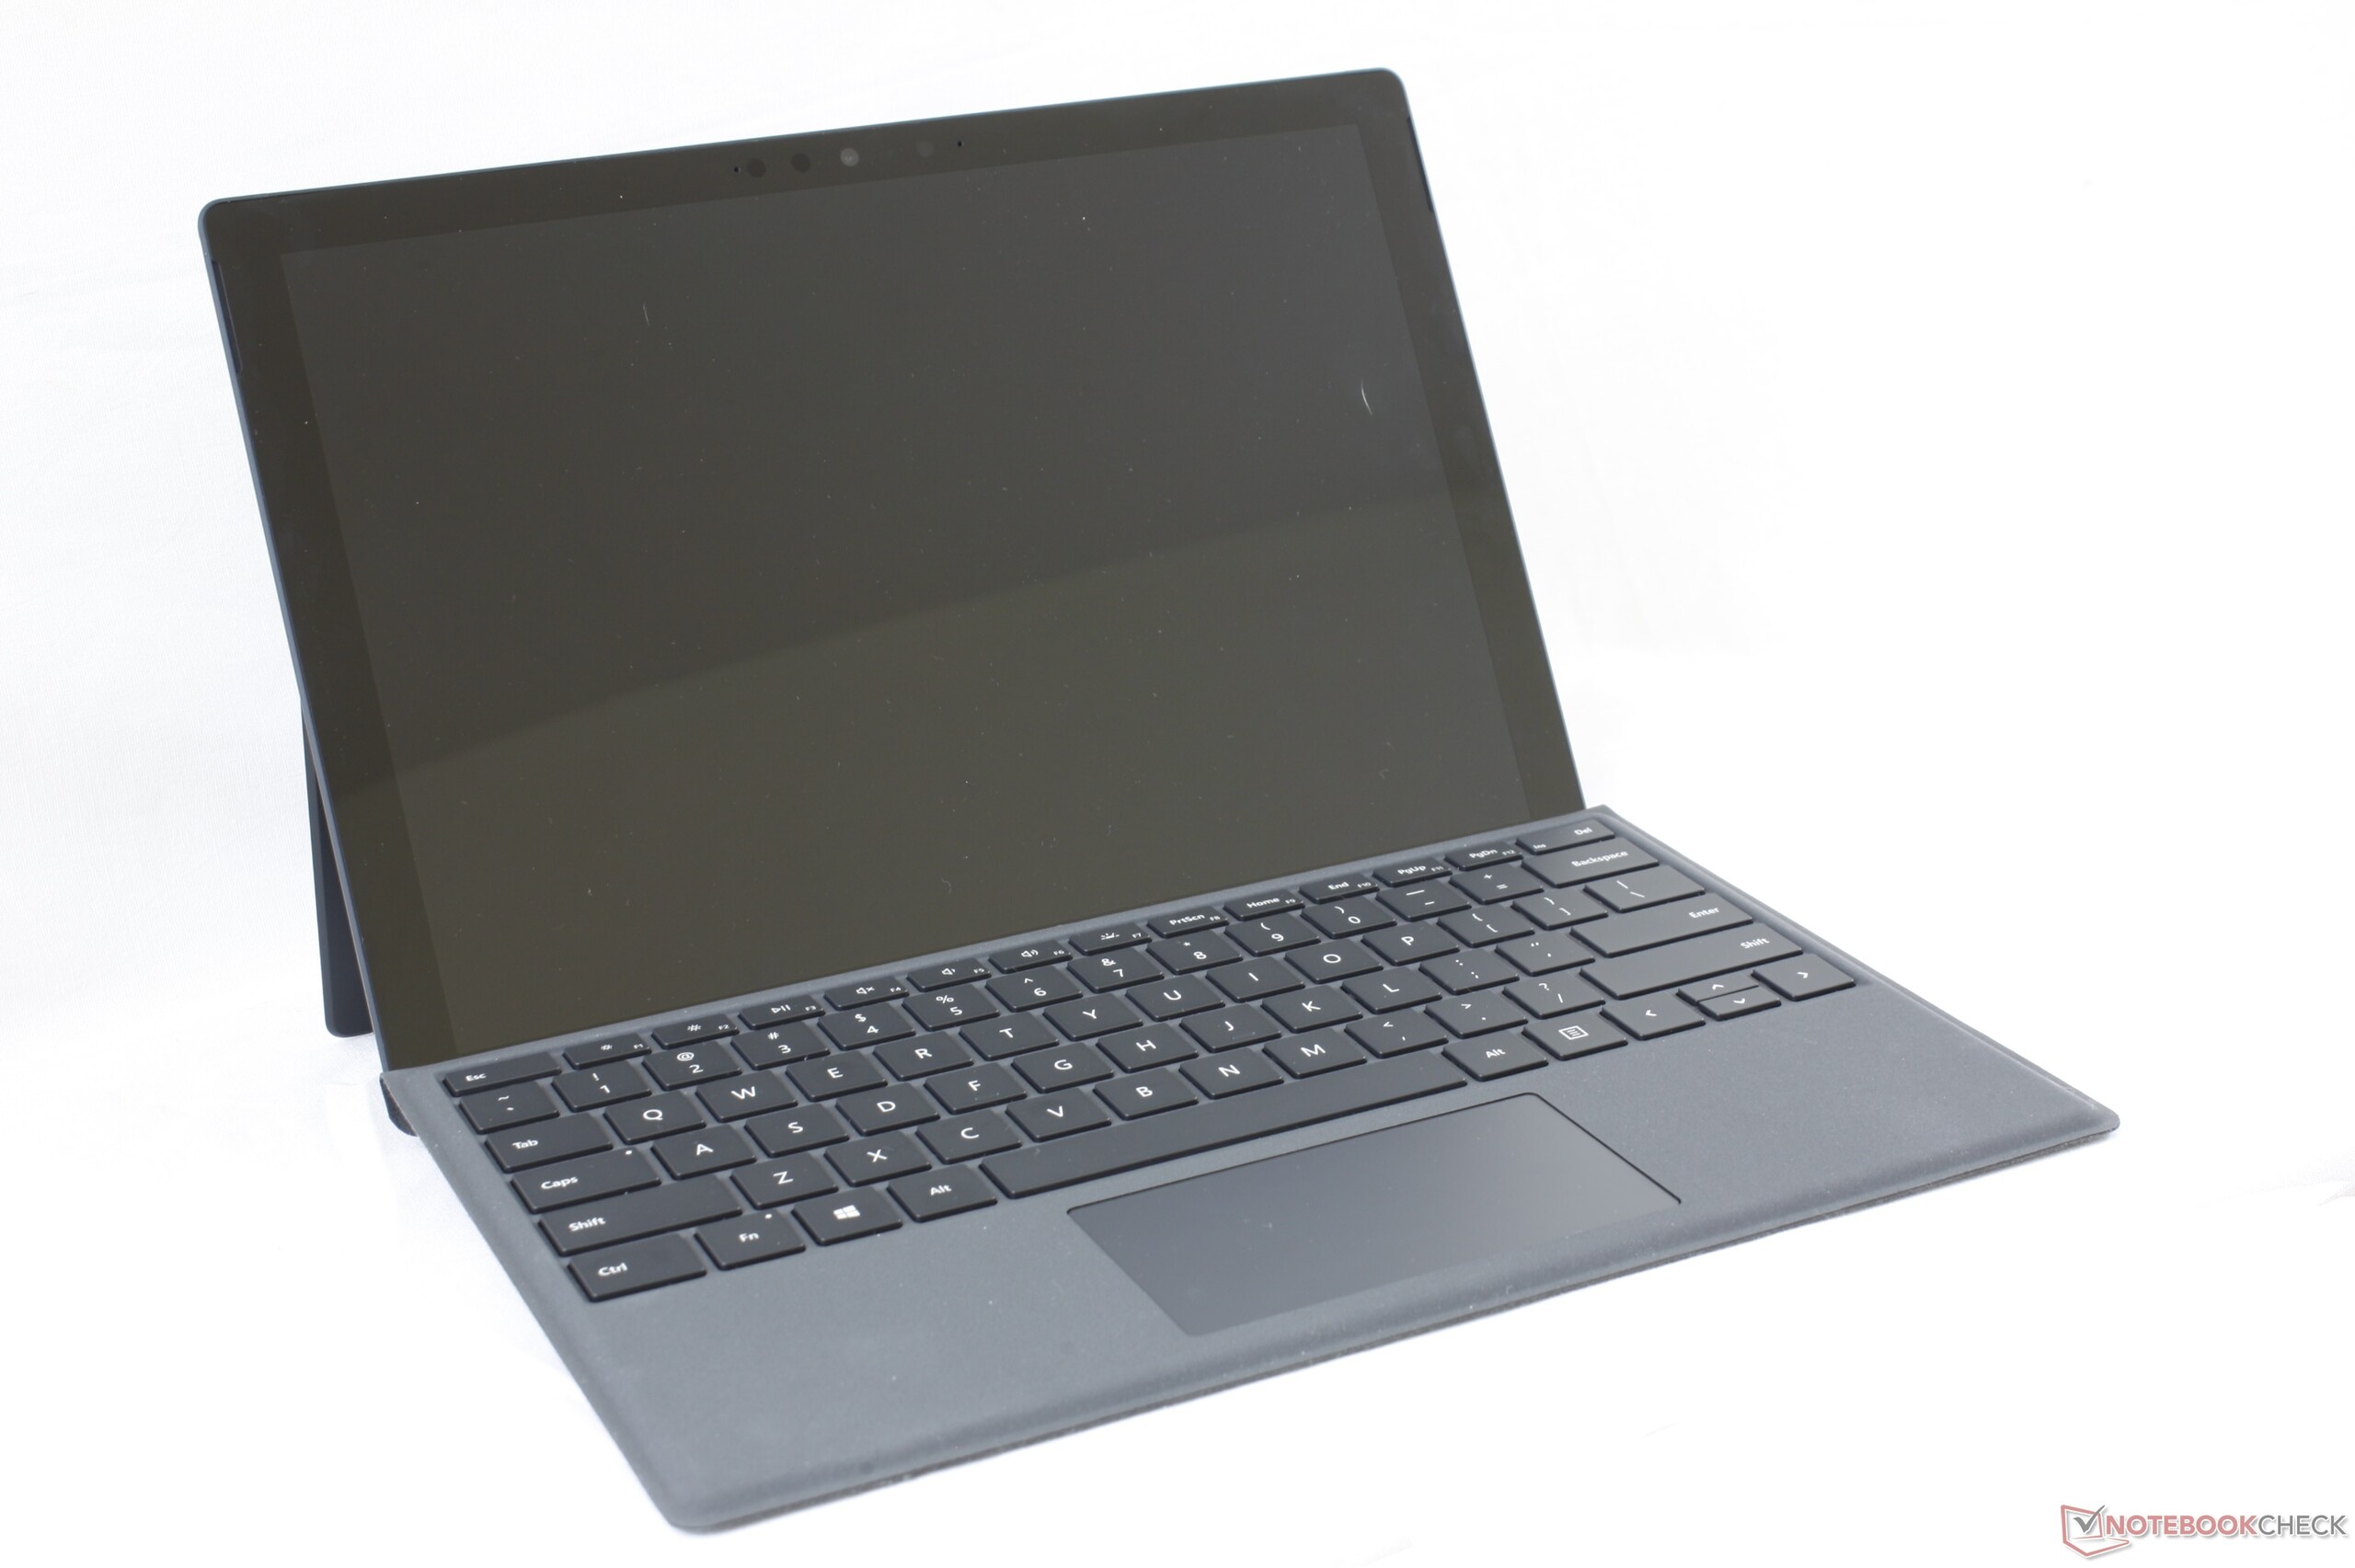
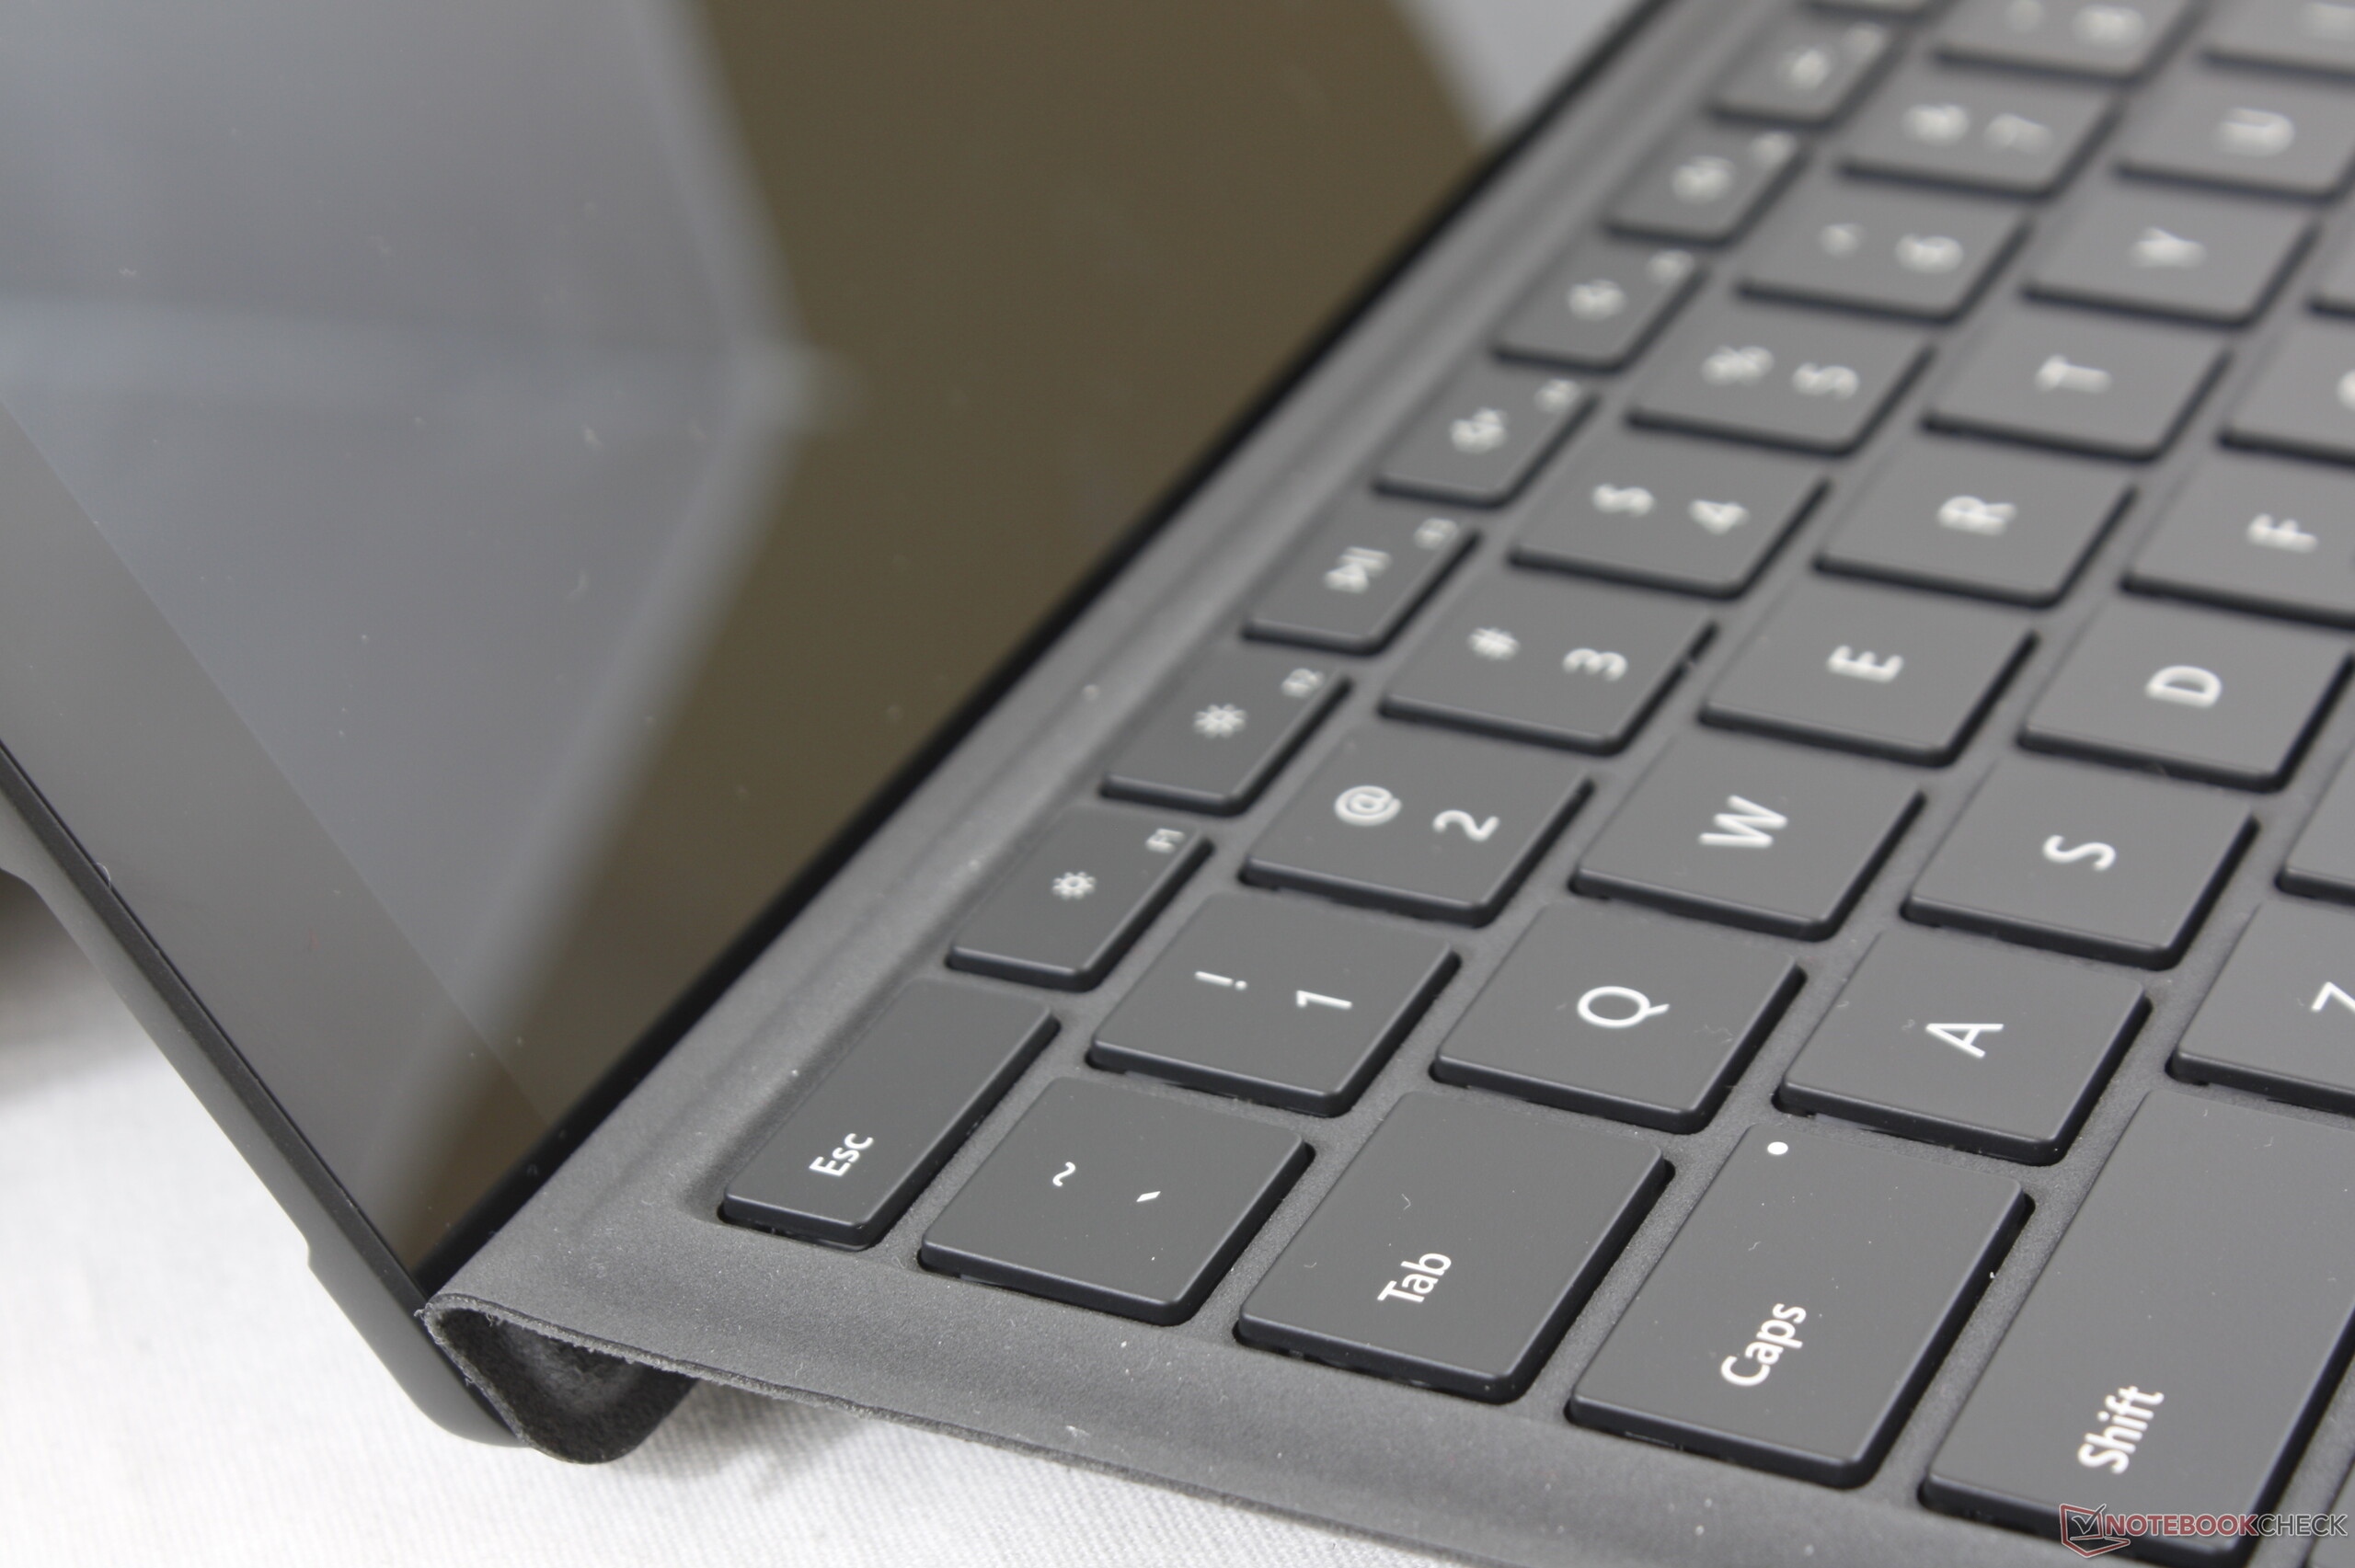
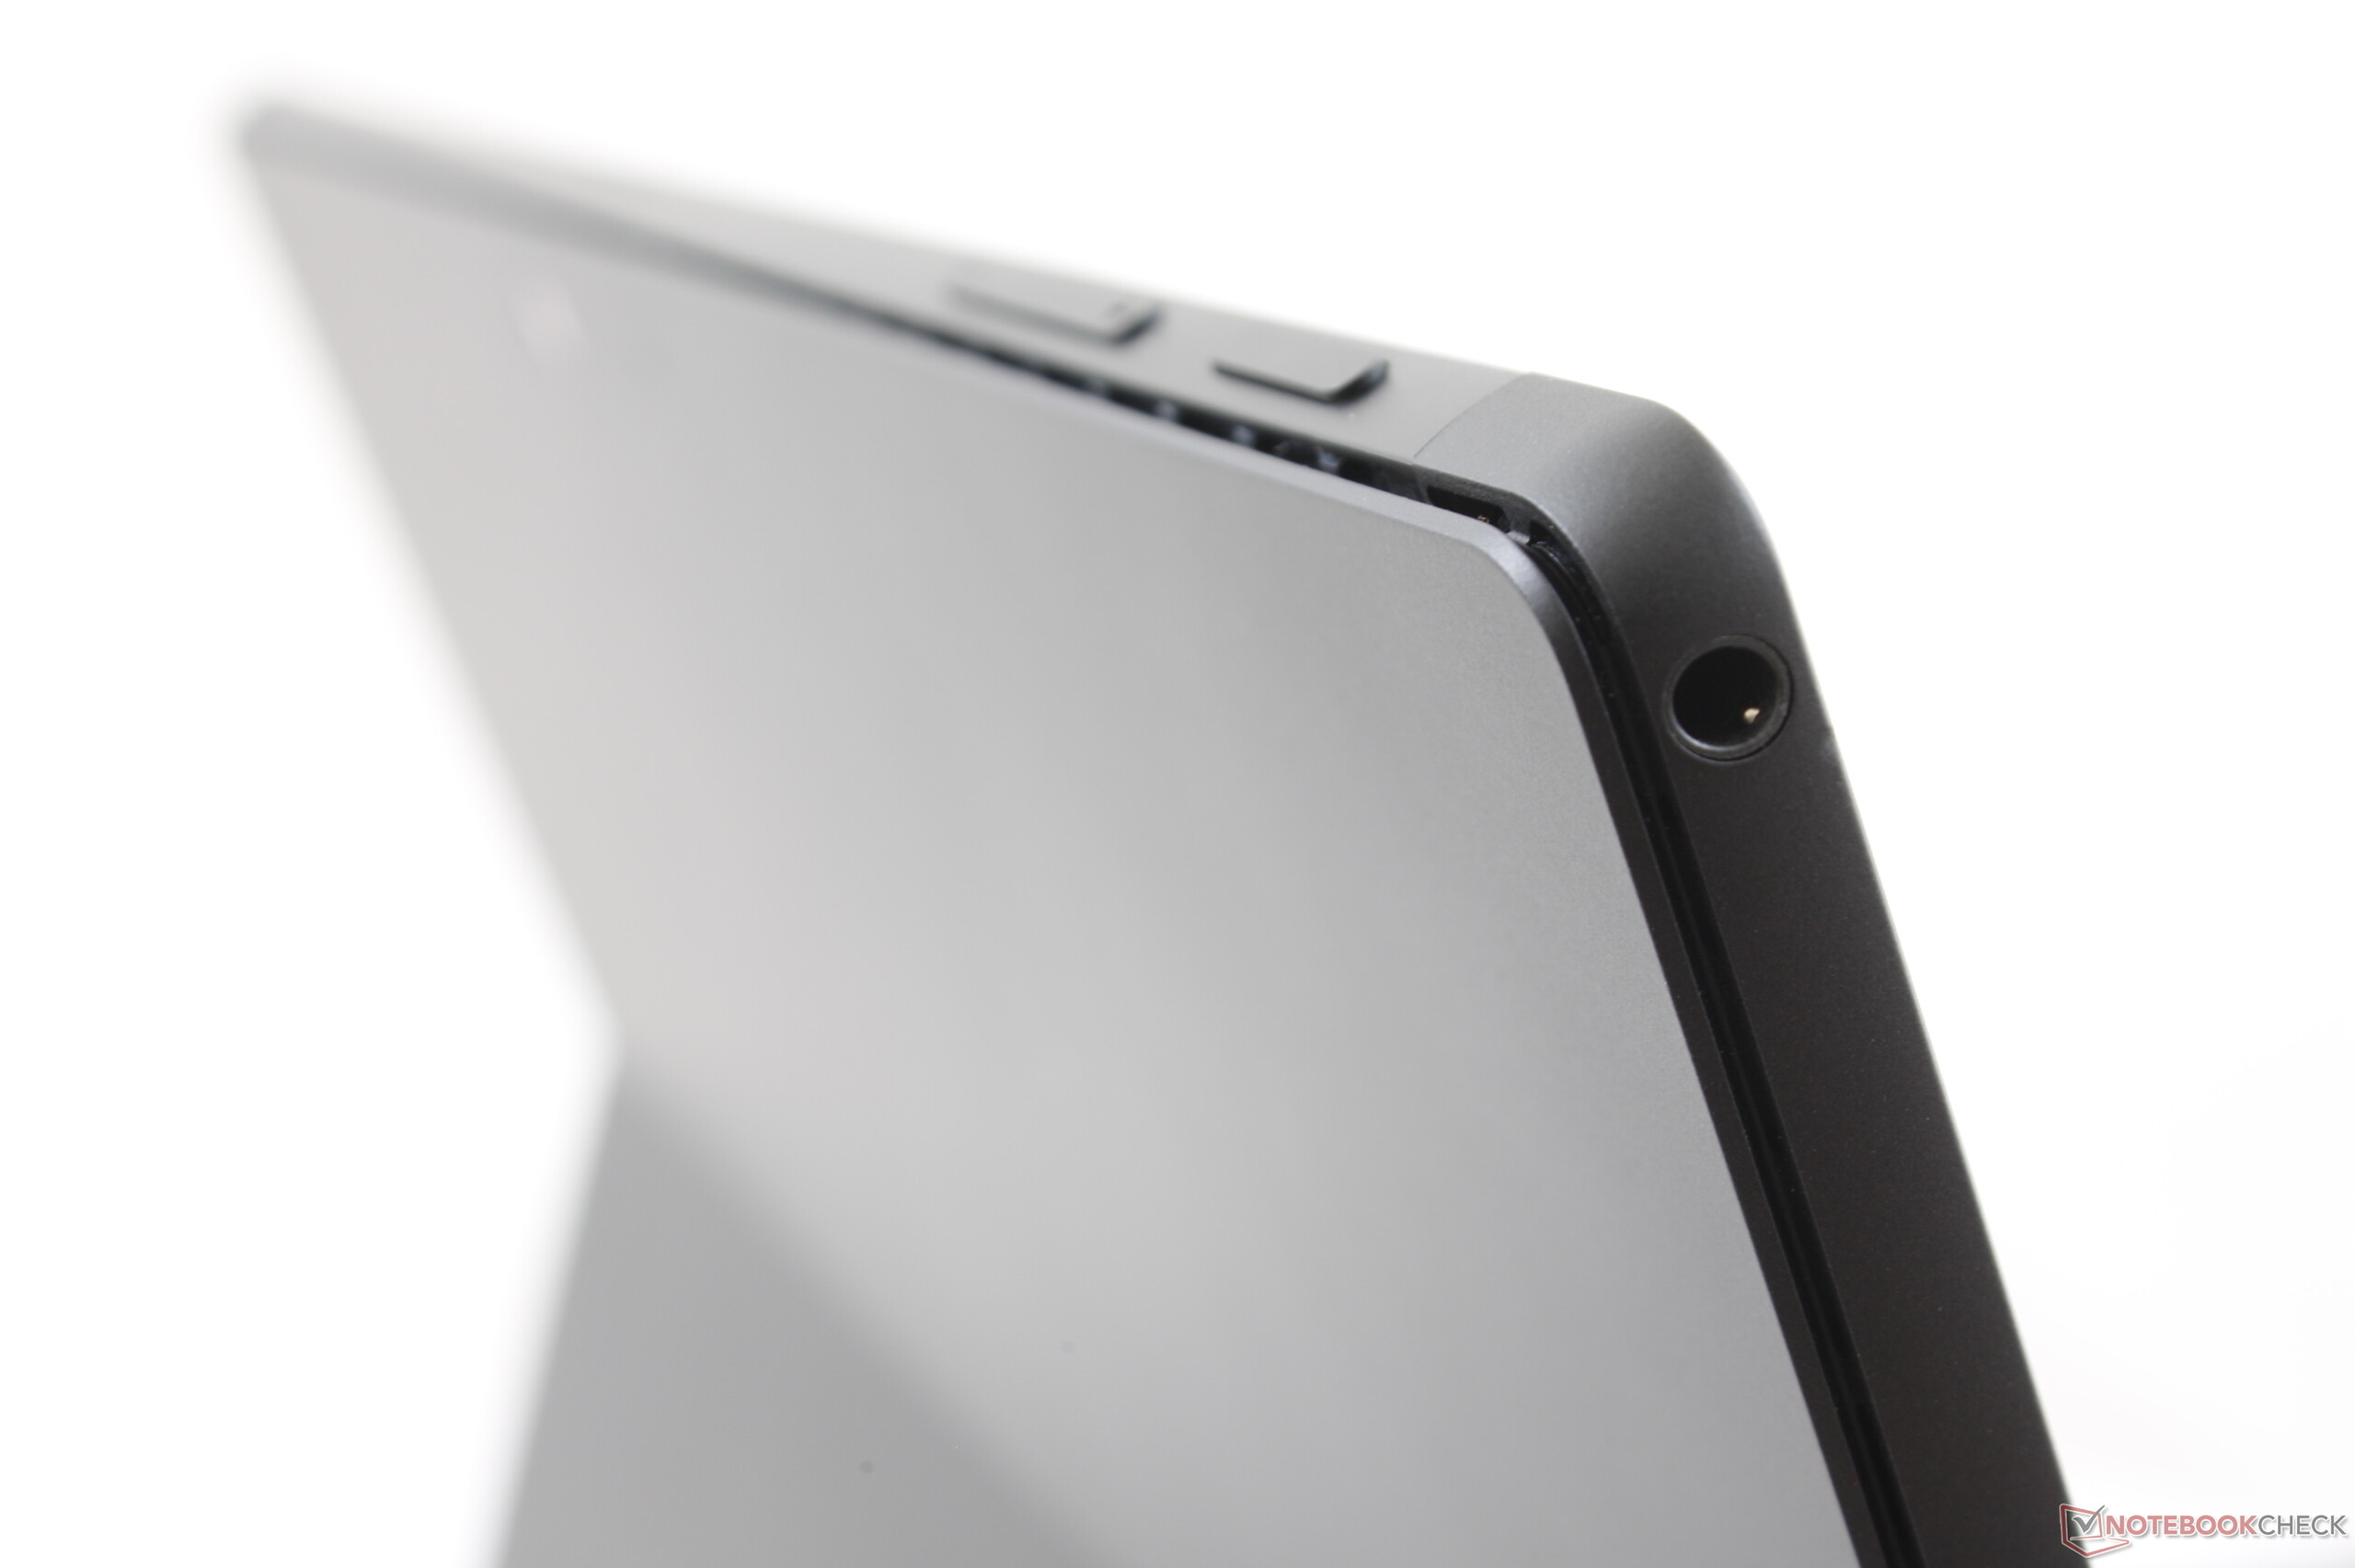
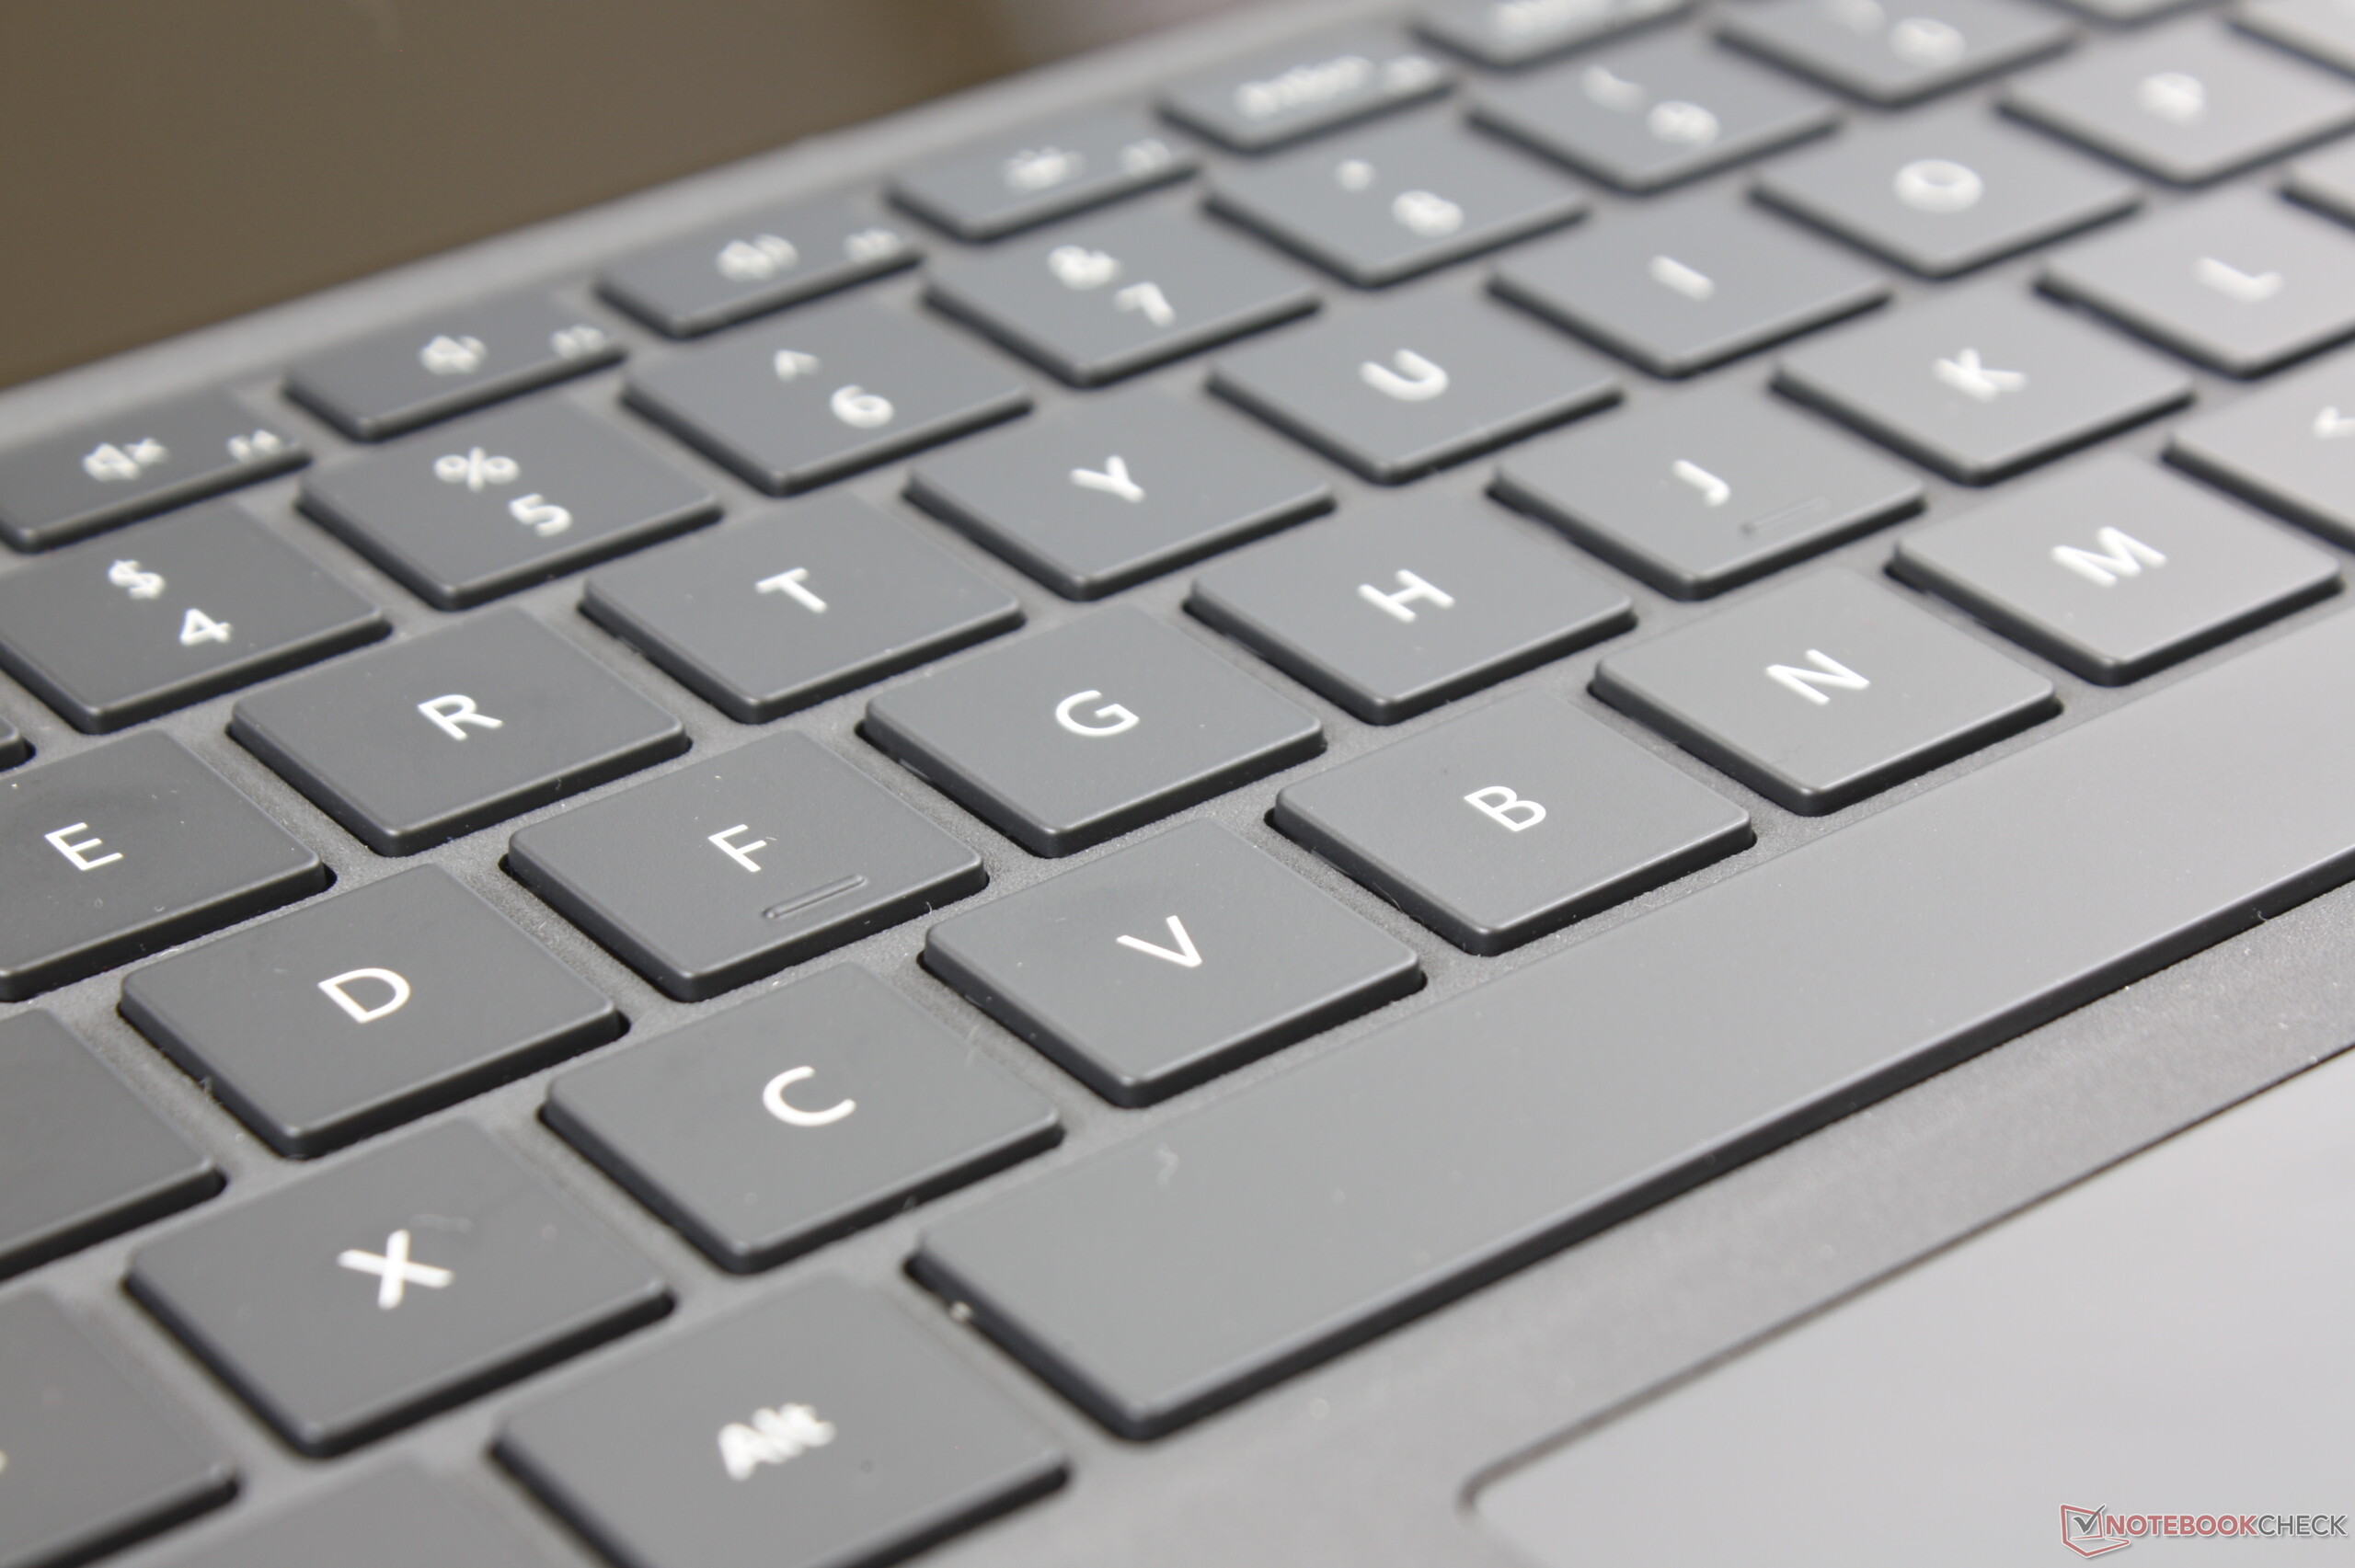
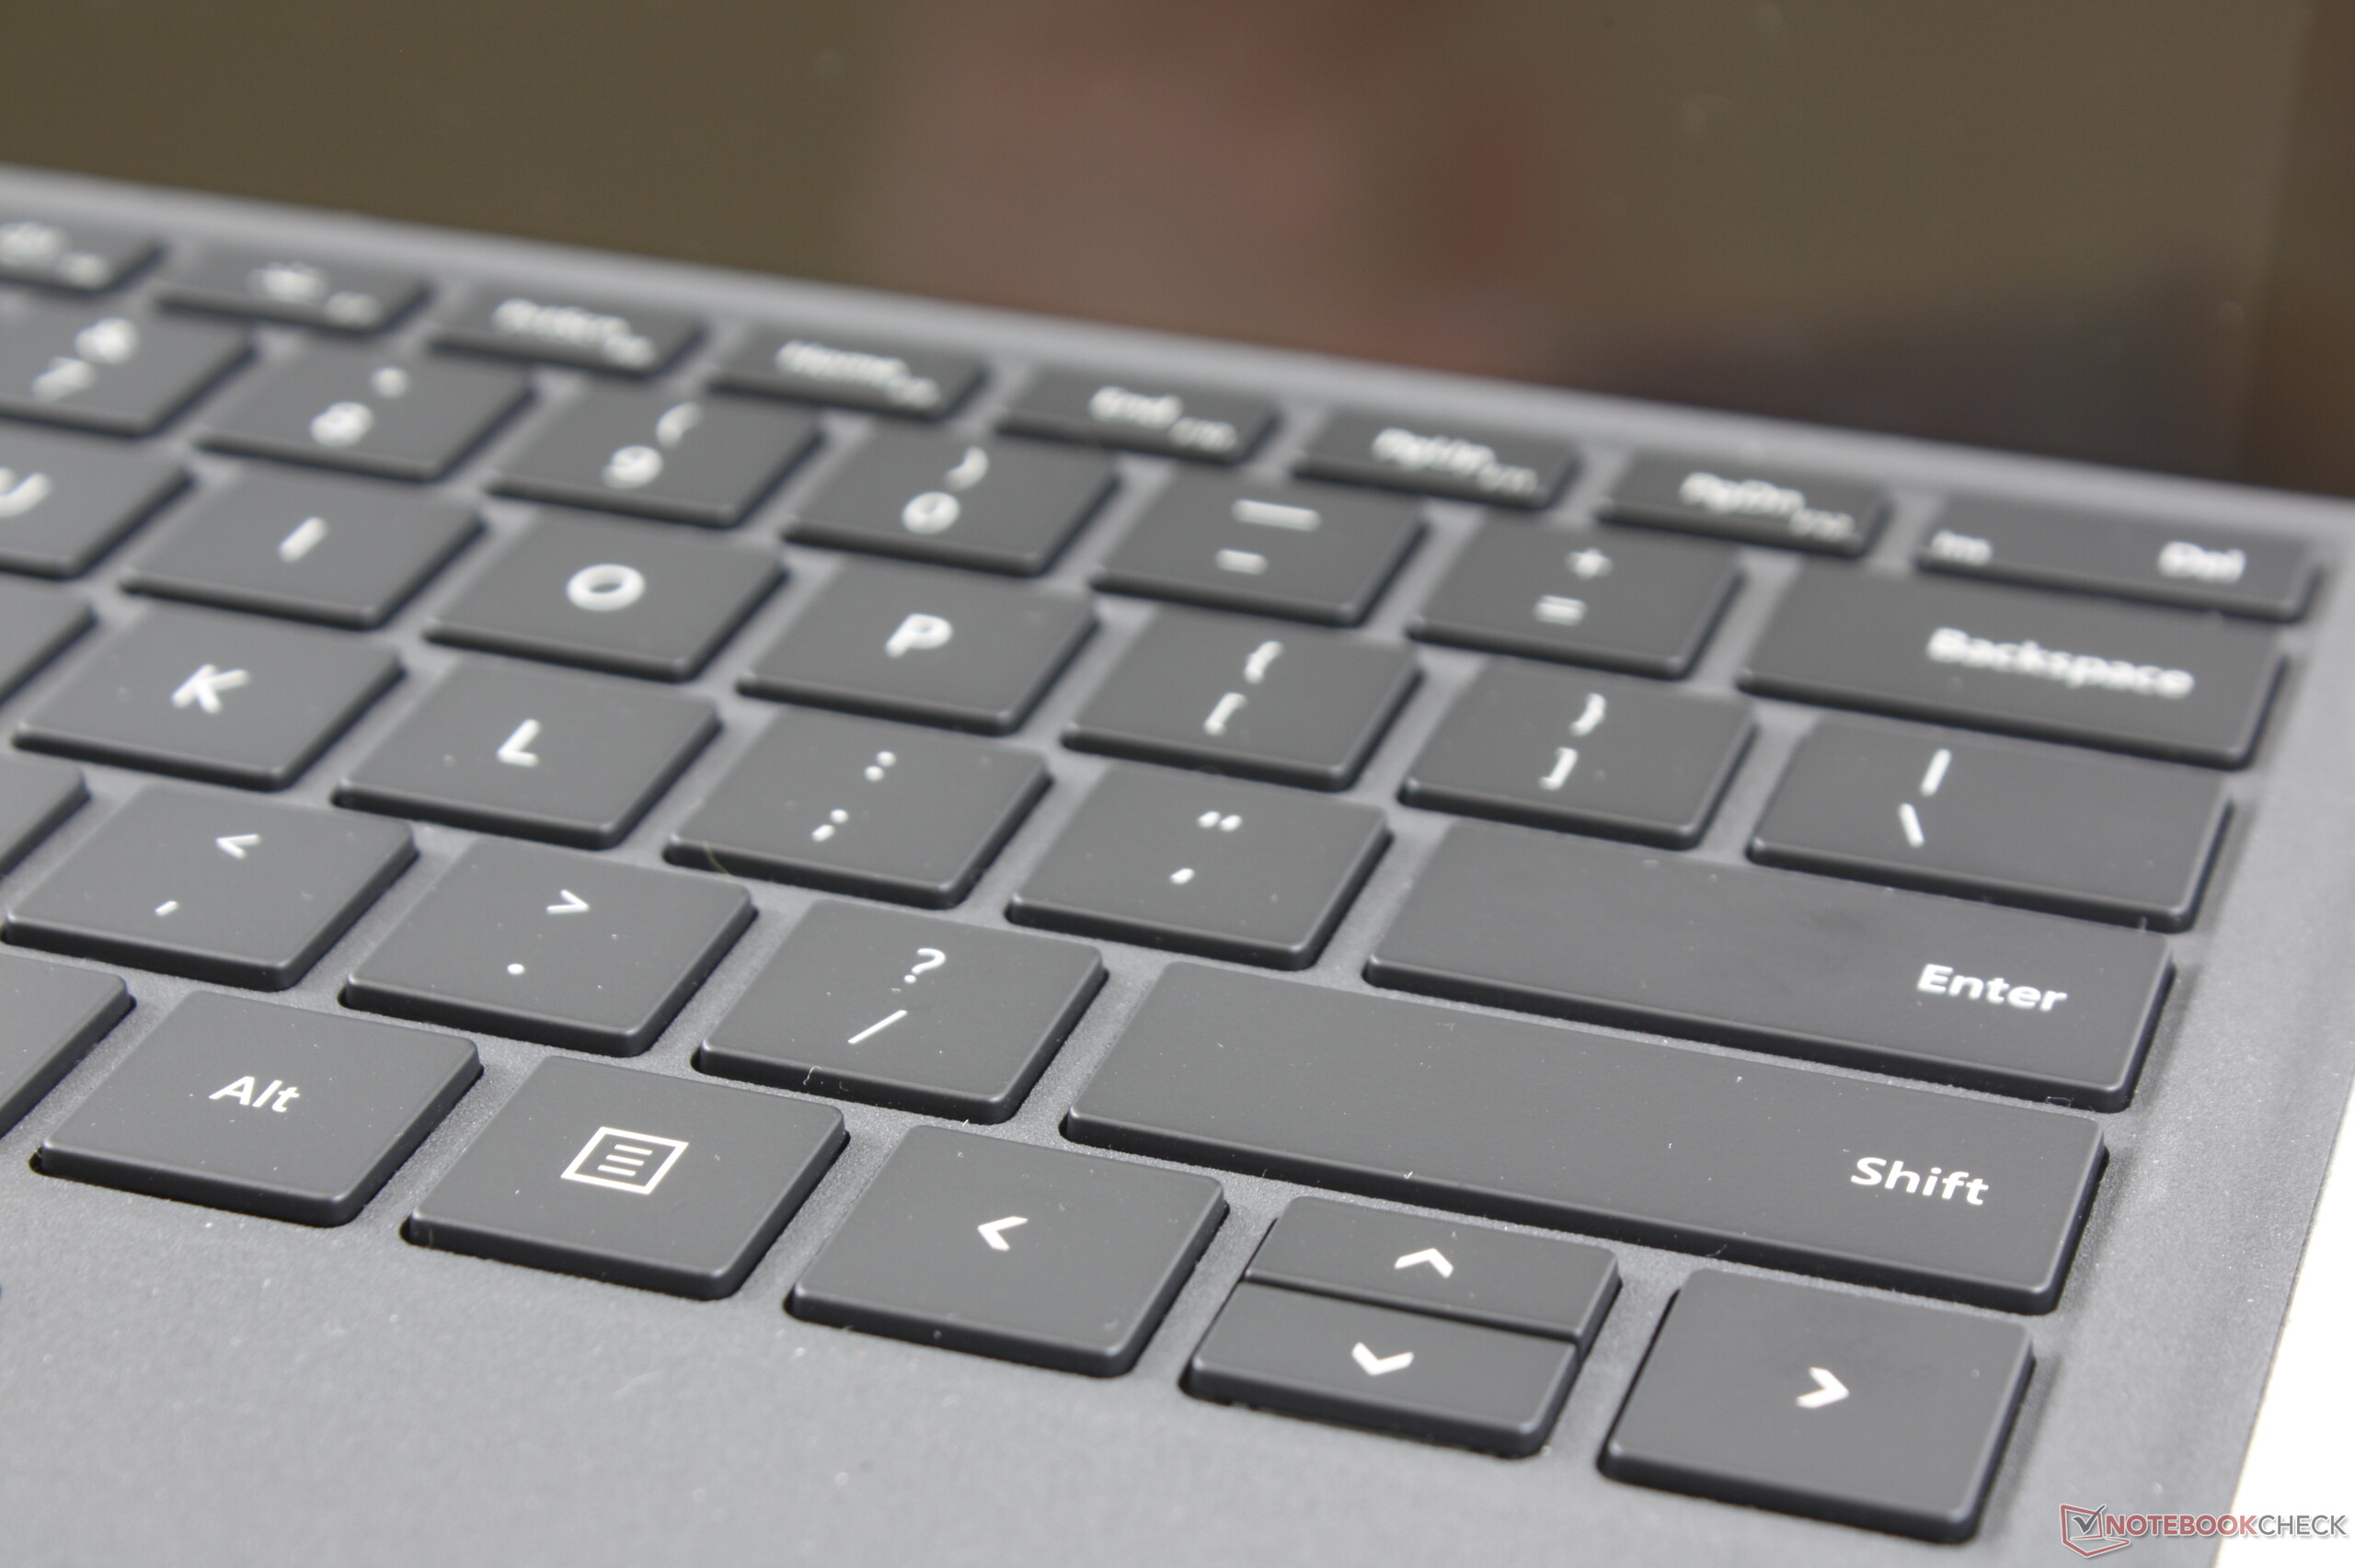
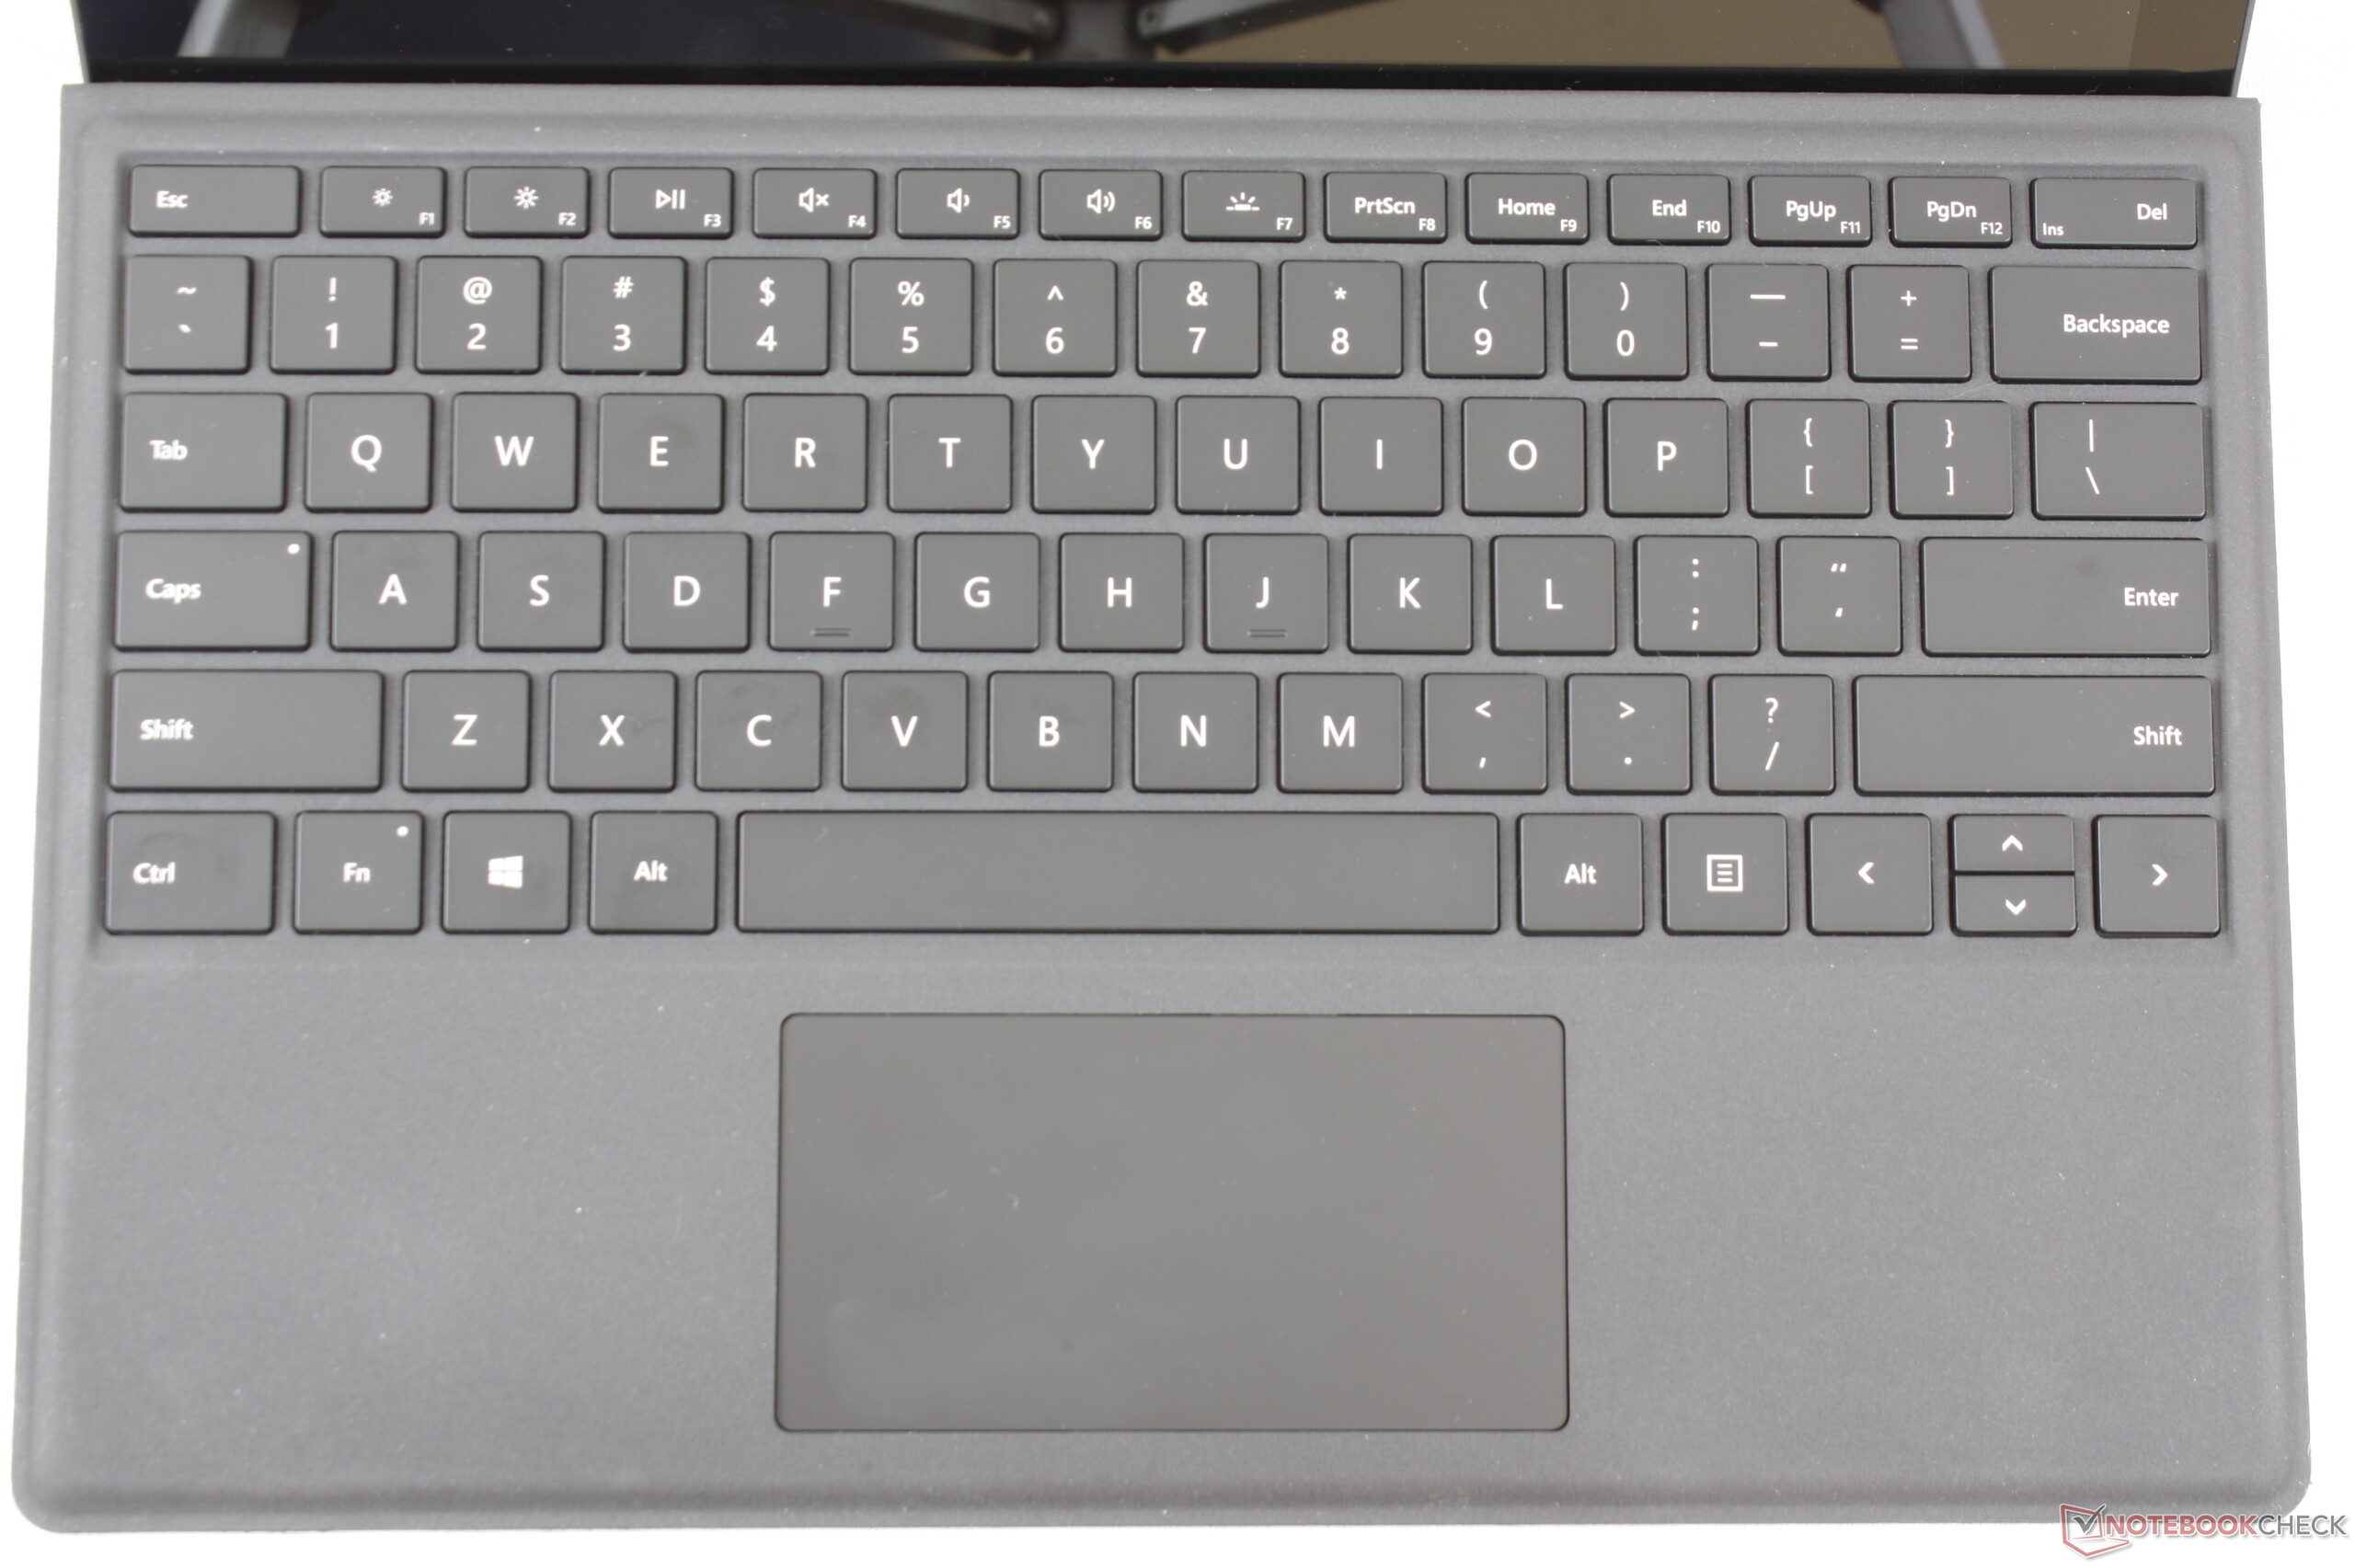
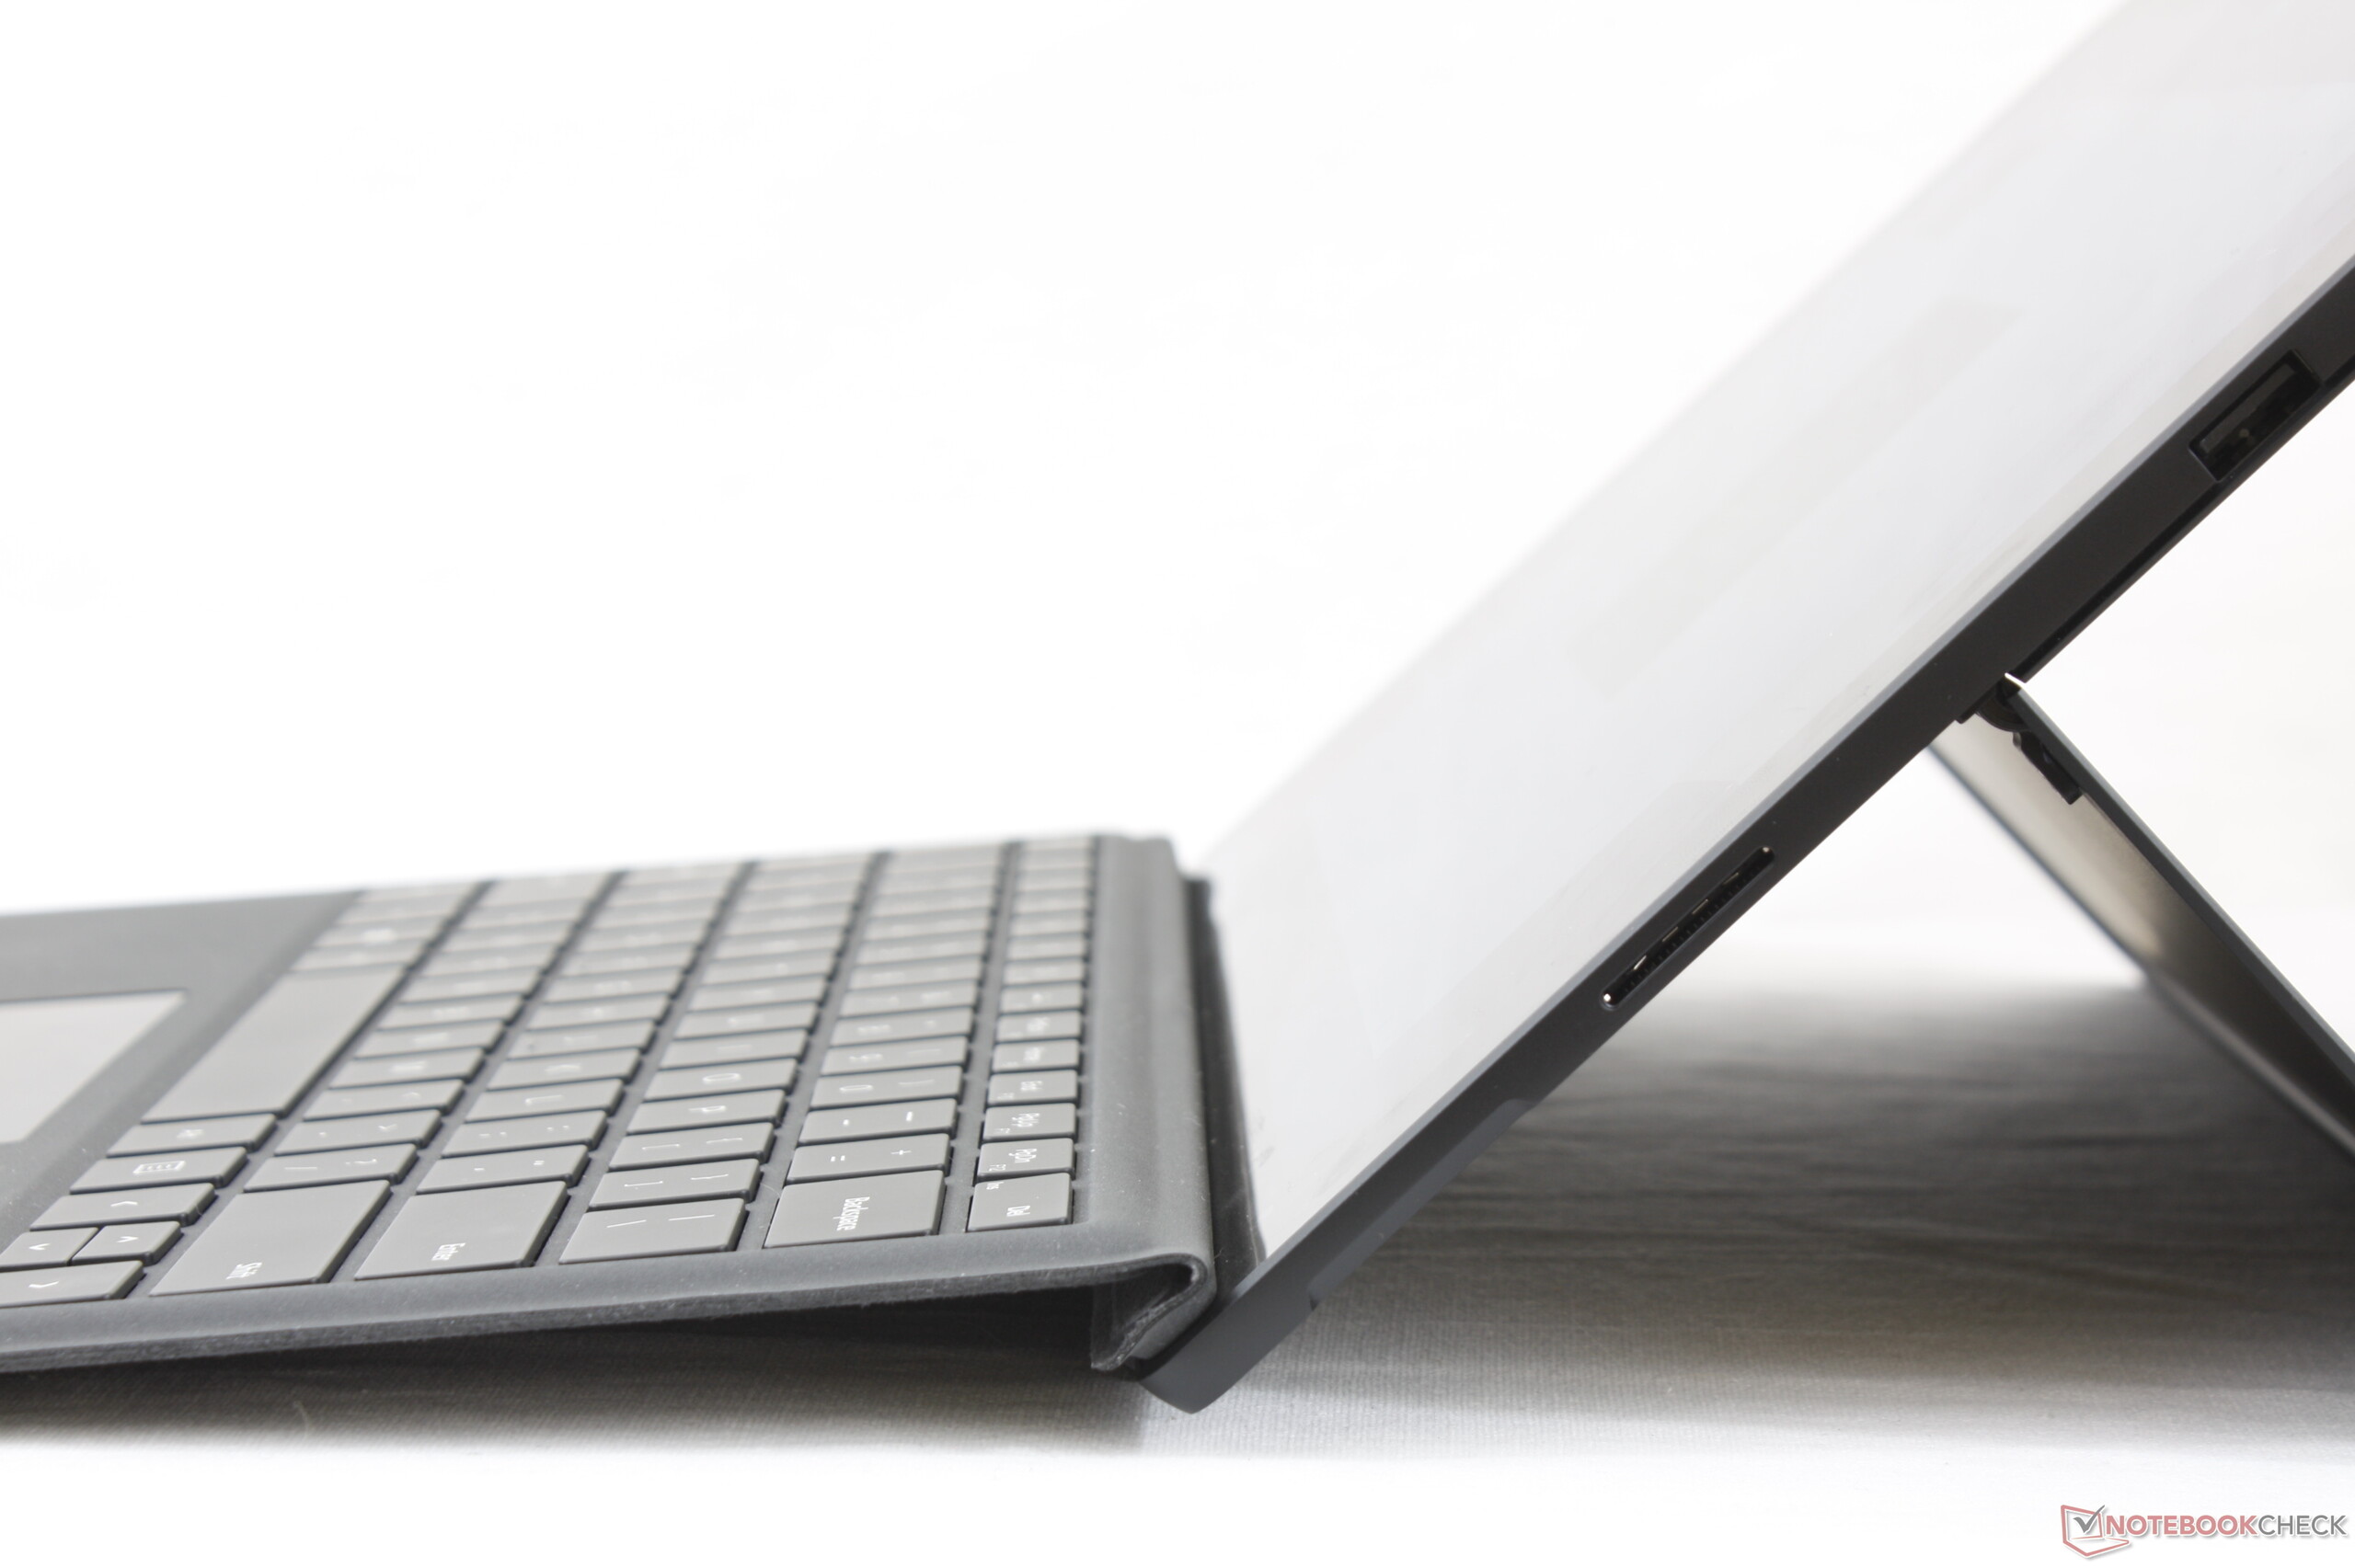
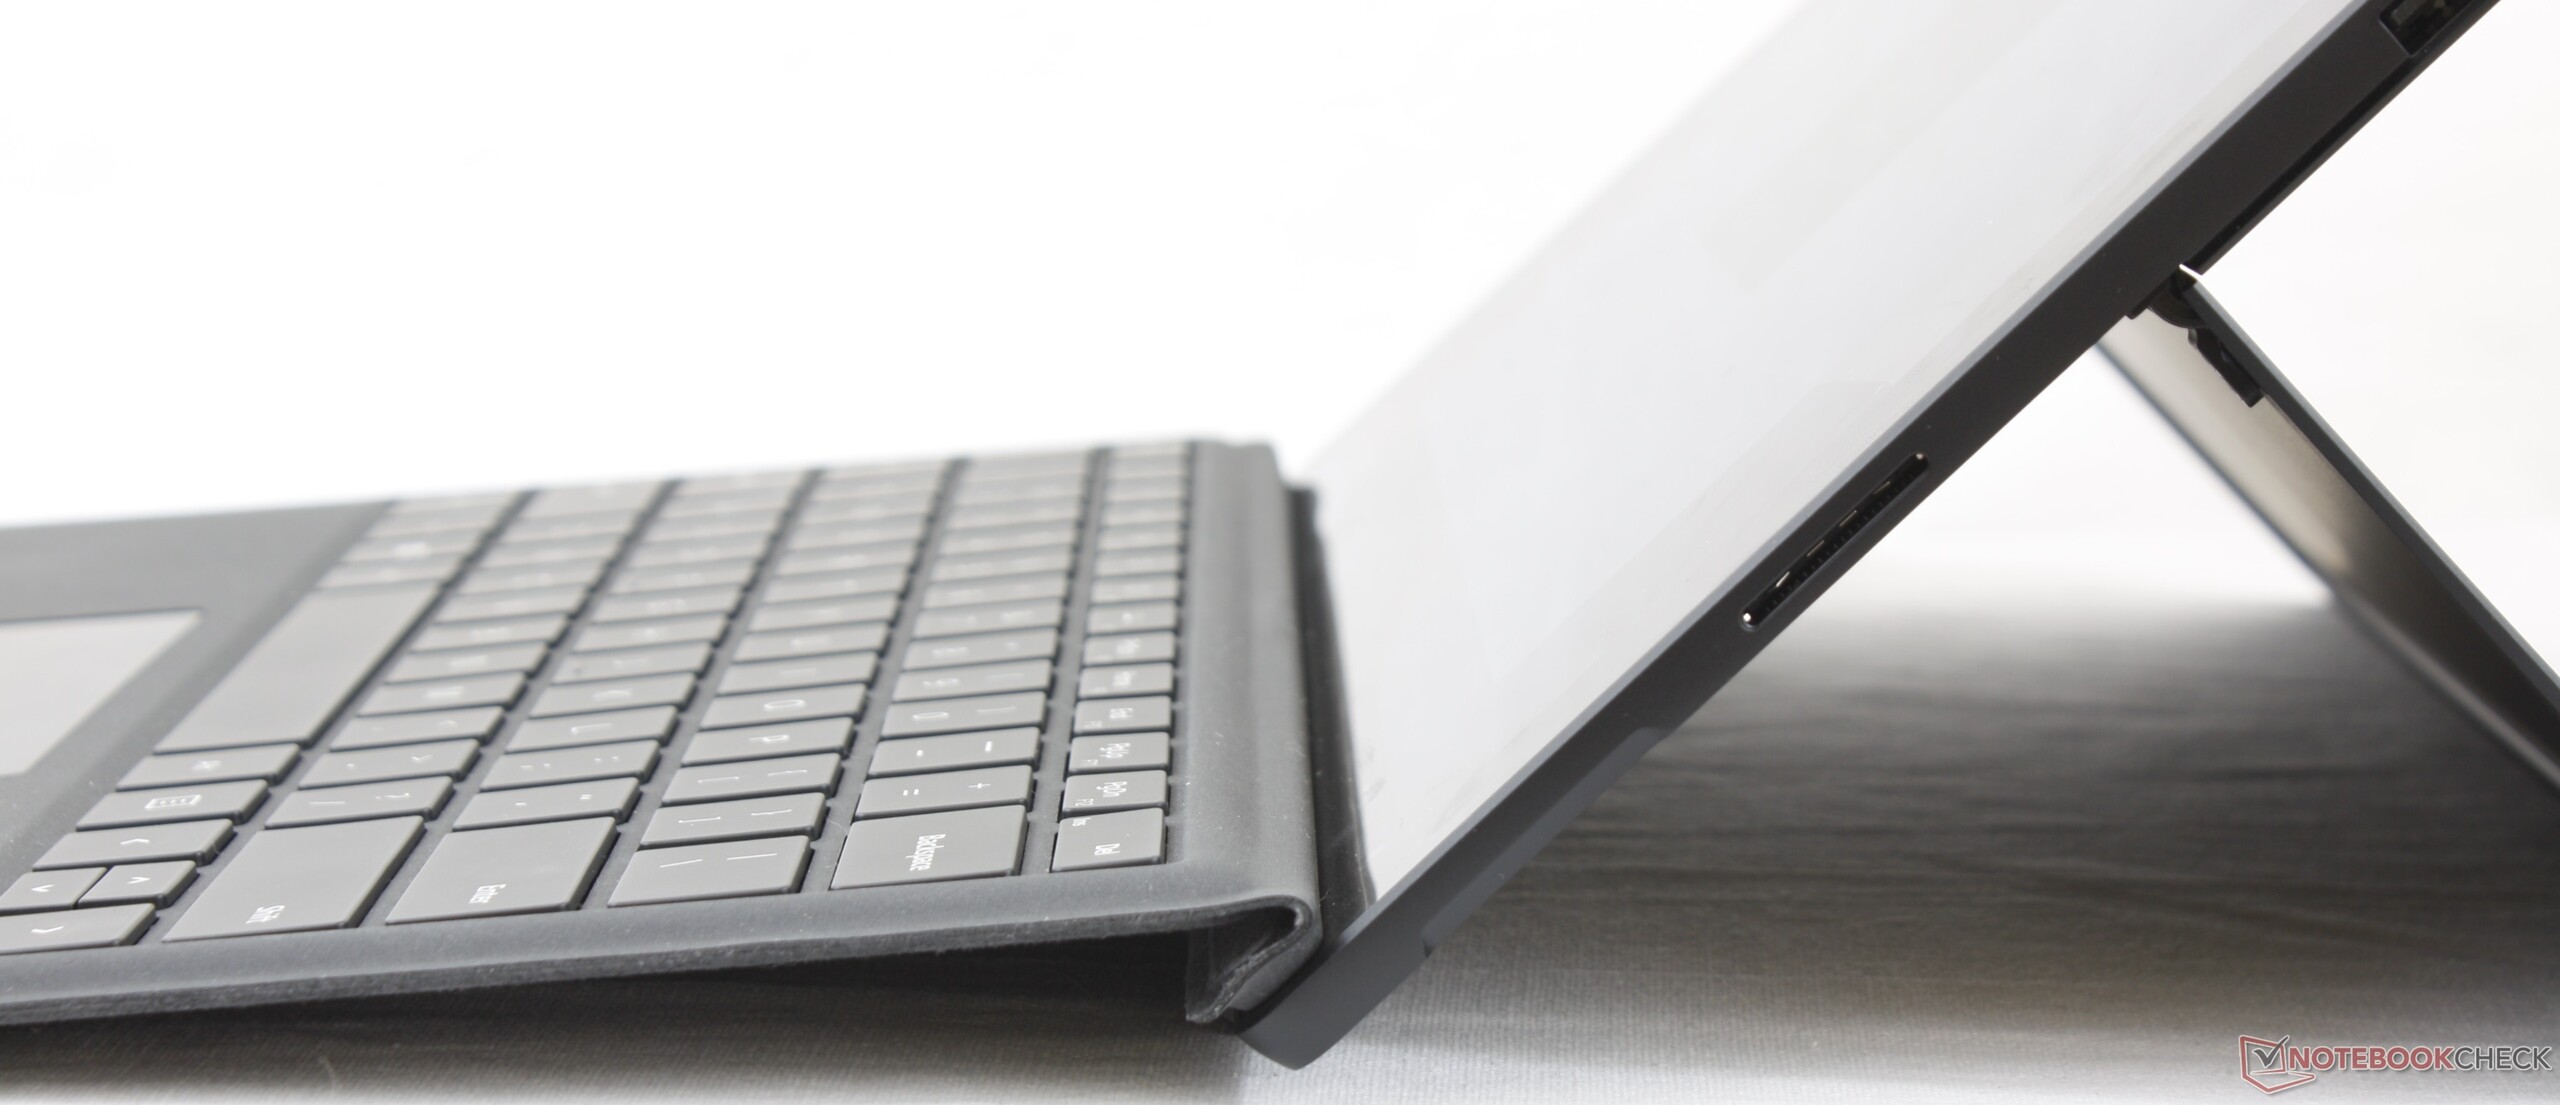
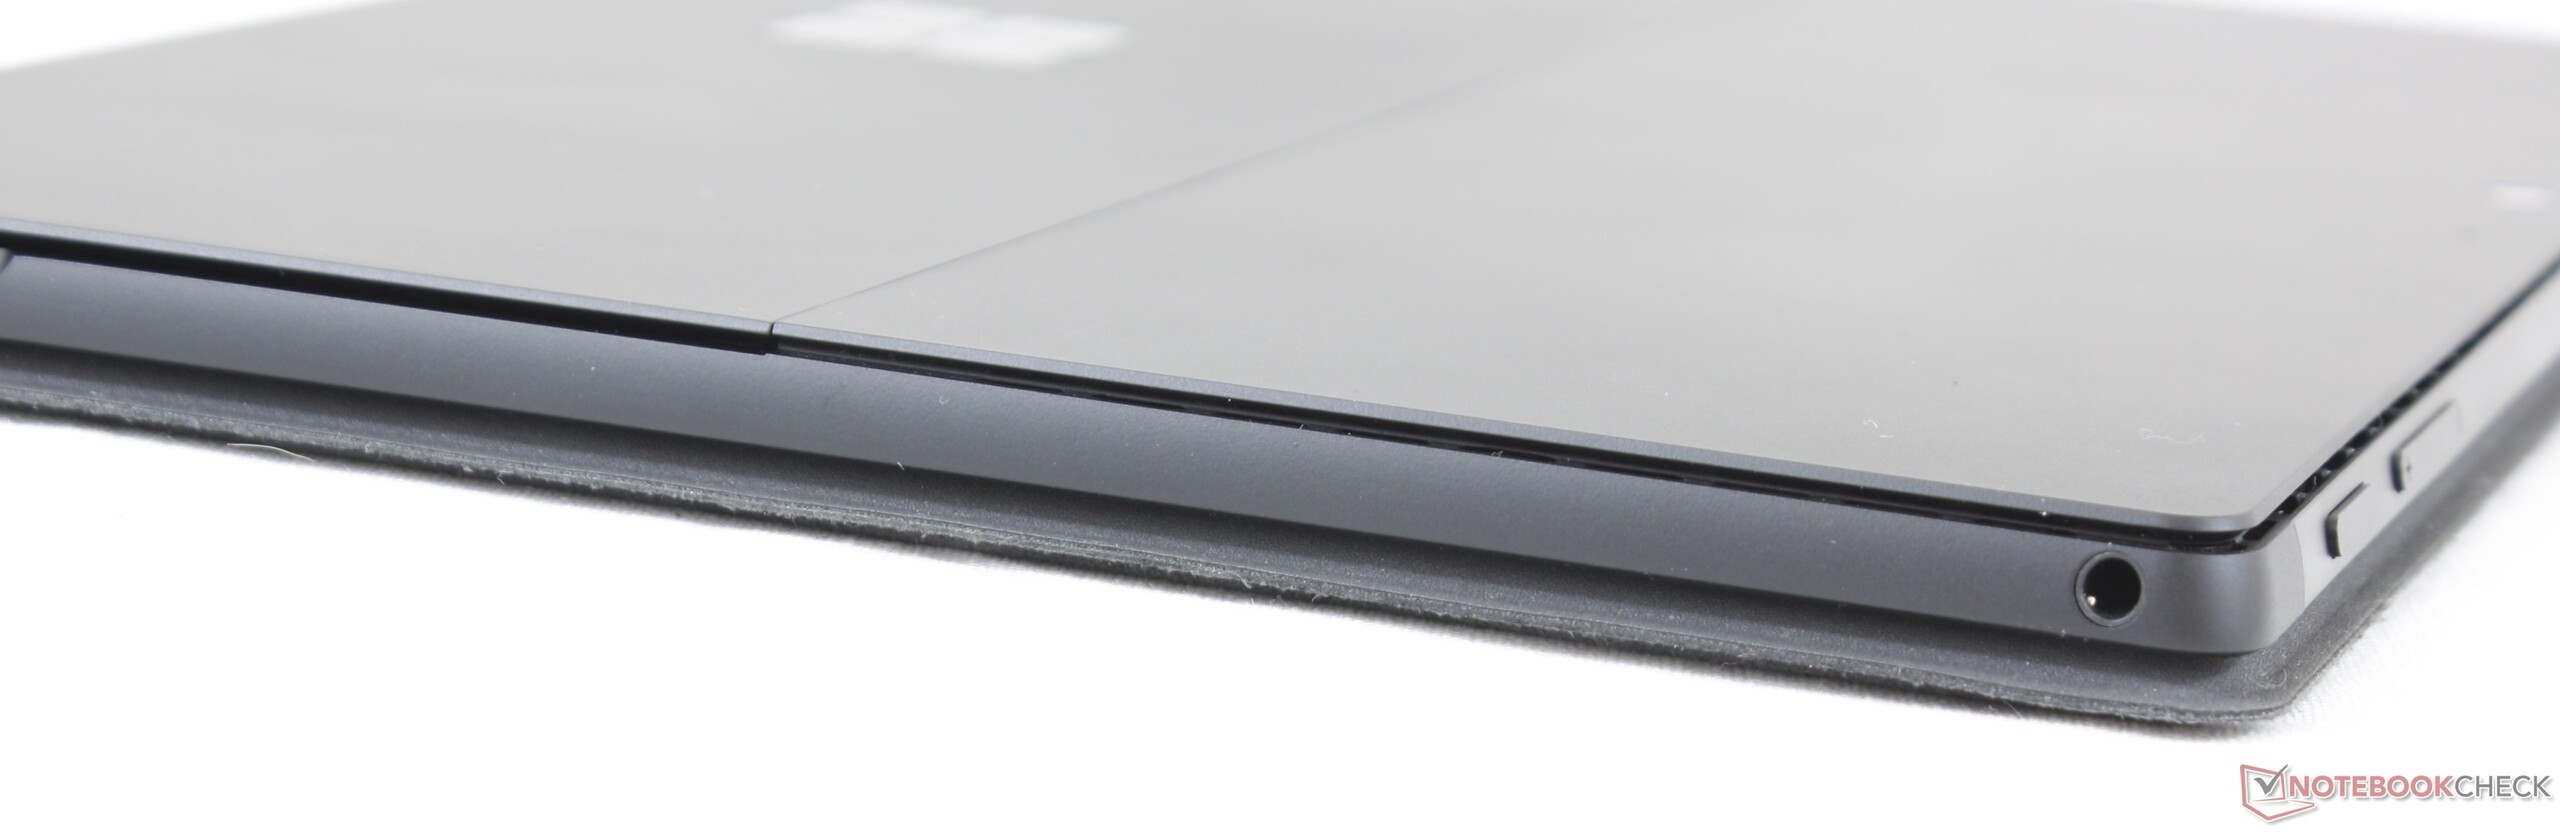
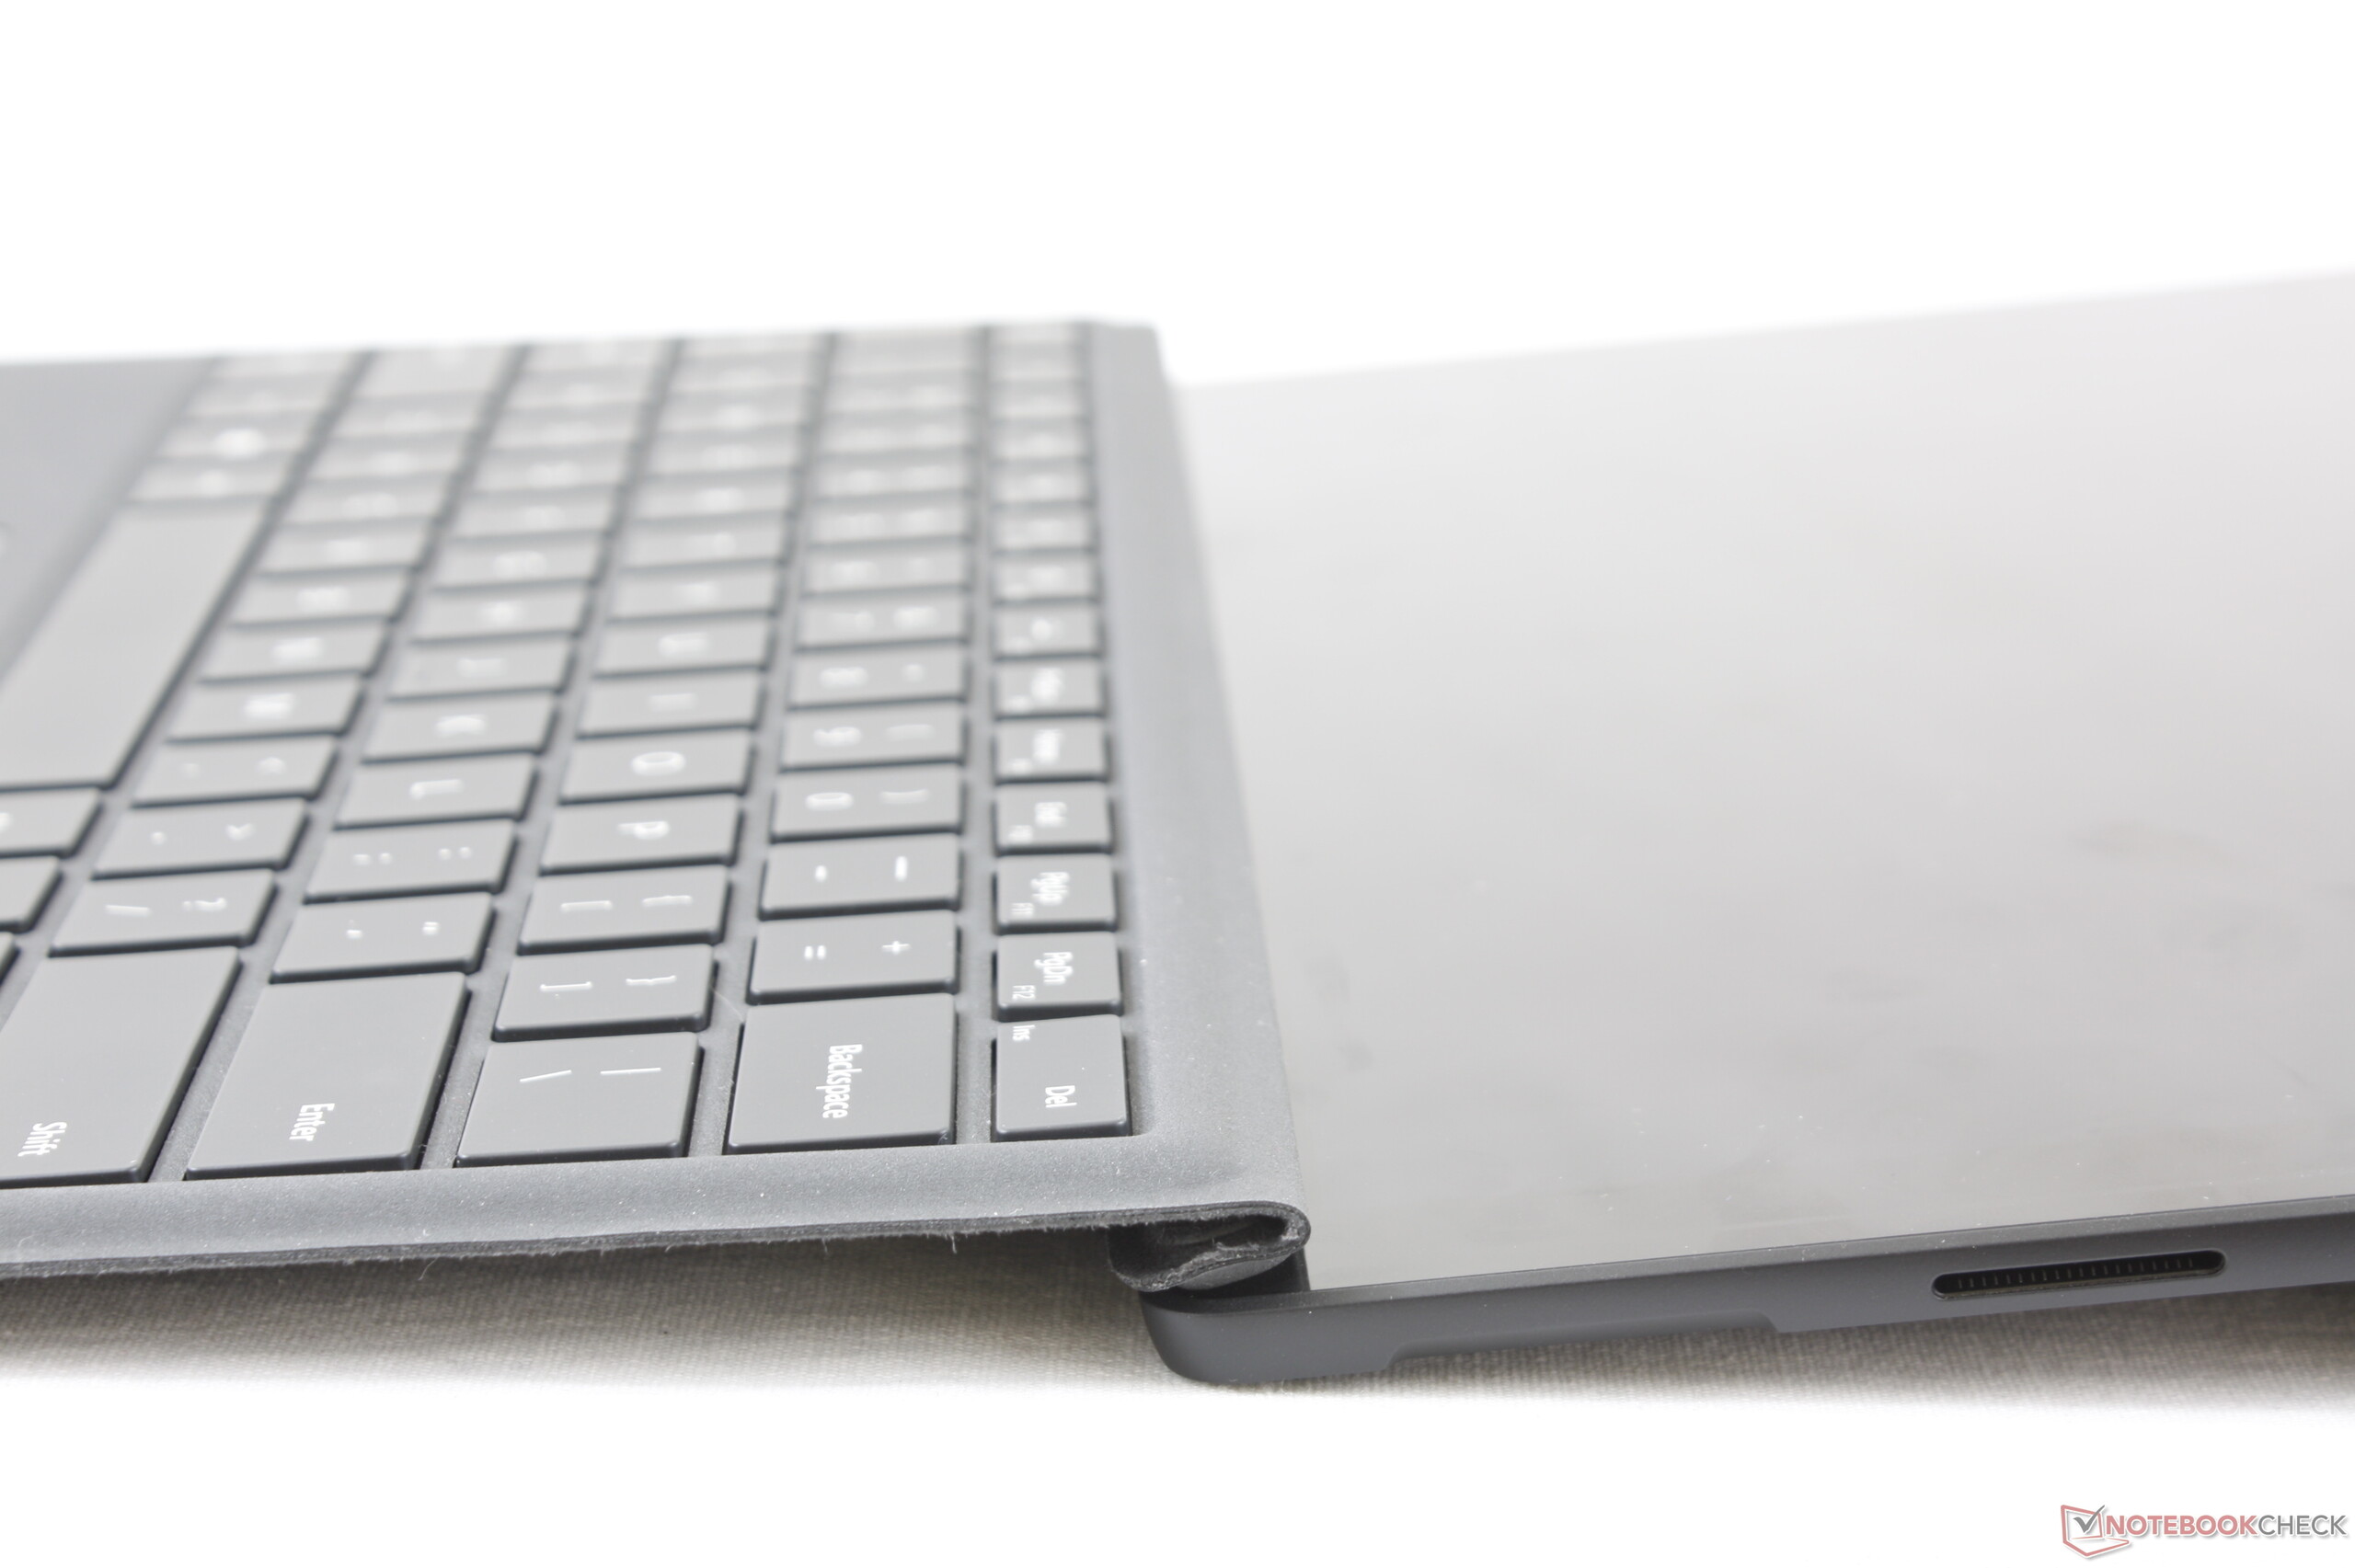
Since we have already reviewed two Surface Pro 7 models, we will not go further into the case, connectivity, input devices, and speakers in this review. The corresponding information can be found in the review of the Core i5 Surface Pro 7.
Possible contenders in comparison
Rating | Date | Model | Weight | Height | Size | Resolution | Best Price |
|---|---|---|---|---|---|---|---|
| 88.5 % | 03/2021 | Microsoft Surface Pro 7 Plus i5-1135G7, Iris Xe G7 80EUs | 796 g | 8.5 mm | 12.30" | 2736x1824 | |
| 87.1 % | 11/2020 | Lenovo Yoga Duet 7 13IML05-82AS000WGE i5-10210U, UHD Graphics 620 | 1.2 kg | 9.2 mm | 13.00" | 2160x1350 | |
| 89.5 % | 03/2021 | Dell Latitude 12 7210 2-in-1 i7-10610U, UHD Graphics 620 | 850 g | 9.35 mm | 12.30" | 1920x1280 |
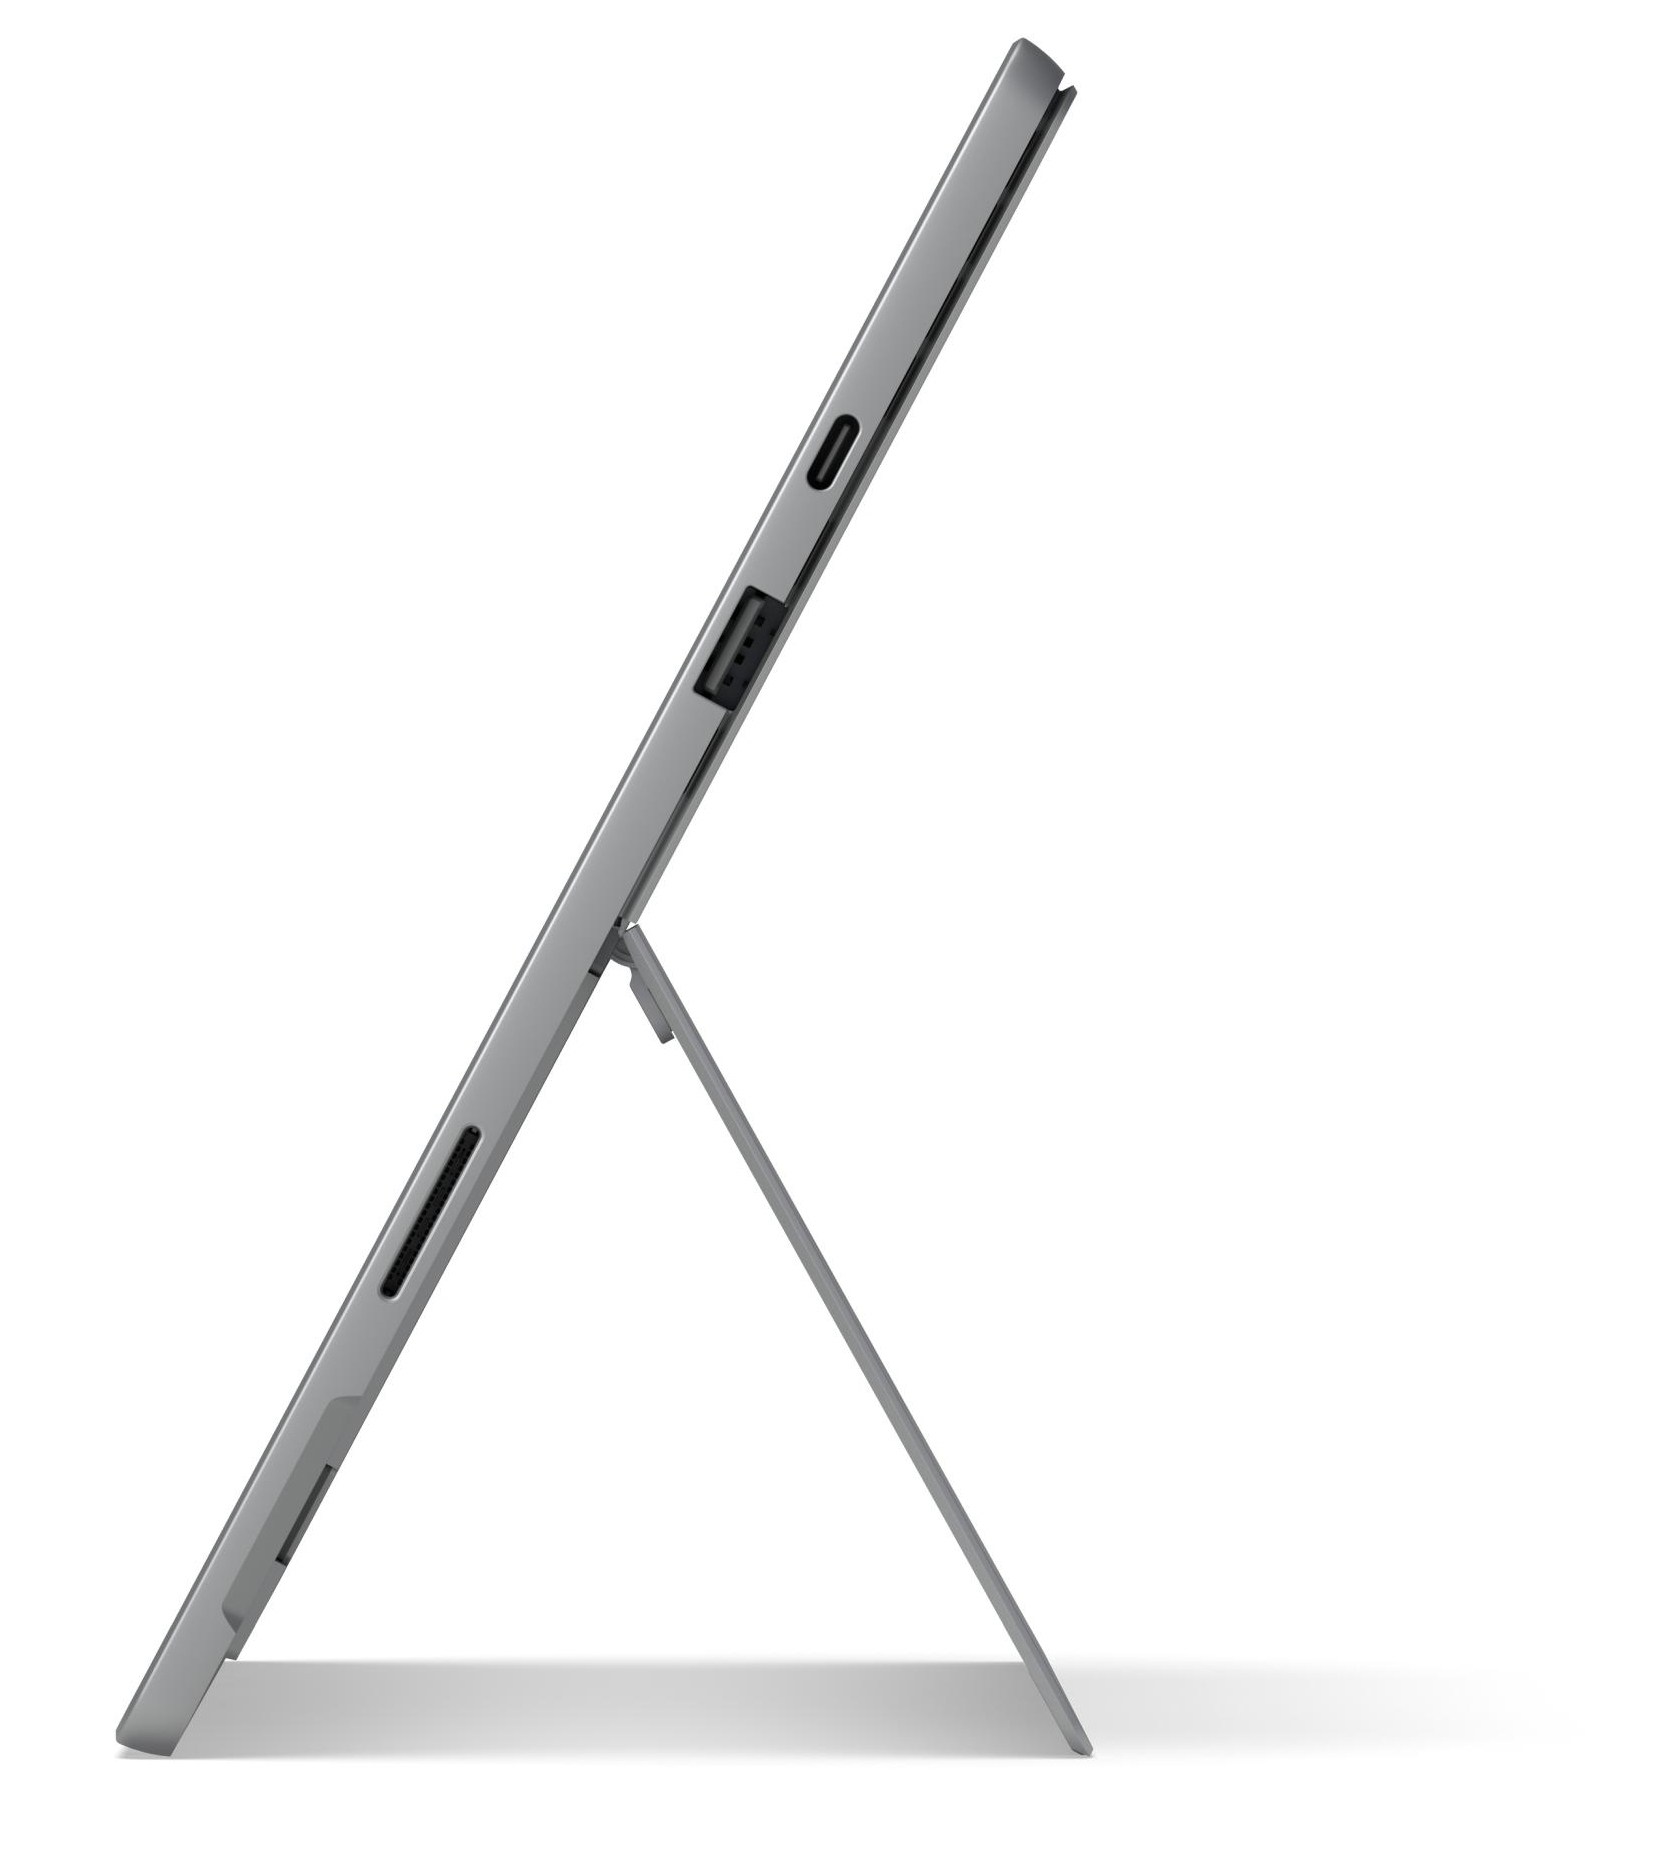
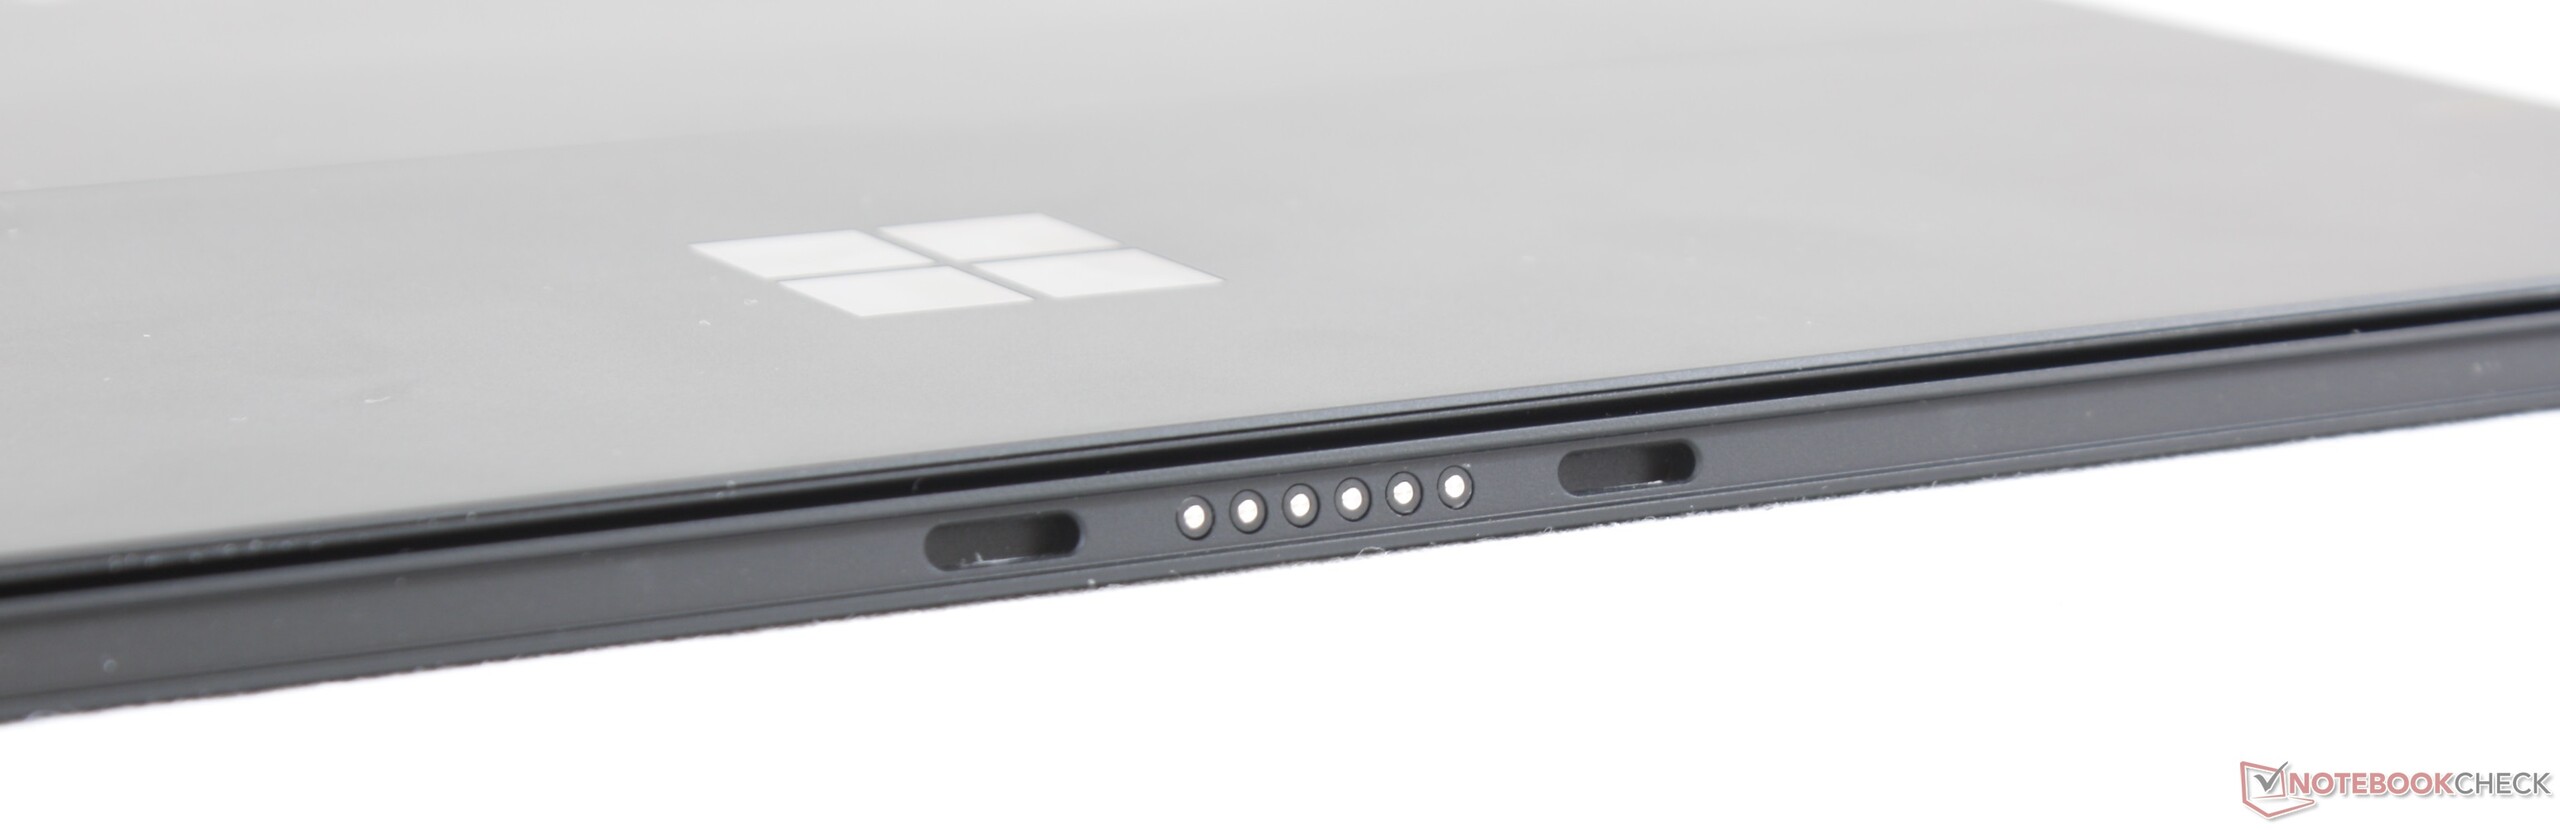
Connectivity - An LTE modem is optional now
Snapdragon X20
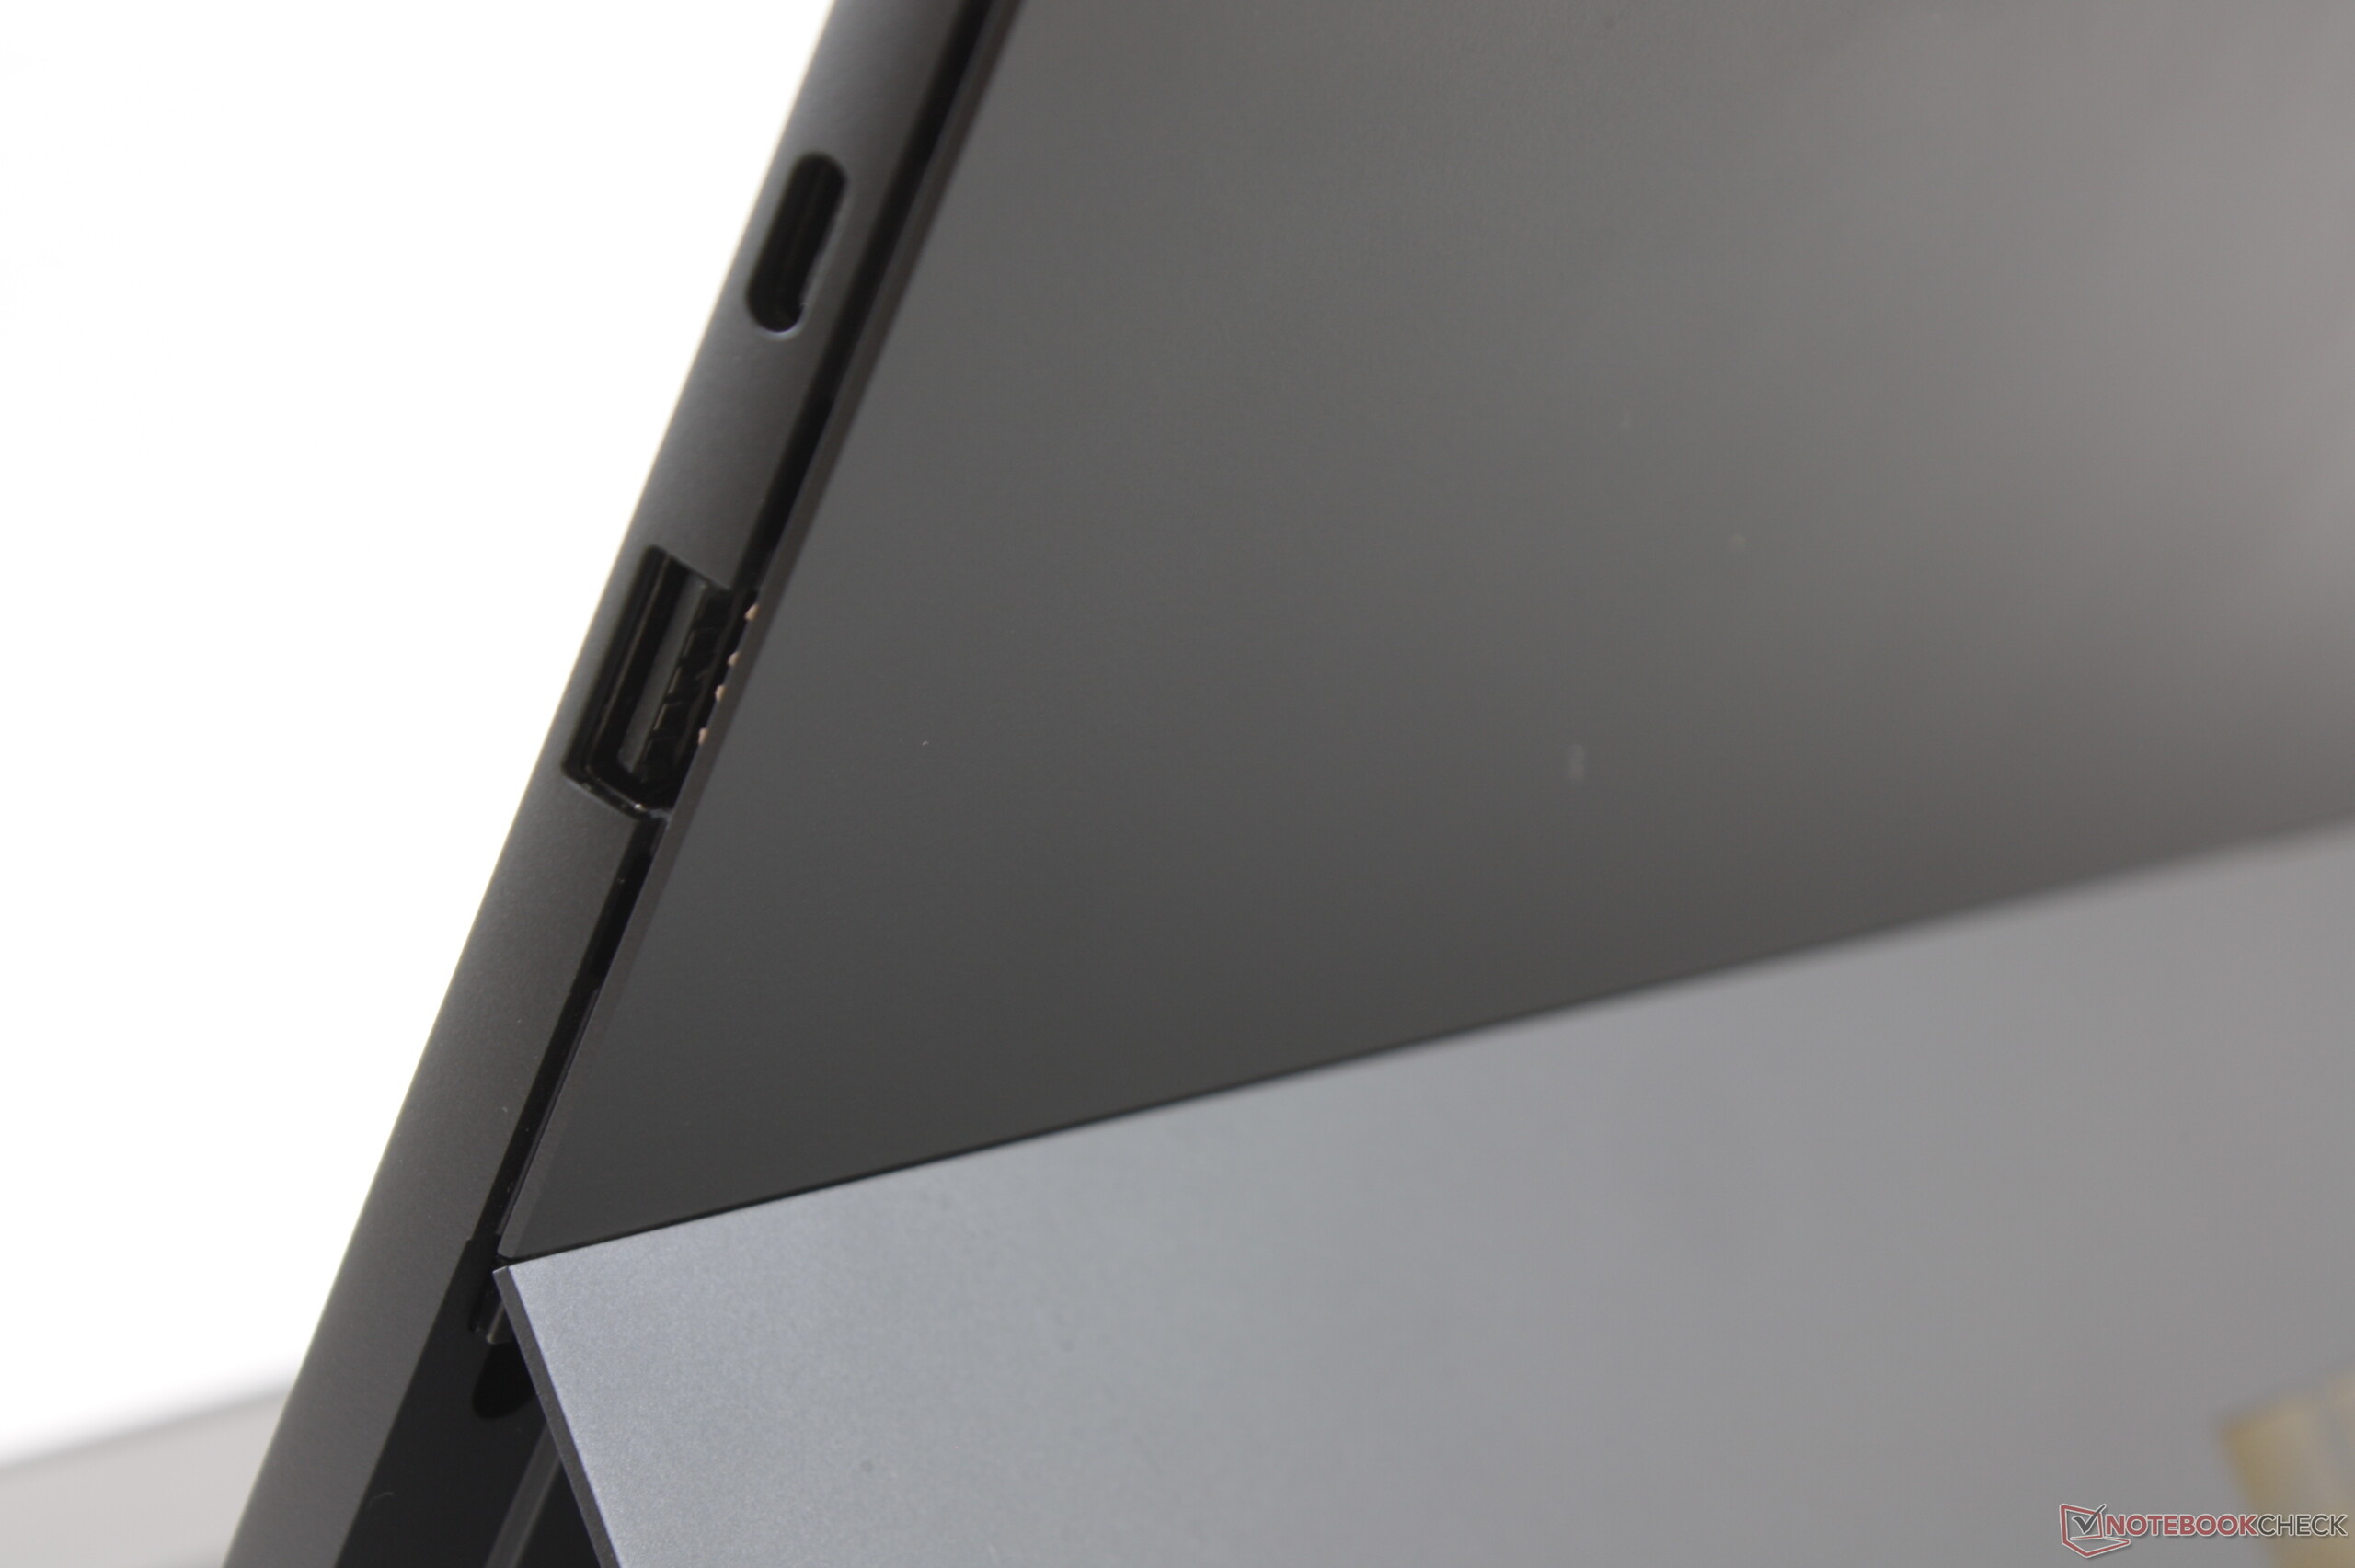
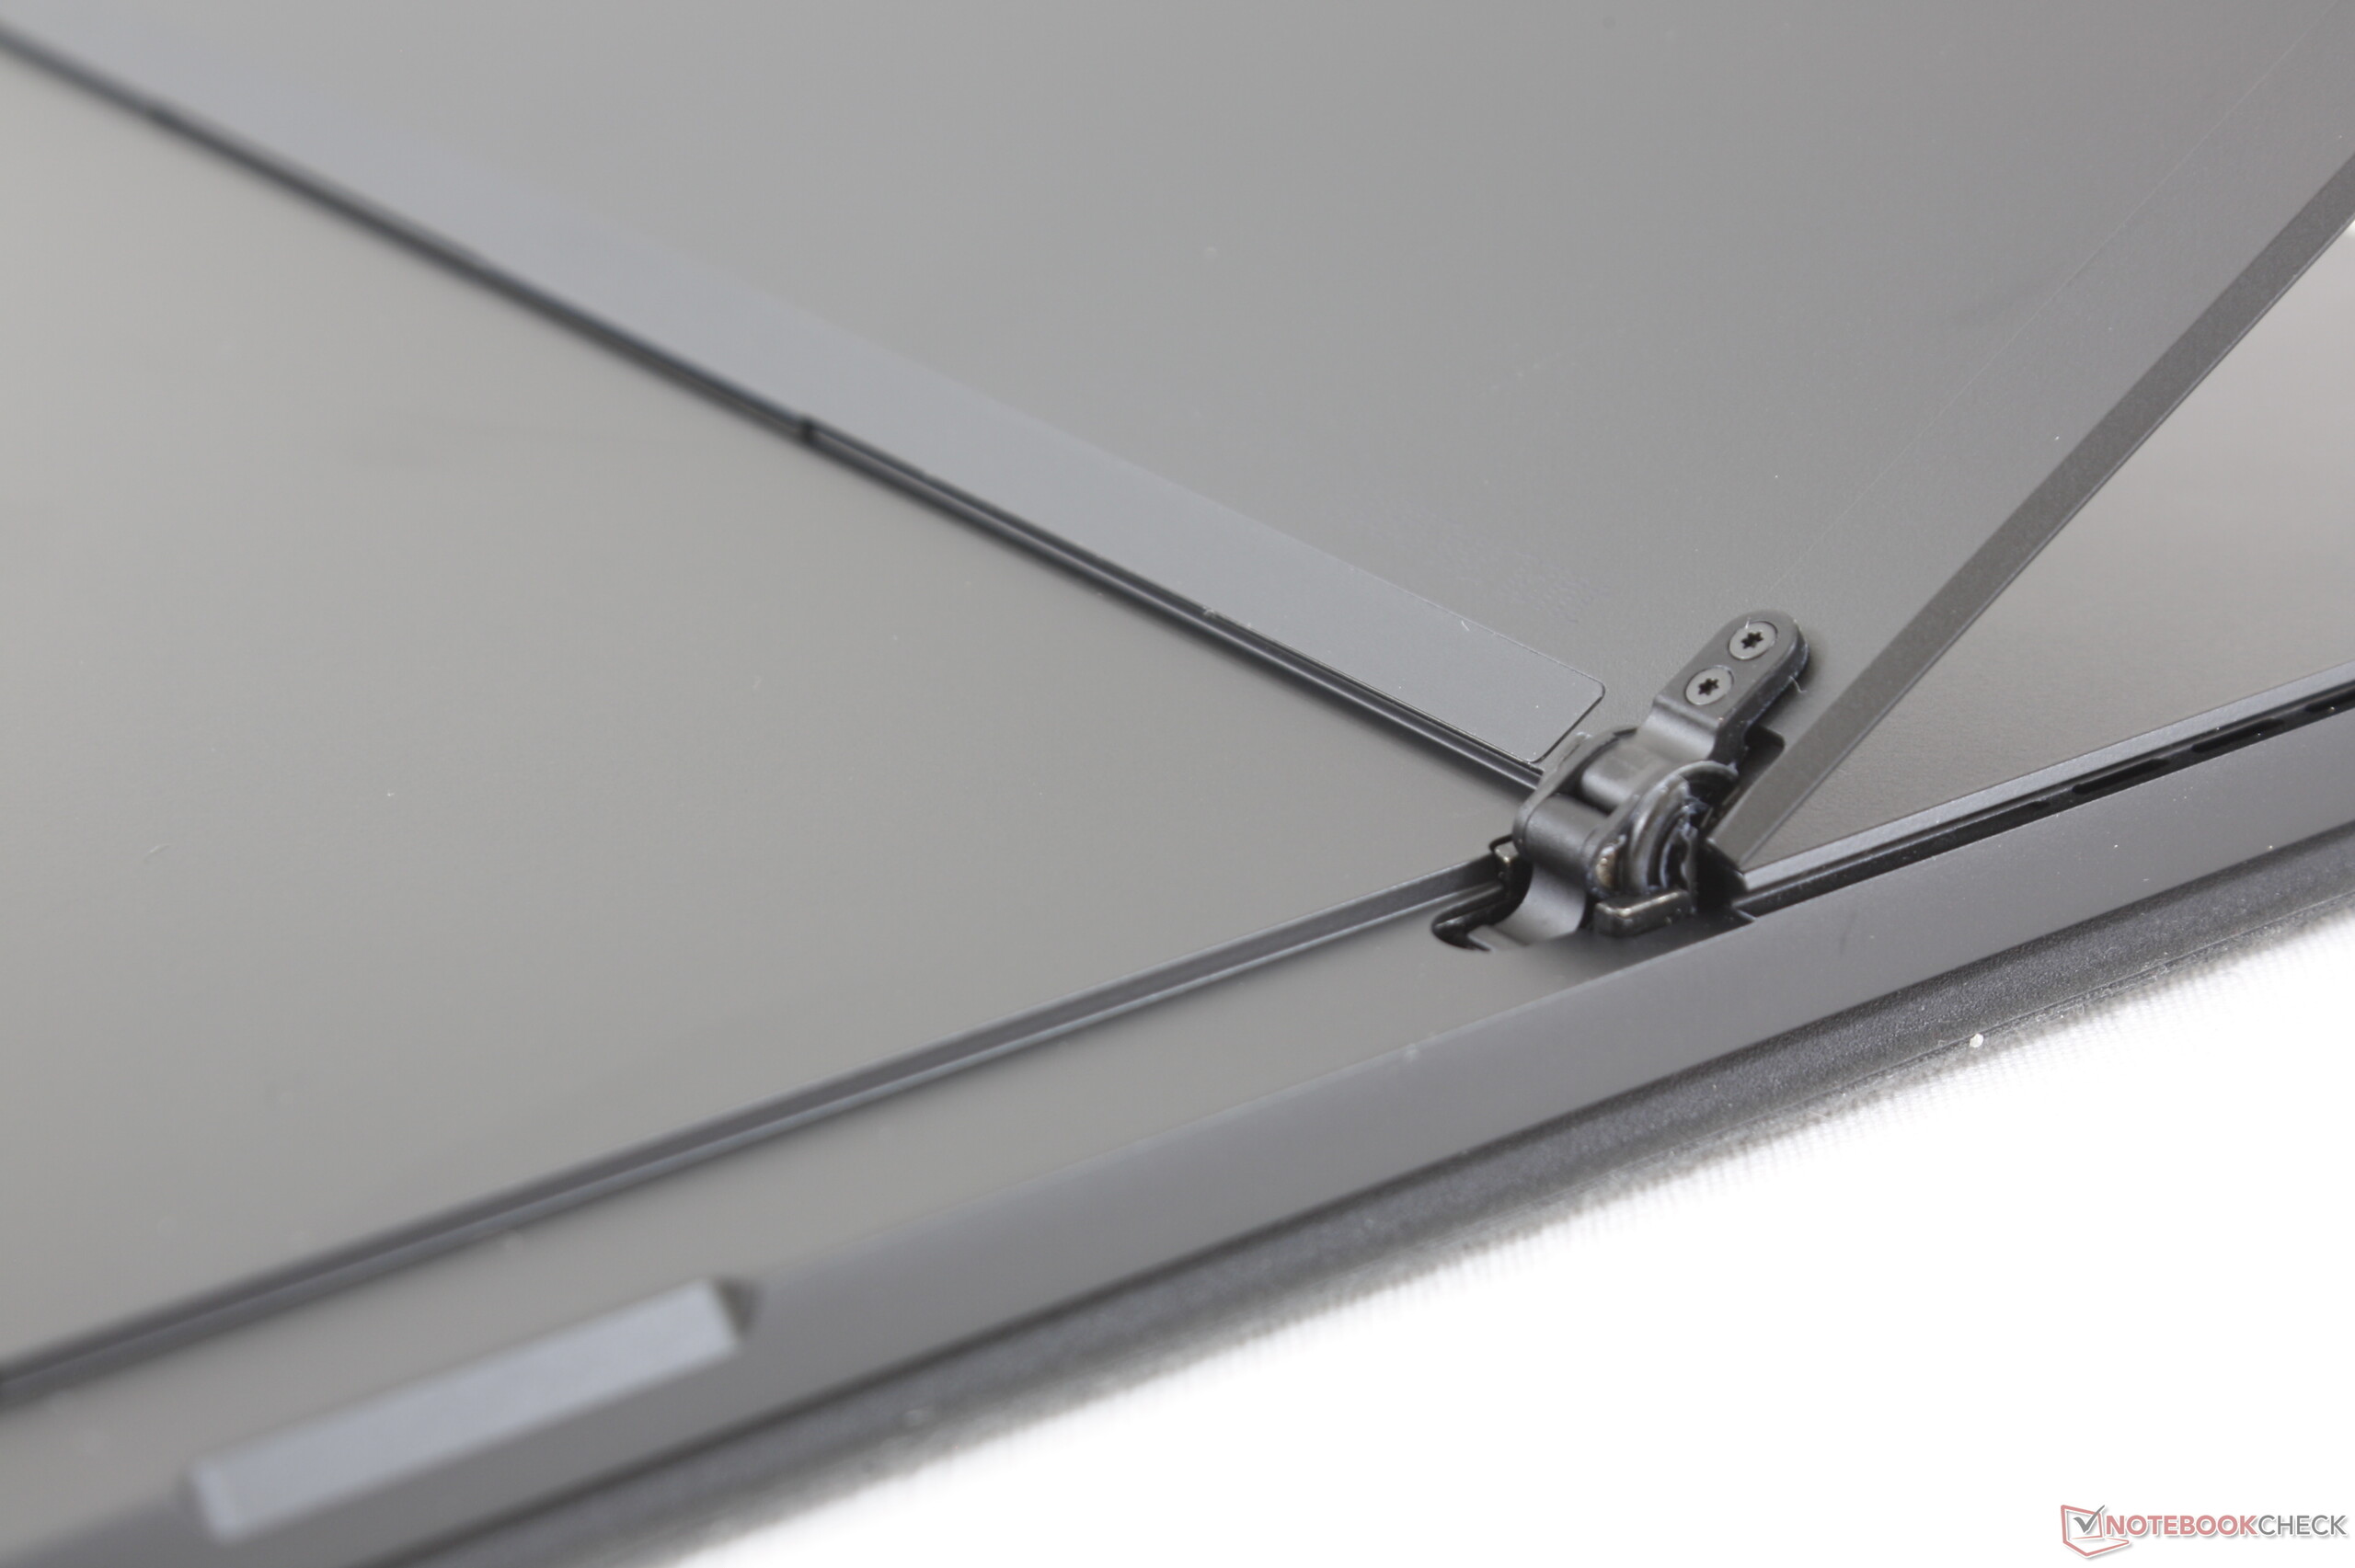
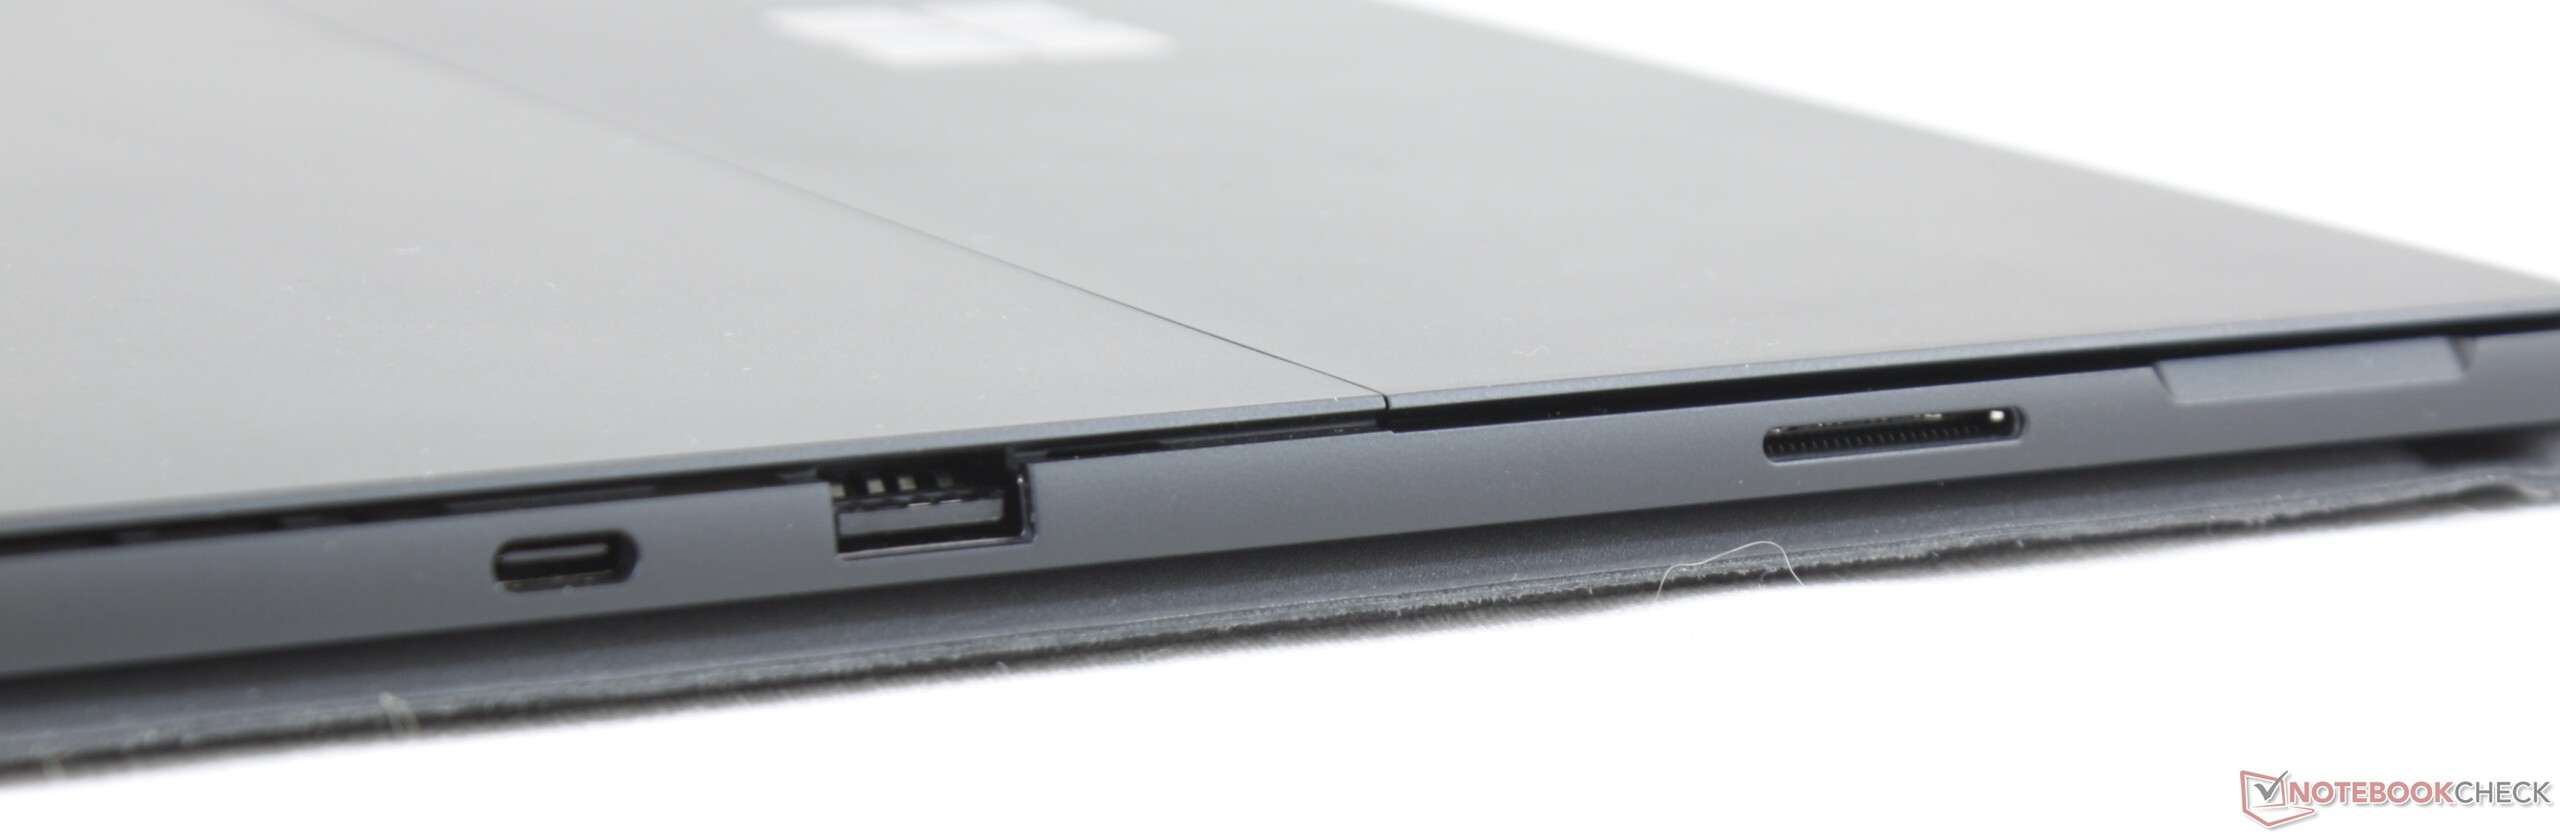
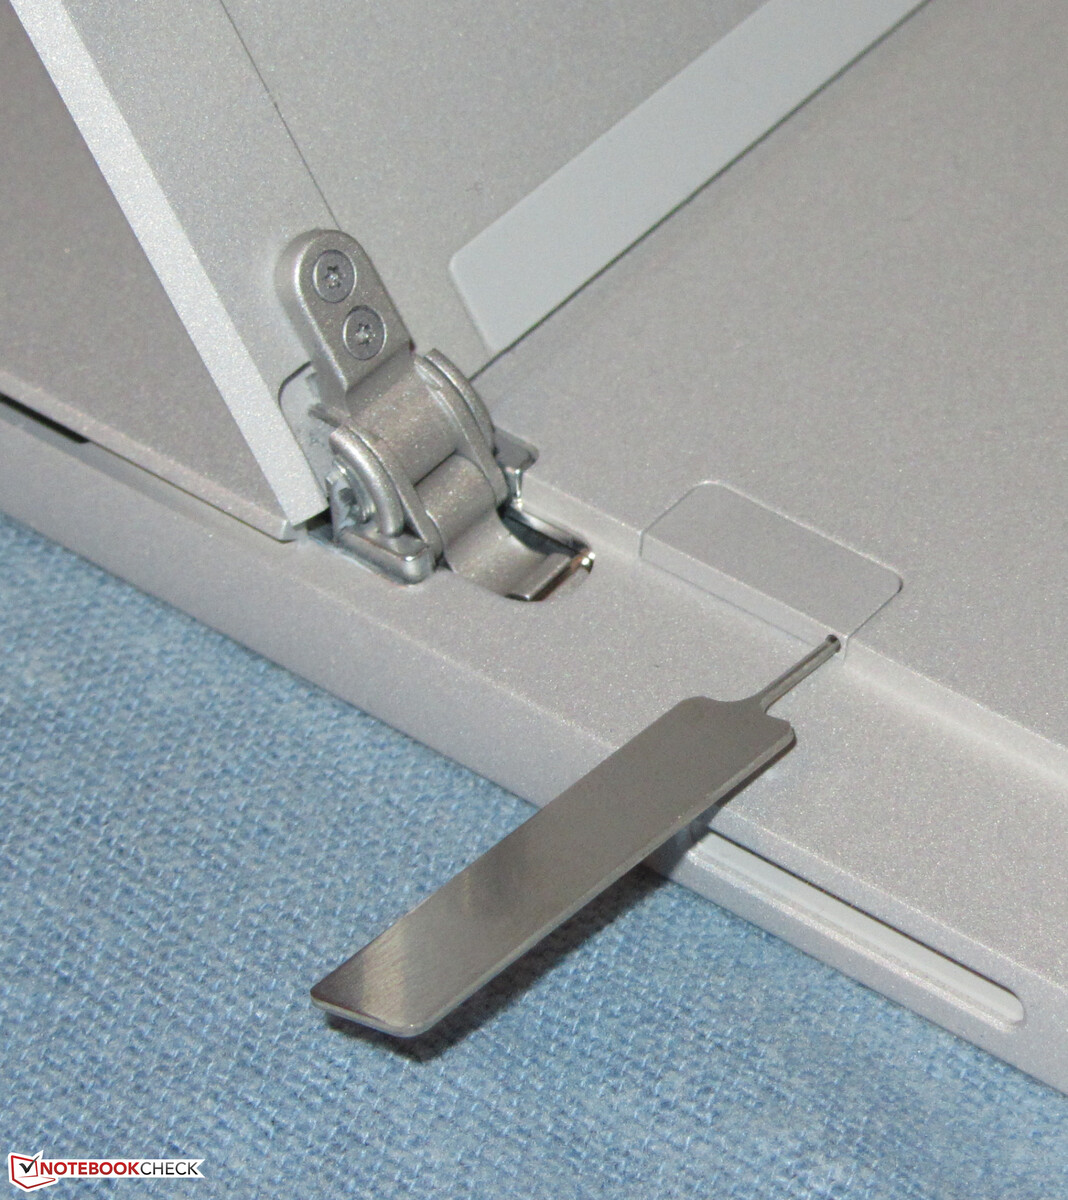
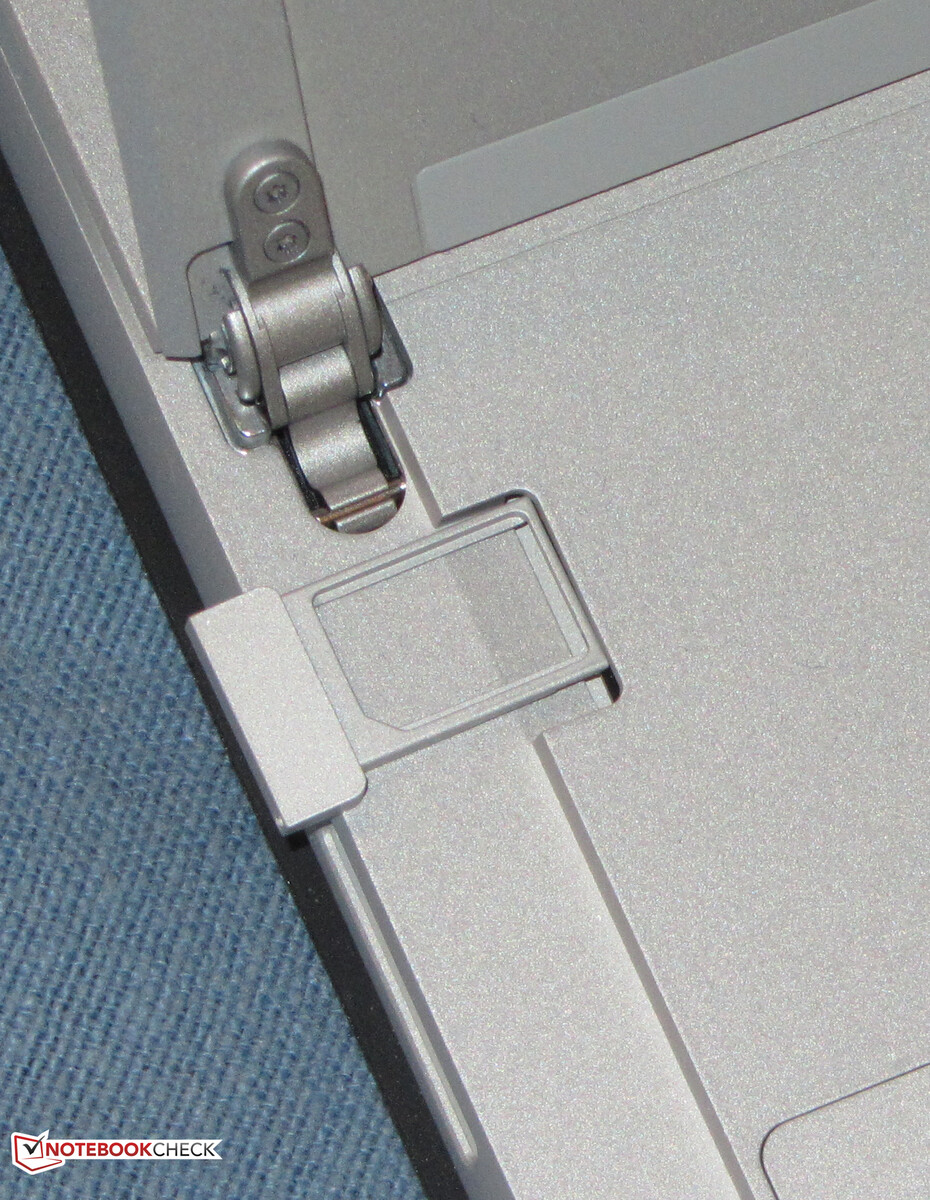
Microsoft installs the Qualcomm Snapdragon X20 modem in the Surface. The SIM card slot is behind the stand. The memory card reader had to be removed. Moreover, the LTE modem is only available in combination with a Core i5 processor.


Display - IPS in the 3:2 format
The 12.3-inch touchscreen display has a native resolution of 2736x1824 pixels. Brightness (425.4 cd/m²) and contrast (1,200:1) are good. Furthermore, the display flickers at a frequency of 199.2 Hz at brightness levels of 57% (equivalent to about 119 cd/m²) and below. Due to the low frequency, sensitive users might experience headaches and/or eye problems.
| |||||||||||||||||||||||||
Brightness Distribution: 85 %
Center on Battery: 407 cd/m²
Contrast: 1200:1 (Black: 0.34 cd/m²)
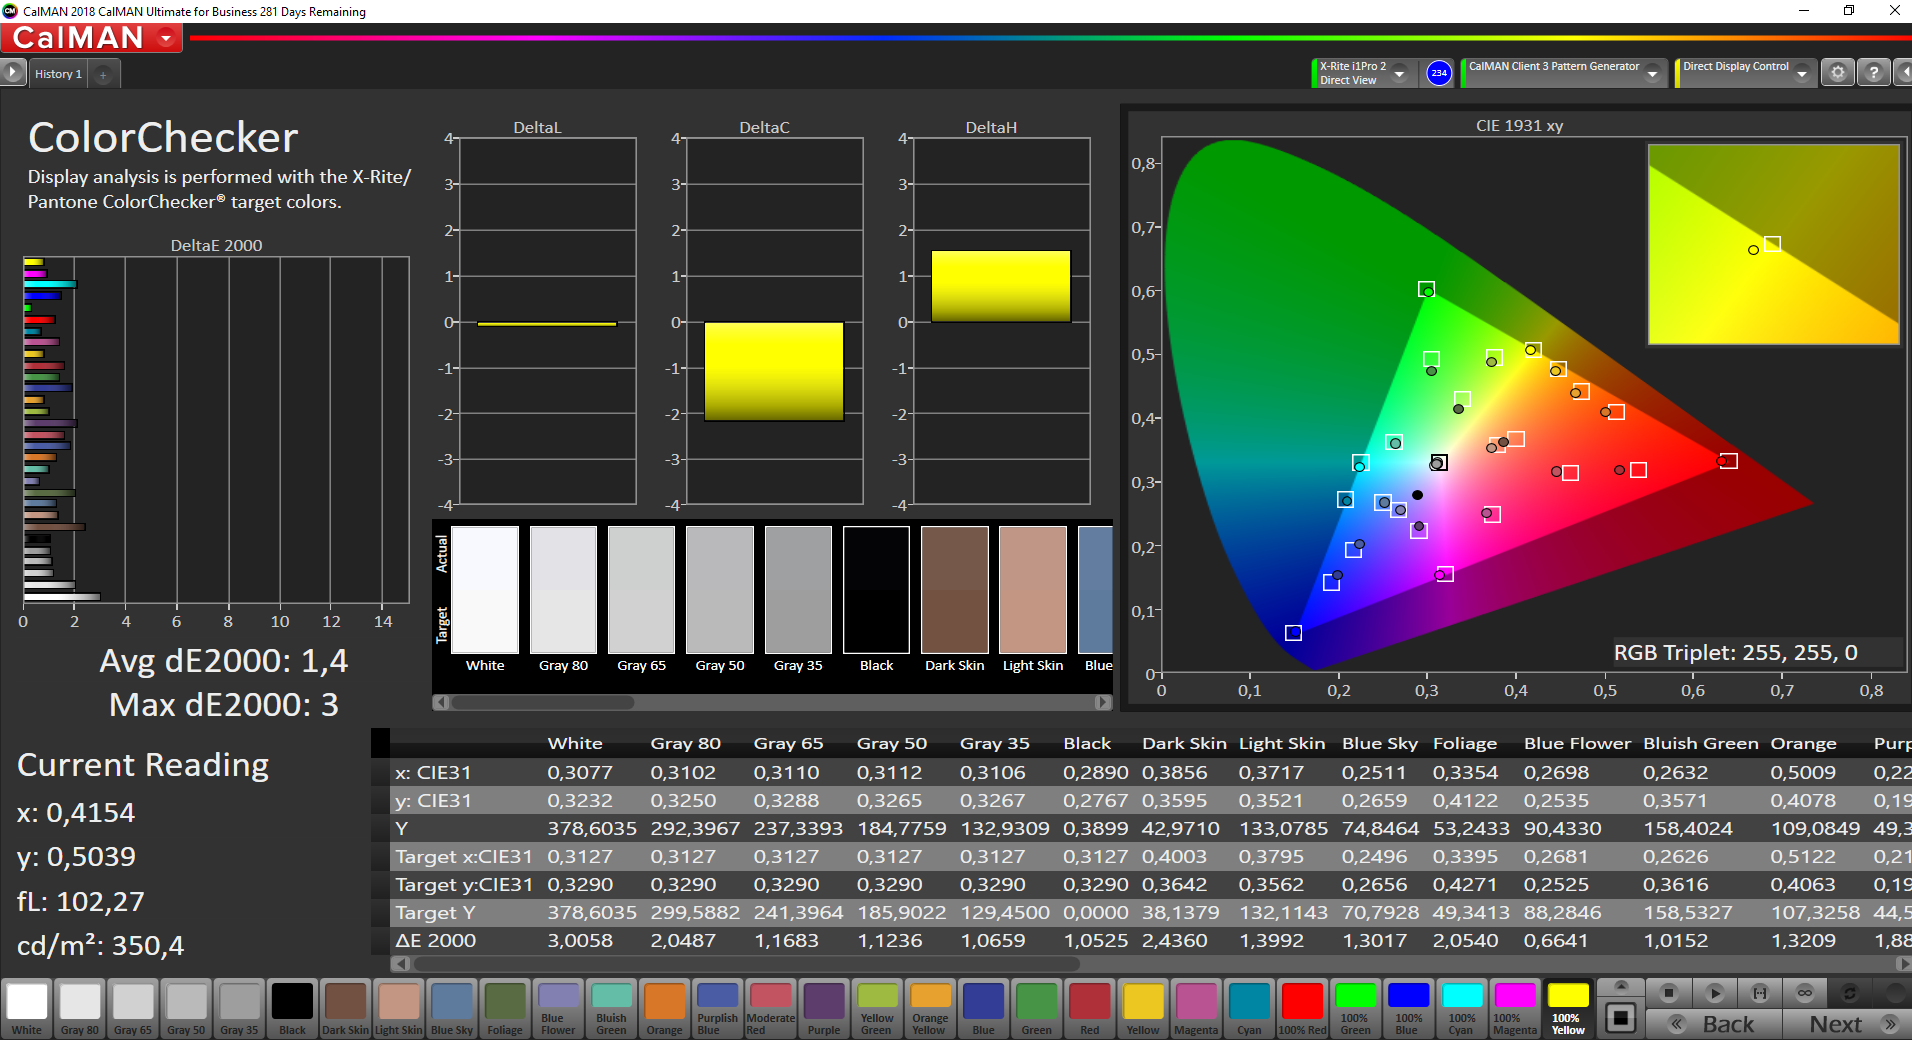
ΔE Color 1.5 | 0.5-29.43 Ø5, calibrated: 1.4
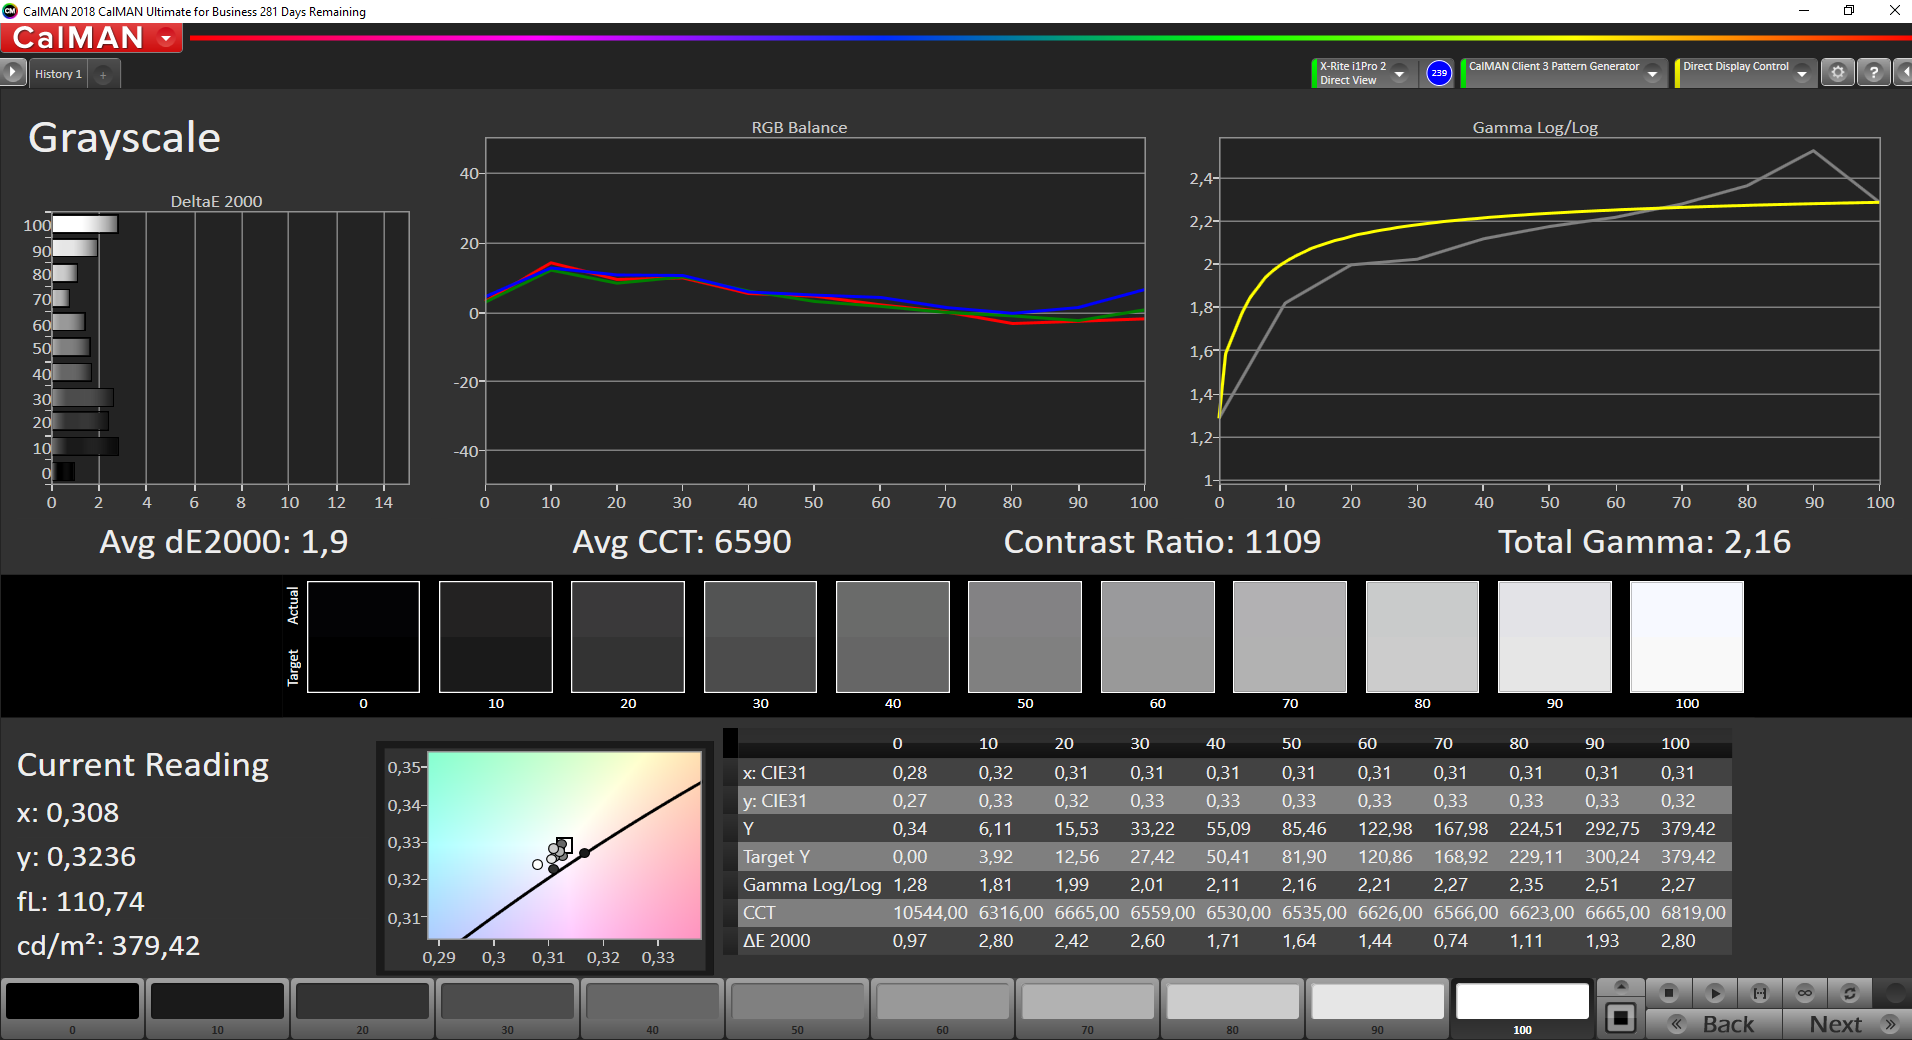
ΔE Greyscale 1.6 | 0.57-98 Ø5.3
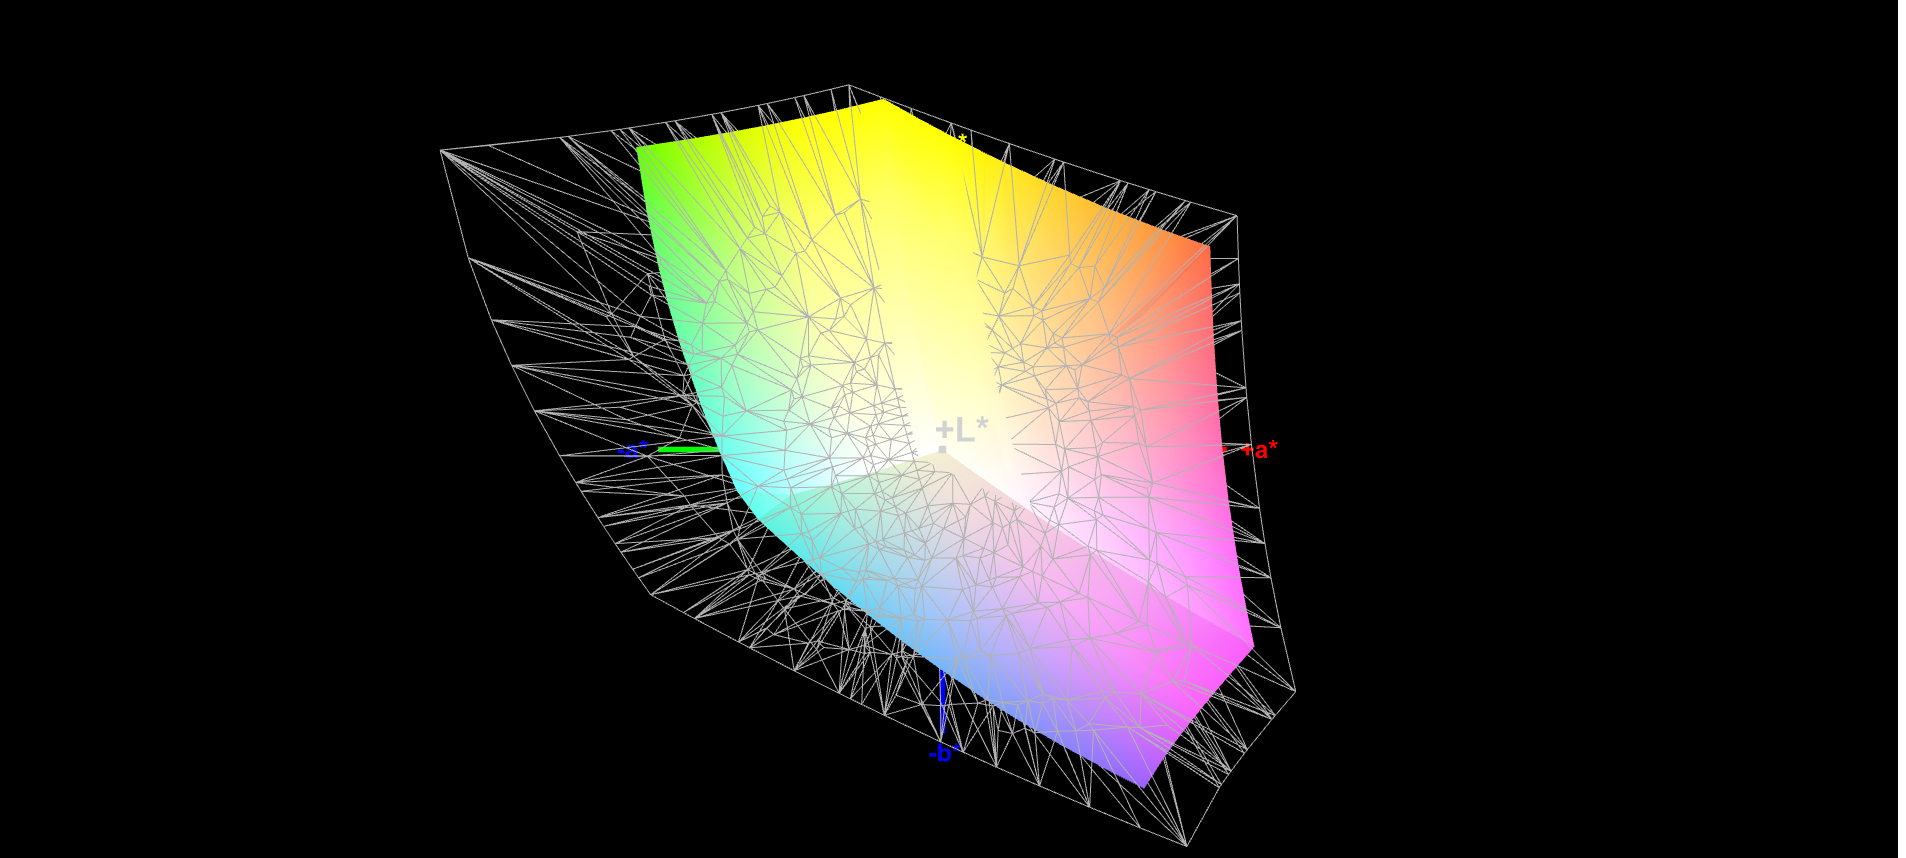
96.8% sRGB (Argyll 1.6.3 3D)
63.7% AdobeRGB 1998 (Argyll 1.6.3 3D)
69.1% AdobeRGB 1998 (Argyll 2.2.0 3D)
96.7% sRGB (Argyll 2.2.0 3D)
66.9% Display P3 (Argyll 2.2.0 3D)
Gamma: 2.05
| Microsoft Surface Pro 7 Plus LG Philips LP123WQ332684, IPS, 2736x1824, 12.30 | Lenovo Yoga Duet 7 13IML05-82AS000WGE CSOT T3 LEN8290, IPS, 2160x1350, 13.00 | Dell Latitude 12 7210 2-in-1 Sharp LQ123N1, IPS, 1920x1280, 12.30 | Microsoft Surface Pro 7 LG Philips LP123WQ112604, IPS, 2736x1824, 12.30 | Microsoft Surface Pro 7 Core i5-1035G4 LG Philips LP123WQ112604, IPS, 2736x1824, 12.30 | |
|---|---|---|---|---|---|
| Display | 3% | 0% | -4% | -2% | |
| Display P3 Coverage | 66.9 | 68.9 3% | 67.9 1% | 63.7 -5% | 66 -1% |
| sRGB Coverage | 96.7 | 98.2 2% | 96.8 0% | 95.8 -1% | 93.8 -3% |
| AdobeRGB 1998 Coverage | 69.1 | 71.1 3% | 68.8 0% | 65.7 -5% | 66.9 -3% |
| Response Times | 5% | 208% | 21% | 3590% | |
| Response Time Grey 50% / Grey 80% * | 50.8 ? | 58 ? -14% | 29 ? 43% | 40 ? 21% | 34.8 ? 31% |
| Response Time Black / White * | 33.6 ? | 26 ? 23% | 16 ? 52% | 28 ? 17% | 26.4 ? 21% |
| PWM Frequency | 199.2 ? | 1250 ? 528% | 250 ? 26% | 21550 ? 10718% | |
| Screen | -65% | -13% | -6% | -74% | |
| Brightness middle | 408 | 450 10% | 380 -7% | 435 7% | 480.4 18% |
| Brightness | 425 | 411 -3% | 378 -11% | 422 -1% | 485 14% |
| Brightness Distribution | 85 | 83 -2% | 86 1% | 90 6% | 91 7% |
| Black Level * | 0.34 | 0.22 35% | 0.31 9% | 0.32 6% | 0.48 -41% |
| Contrast | 1200 | 2045 70% | 1226 2% | 1359 13% | 1001 -17% |
| Colorchecker dE 2000 * | 1.5 | 4.15 -177% | 2.28 -52% | 1.18 21% | 5 -233% |
| Colorchecker dE 2000 max. * | 2.5 | 11.49 -360% | 3.93 -57% | 2.27 9% | 7.72 -209% |
| Colorchecker dE 2000 calibrated * | 1.4 | 1.09 22% | 0.97 31% | 3.49 -149% | 2.44 -74% |
| Greyscale dE 2000 * | 1.6 | 6.66 -316% | 2.56 -60% | 1.12 30% | 5.9 -269% |
| Gamma | 2.05 107% | 2.42 91% | 2.32 95% | 2.3 96% | 2.38 92% |
| CCT | 6432 101% | 6043 108% | 6130 106% | 6502 100% | 7805 83% |
| Color Space (Percent of AdobeRGB 1998) | 63.7 | 65 2% | 63 -1% | 60 -6% | 60.3 -5% |
| Color Space (Percent of sRGB) | 96.8 | 98 1% | 97 0% | 96 -1% | 93.2 -4% |
| Total Average (Program / Settings) | -19% /
-44% | 65% /
28% | 4% /
-1% | 1171% /
585% |
* ... smaller is better
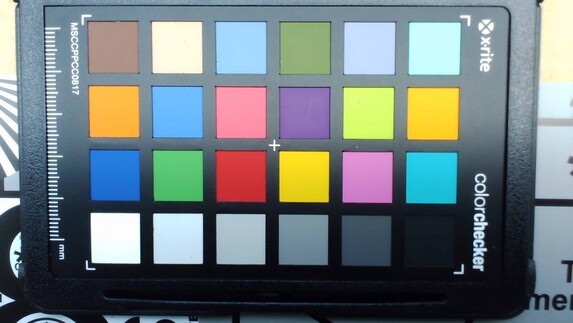
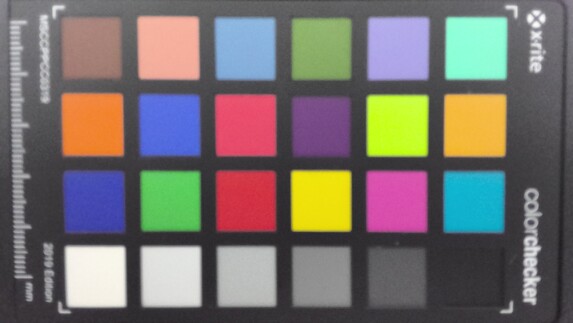
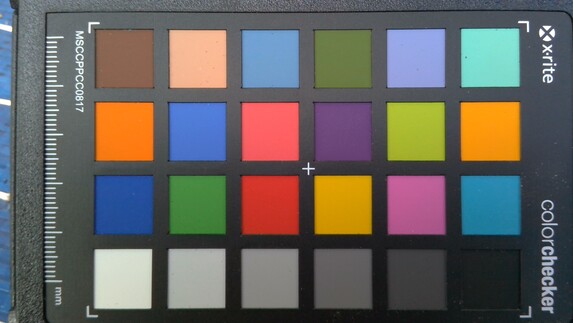
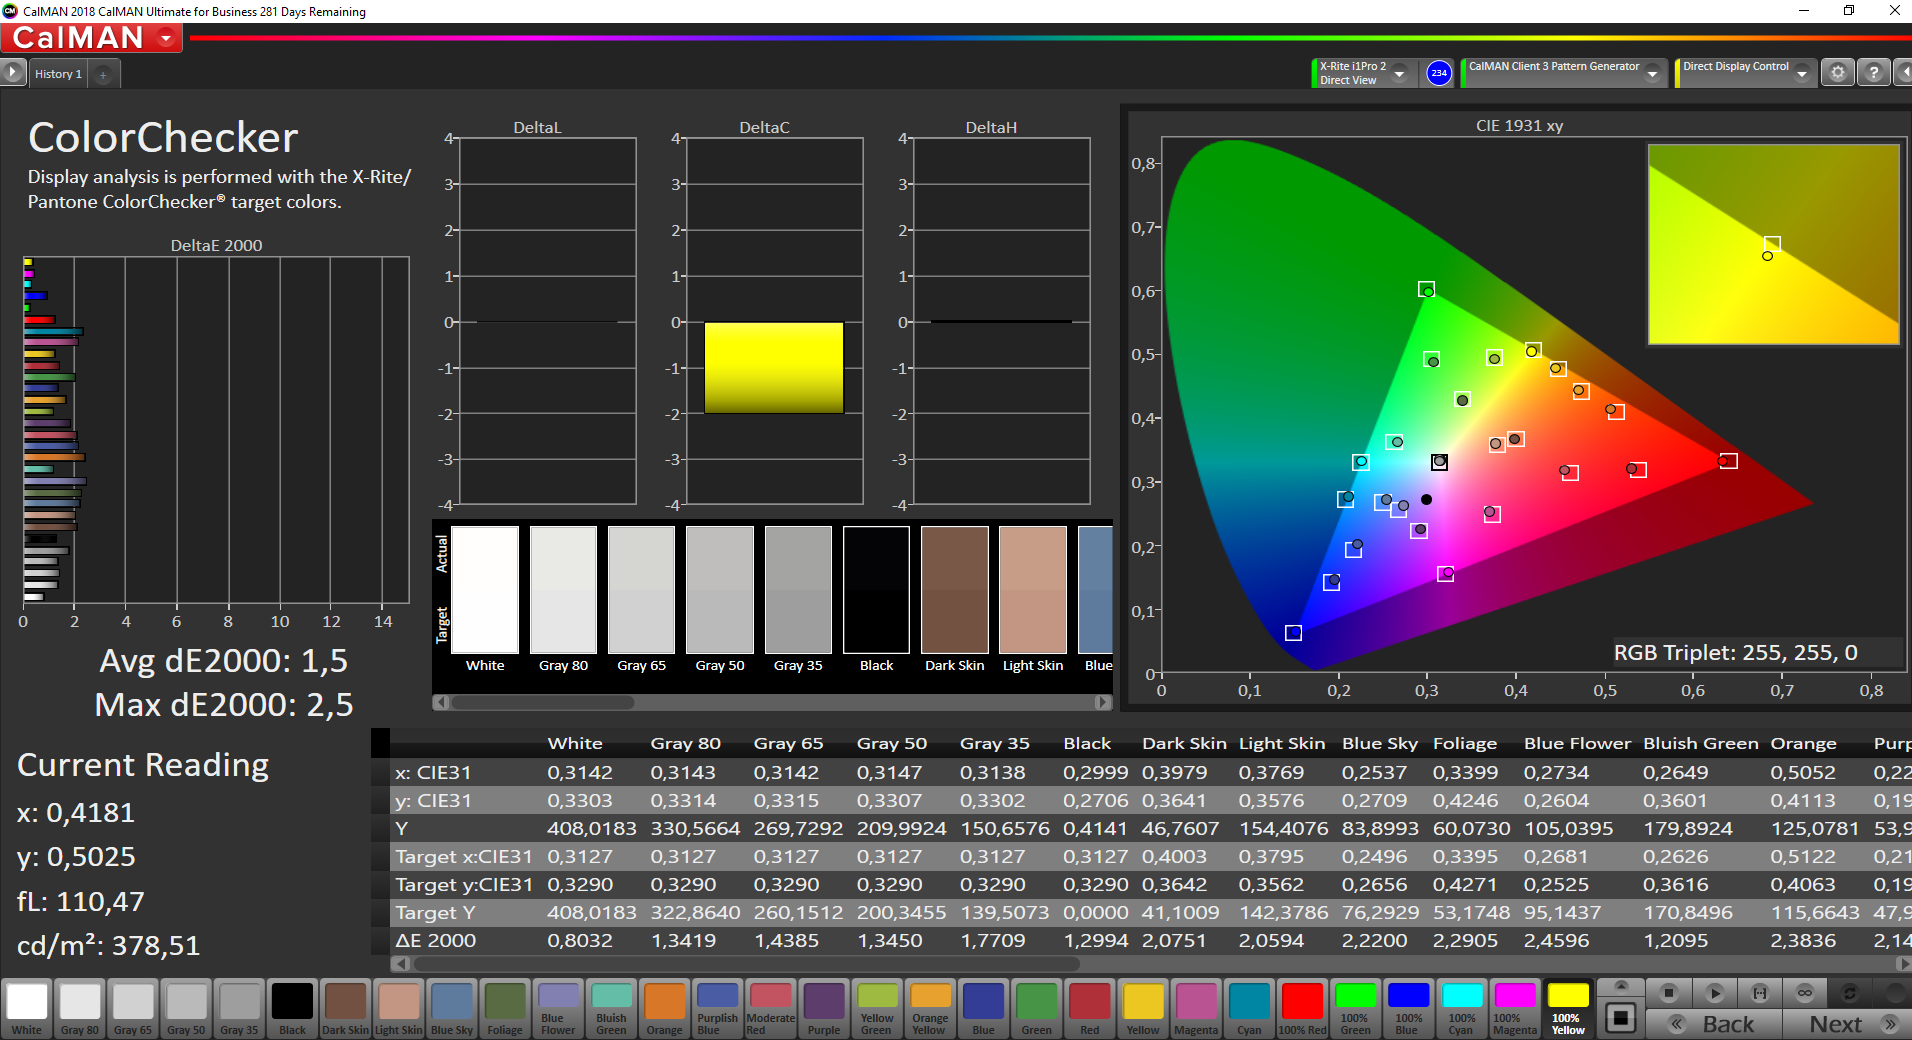
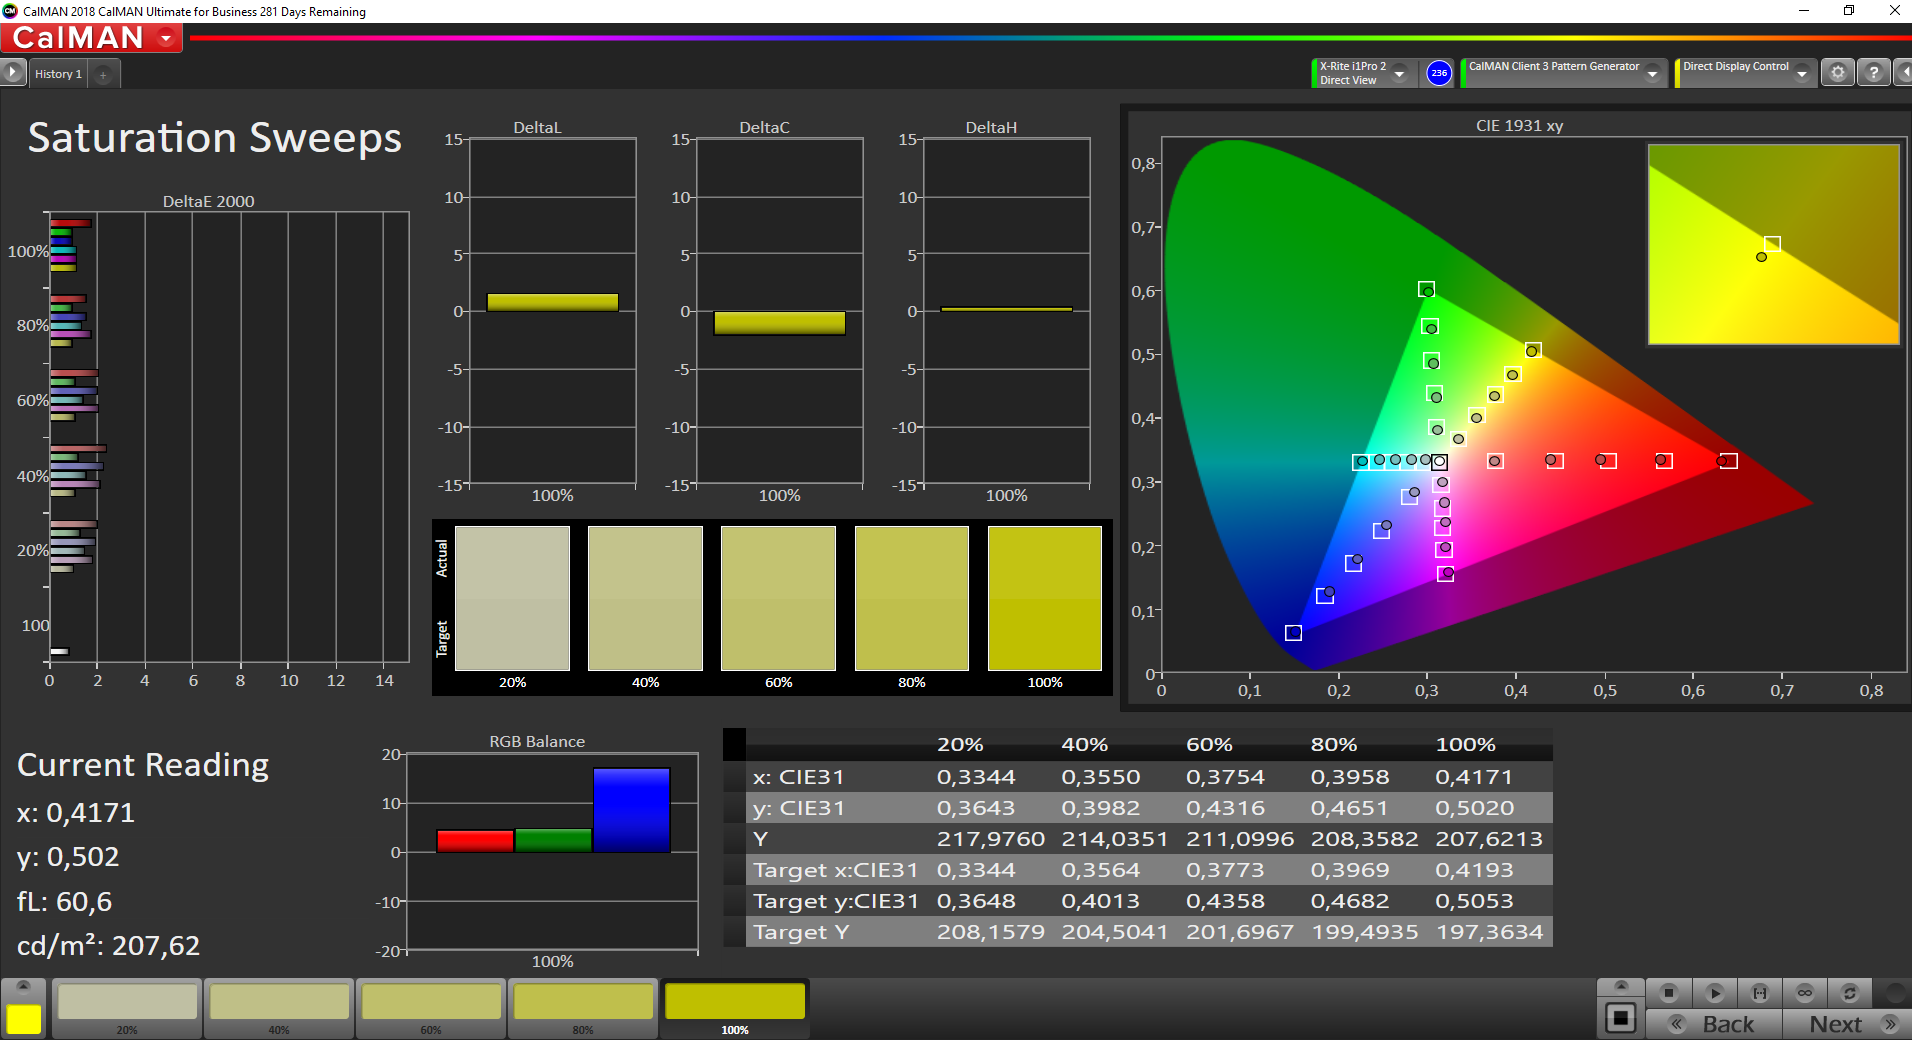
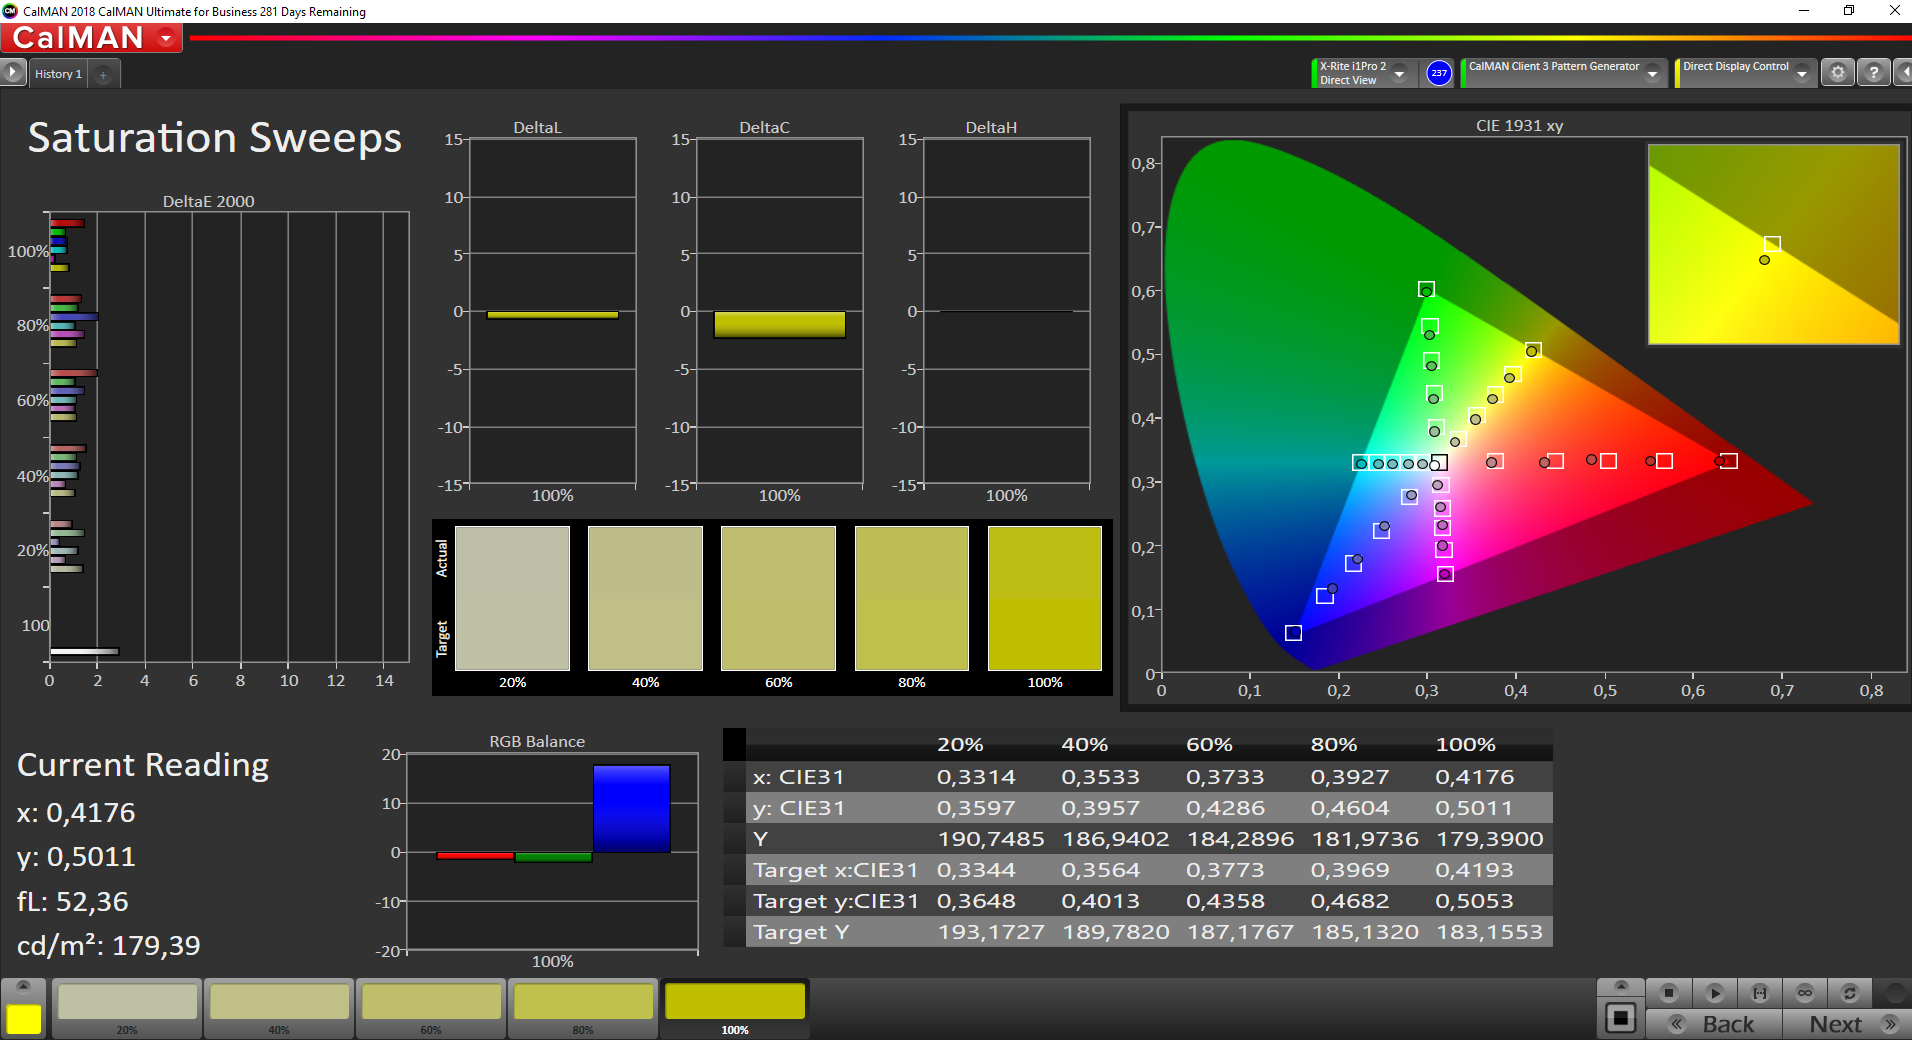
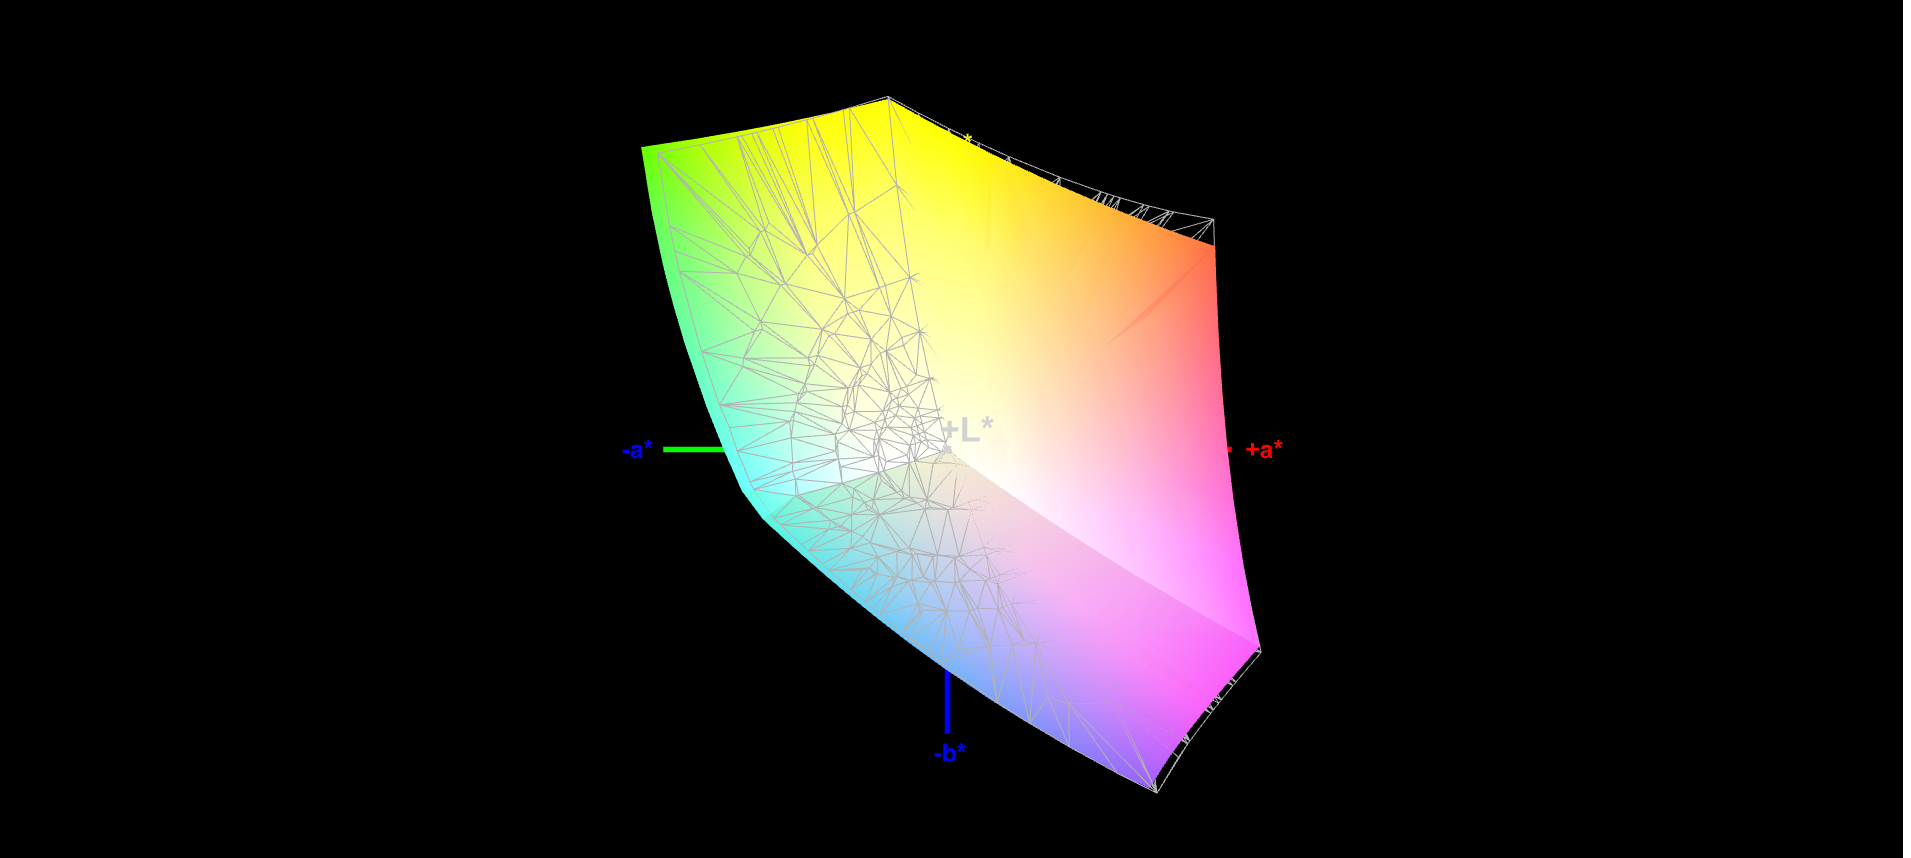
The display shows good color reproduction out of the box and meets the target (Delta E less than 3) with a color deviation of 1.5. The display doesn't suffer from a blue tint either. In addition, calibration provides slight improvements: The color deviation drops to 1.4, and grayscales are displayed in a more balanced way. The display can't completely reproduce the AdobeRGB (63.7%) and sRGB (96.8%) color spaces.

Display Response Times
| ↔ Response Time Black to White | ||
|---|---|---|
| 33.6 ms ... rise ↗ and fall ↘ combined | ↗ 18.8 ms rise | 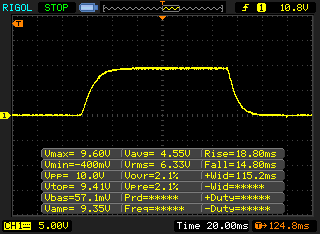 |
| ↘ 14.8 ms fall | ||
| The screen shows slow response rates in our tests and will be unsatisfactory for gamers. In comparison, all tested devices range from 0.1 (minimum) to 240 (maximum) ms. » 89 % of all devices are better. This means that the measured response time is worse than the average of all tested devices (21.5 ms). | ||
| ↔ Response Time 50% Grey to 80% Grey | ||
| 50.8 ms ... rise ↗ and fall ↘ combined | ↗ 25.2 ms rise | 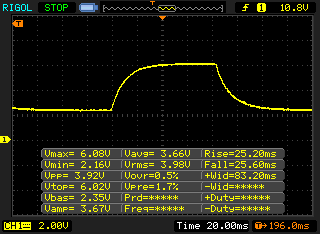 |
| ↘ 25.6 ms fall | ||
| The screen shows slow response rates in our tests and will be unsatisfactory for gamers. In comparison, all tested devices range from 0.2 (minimum) to 636 (maximum) ms. » 85 % of all devices are better. This means that the measured response time is worse than the average of all tested devices (33.7 ms). | ||
Screen Flickering / PWM (Pulse-Width Modulation)
| Screen flickering / PWM detected | 199.2 Hz | ≤ 57 % brightness setting | 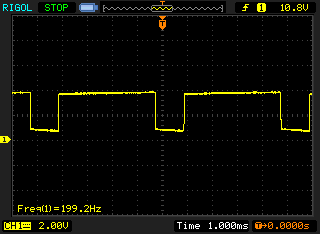 |
| ≤ 119 cd/m² brightness | |||
The display backlight flickers at 199.2 Hz (worst case, e.g., utilizing PWM) Flickering detected at a brightness setting of 57 % (119 cd/m²) and below. There should be no flickering or PWM above this brightness setting. The frequency of 199.2 Hz is relatively low, so sensitive users will likely notice flickering and experience eyestrain at the stated brightness setting and below. Flickering occurs at relatively low brightness settings, so extended use at this brightness setting or lower can cause eyestrain. In comparison: 53 % of all tested devices do not use PWM to dim the display. If PWM was detected, an average of 17903 (minimum: 5 - maximum: 3846000) Hz was measured. | |||
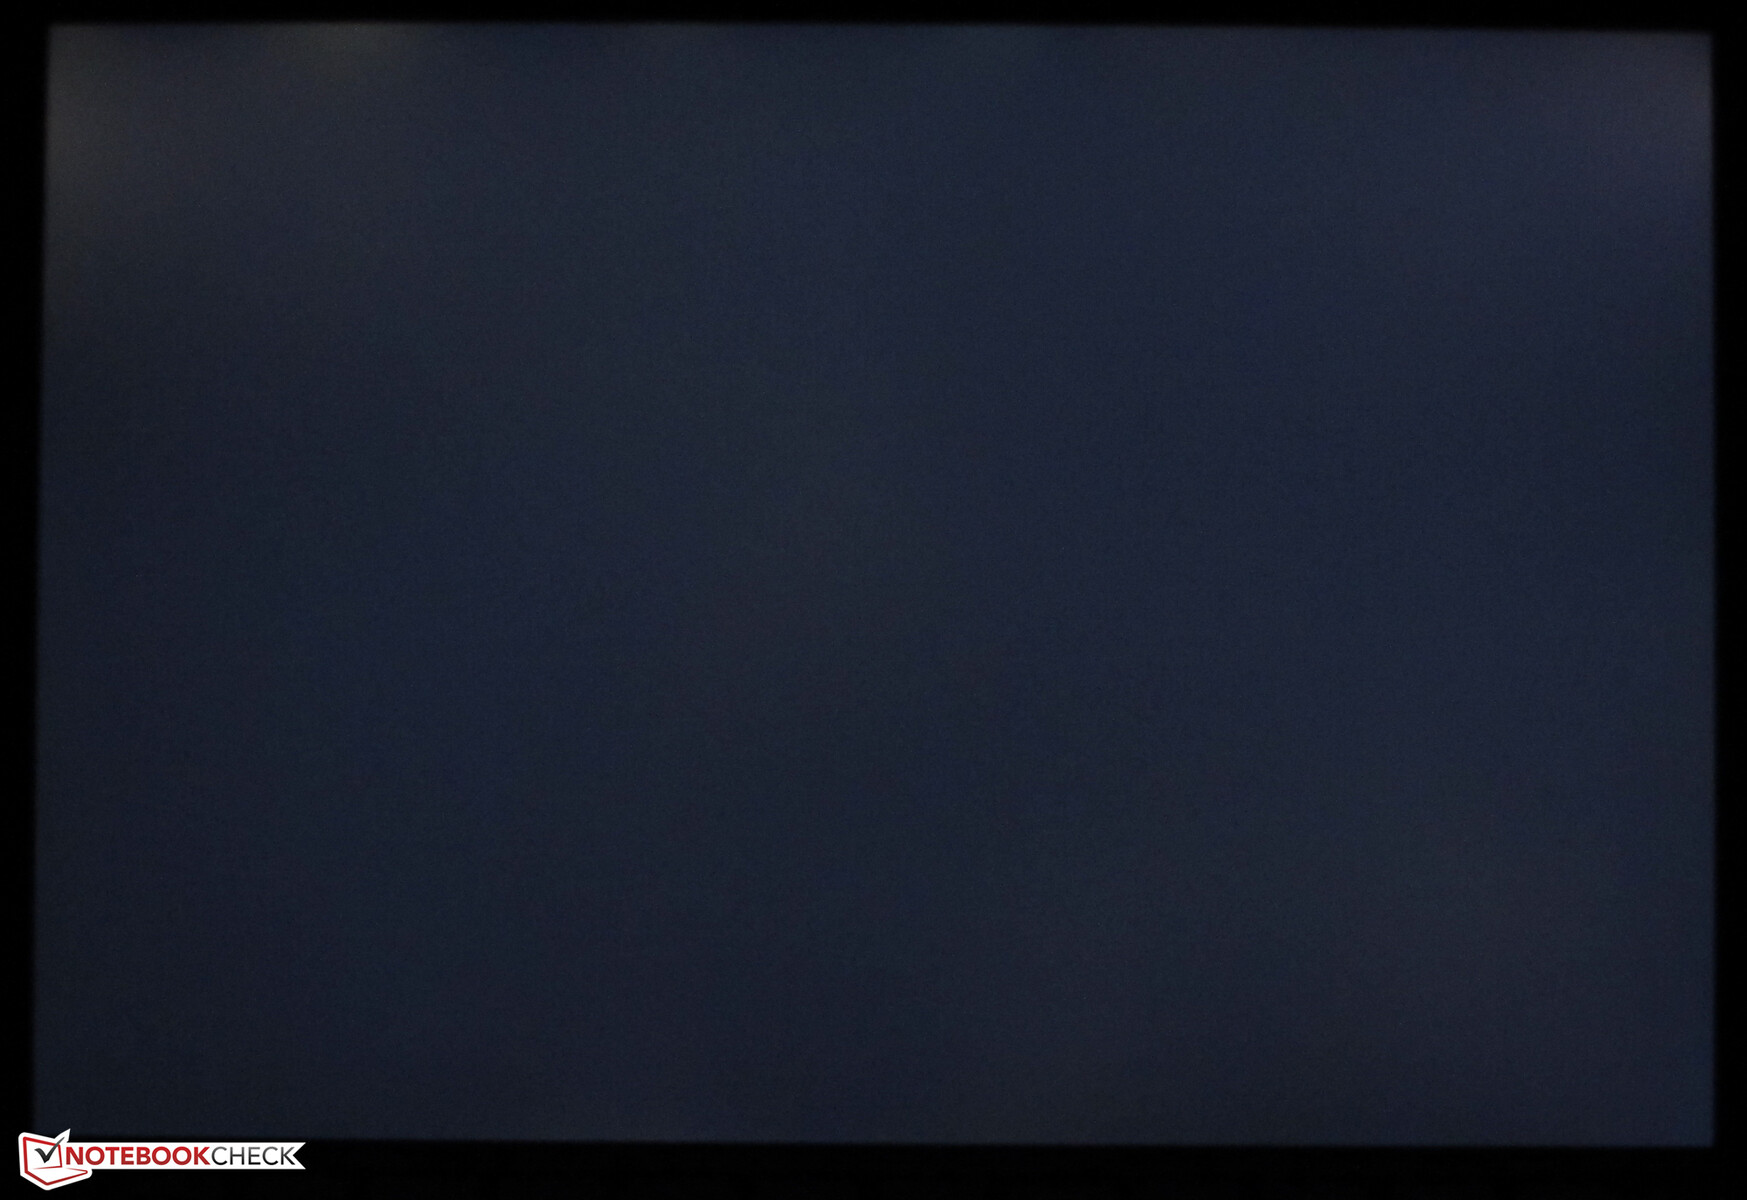
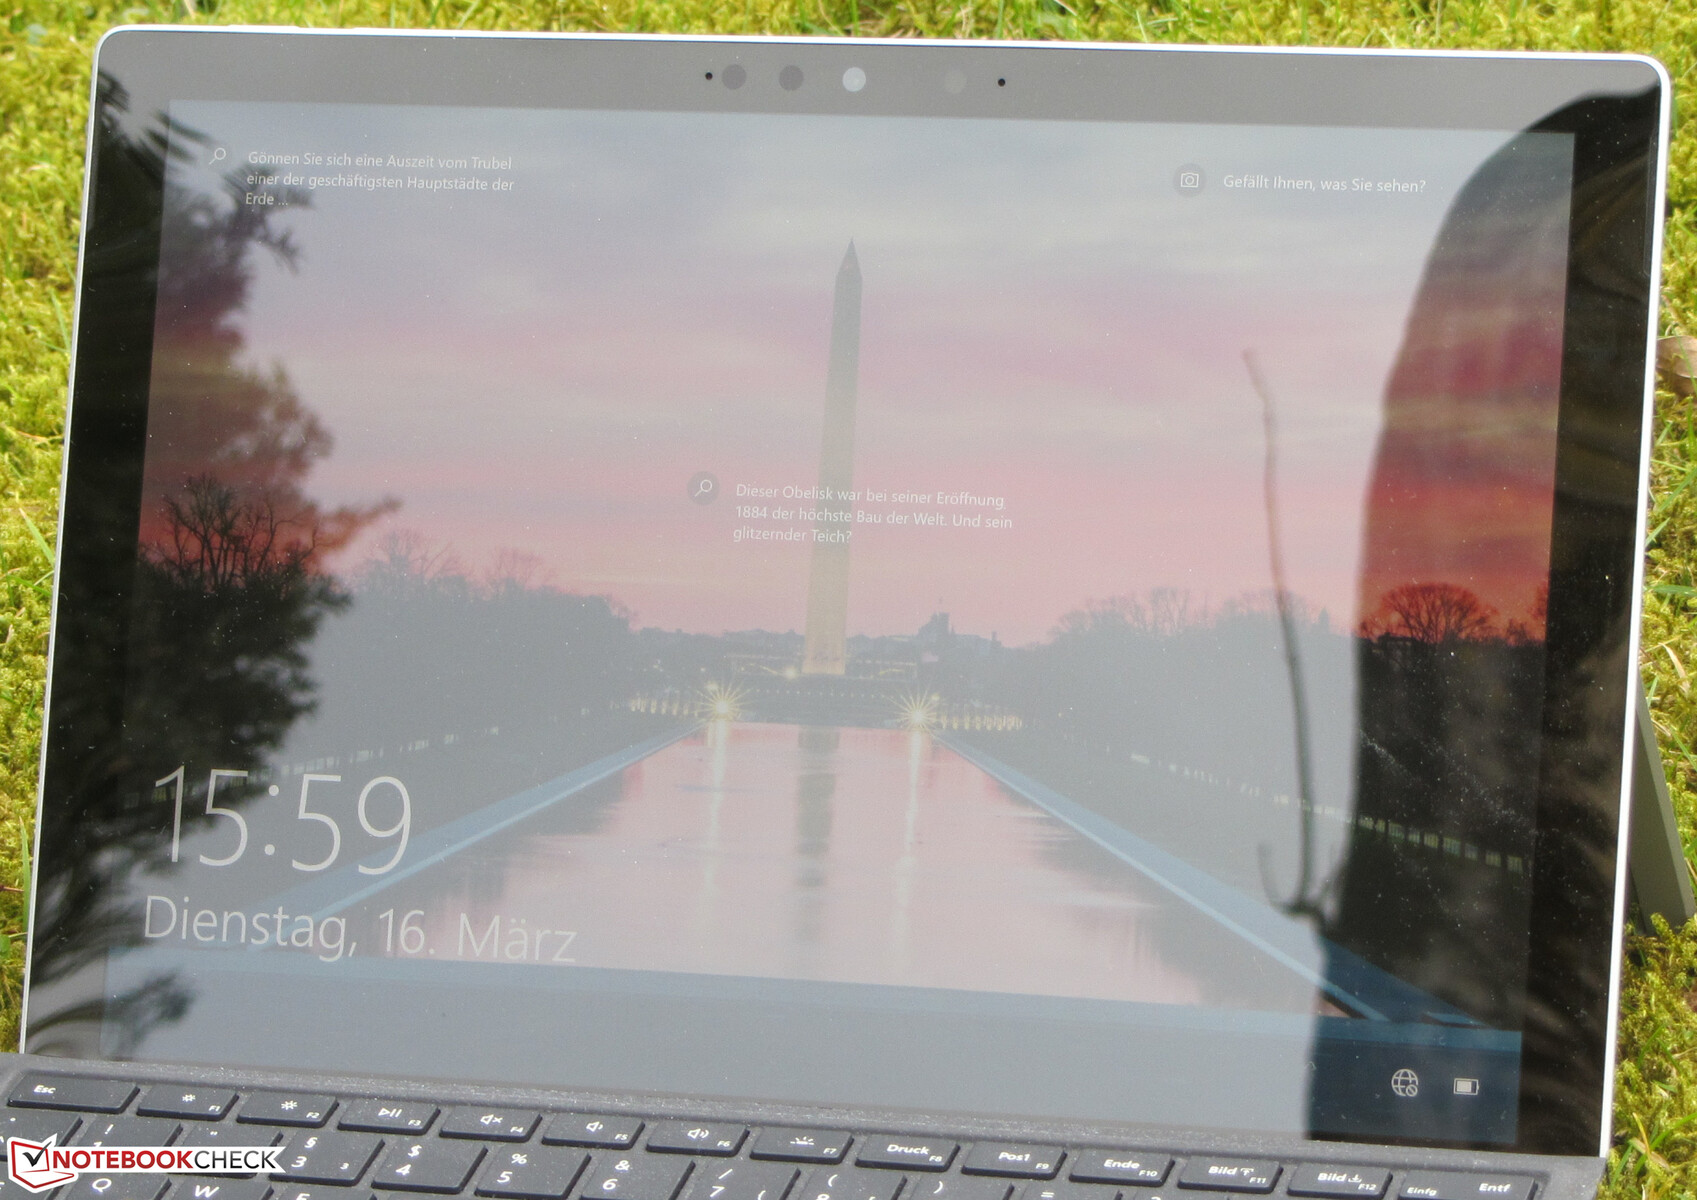
The viewing-angle stable IPS panel can be read from any position. It offers enough brightness to be viewed outdoors as well. However, the glossy display surface often obstructs legibility.

Performance - More performance thanks to Tiger Lake
Microsoft's Surface Pro 7 Plus is a 12.3-inch 2-in-1 device for businesses and schools that offers enough computing power for office and Internet applications. A variety of configurations are available.
Processor
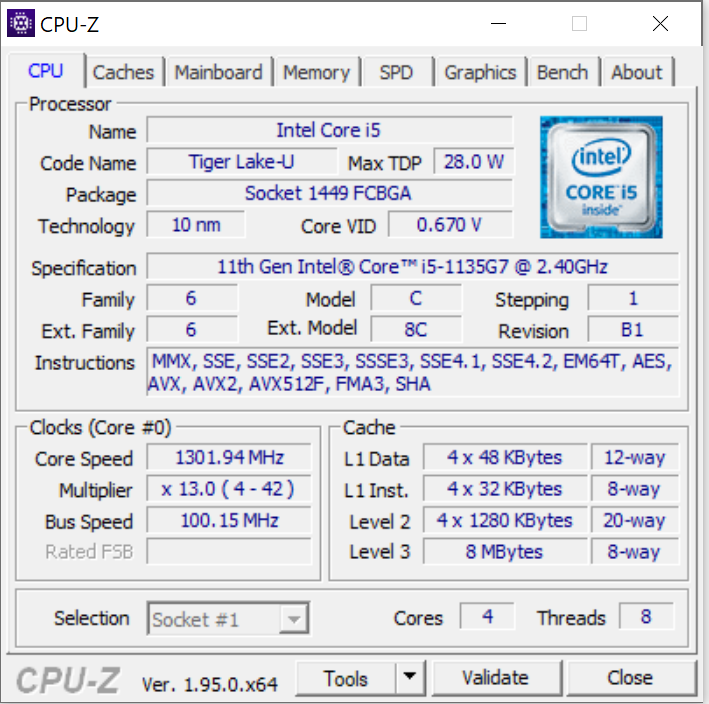
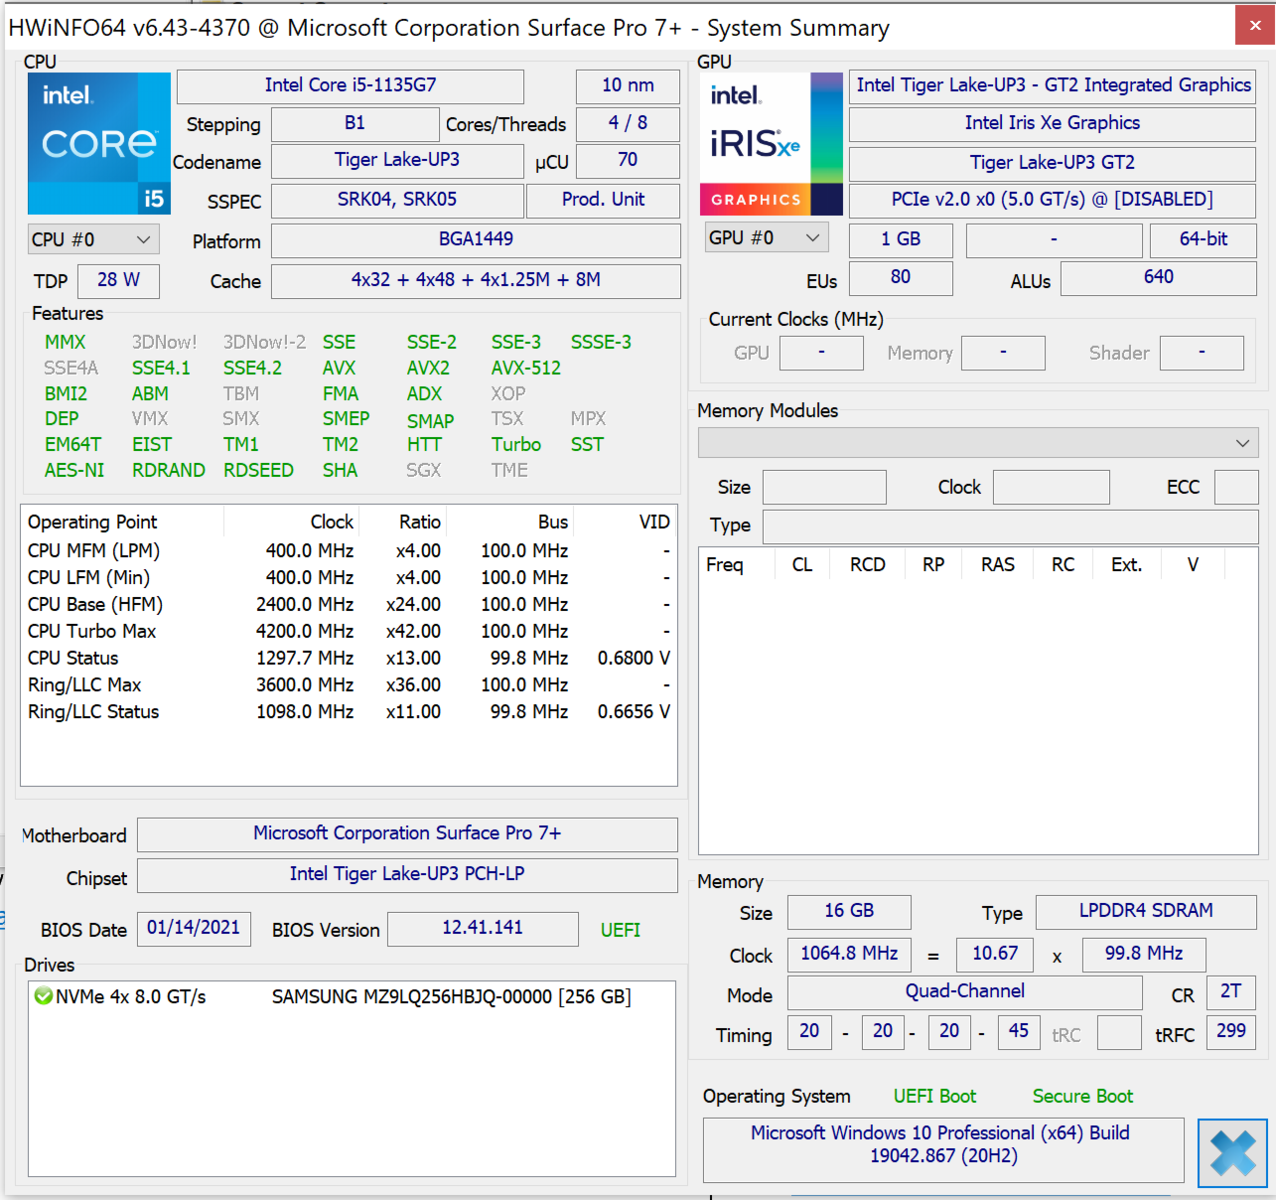
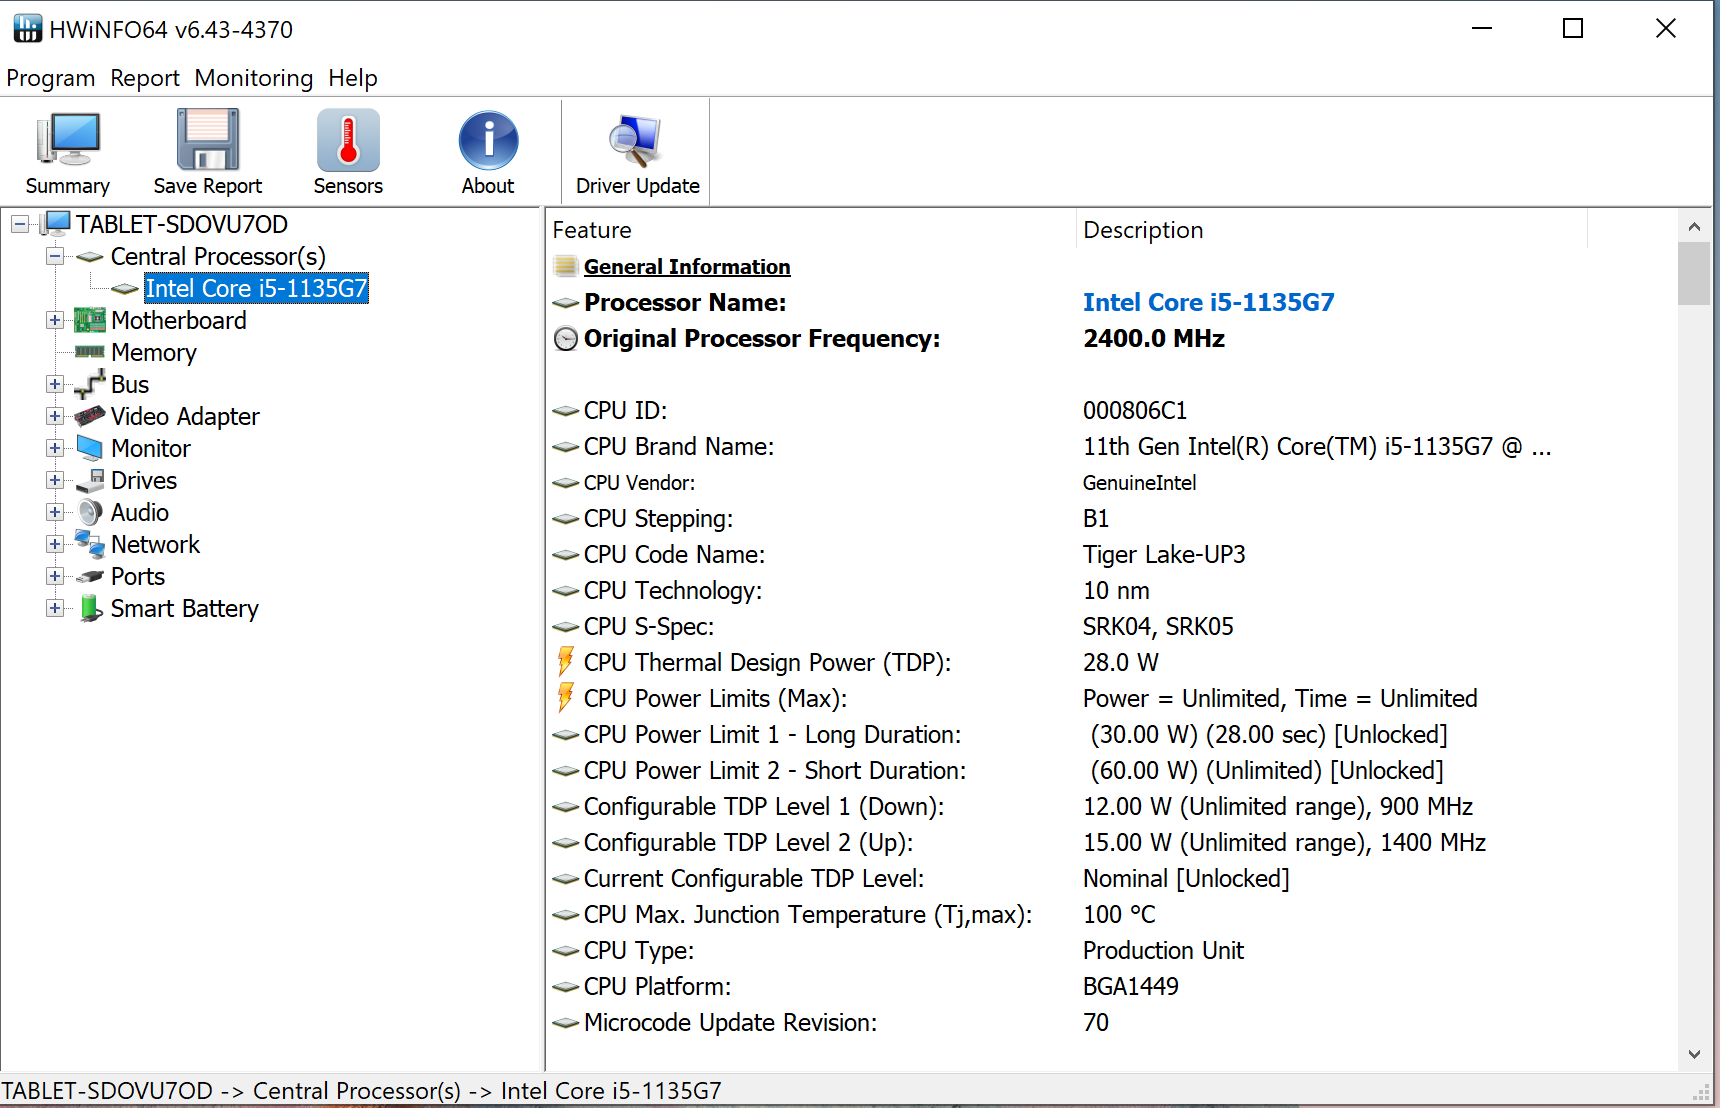
Microsoft has opted for Tiger Lake CPUs for the Plus model of the Surface Pro 7. Our review sample is equipped with a Core i5-1135G7 quad-core processor that runs at a base clock speed of 2.4 GHz. An increase to 3.8 GHz (all cores) or 4.2 GHz (one core) is possible via Turbo. Hyper-Threading (two threads per core) is supported.
The multithread tests of the Cinebench benchmarks are run at 3 to 3.5 GHz, while the single-thread tests are executed at 3.1 to 4.1 GHz. On battery power, the clock rates are 2.4 to 2.8 GHz (multithread) and 1.5 to 2.5 GHz (single-thread), respectively.
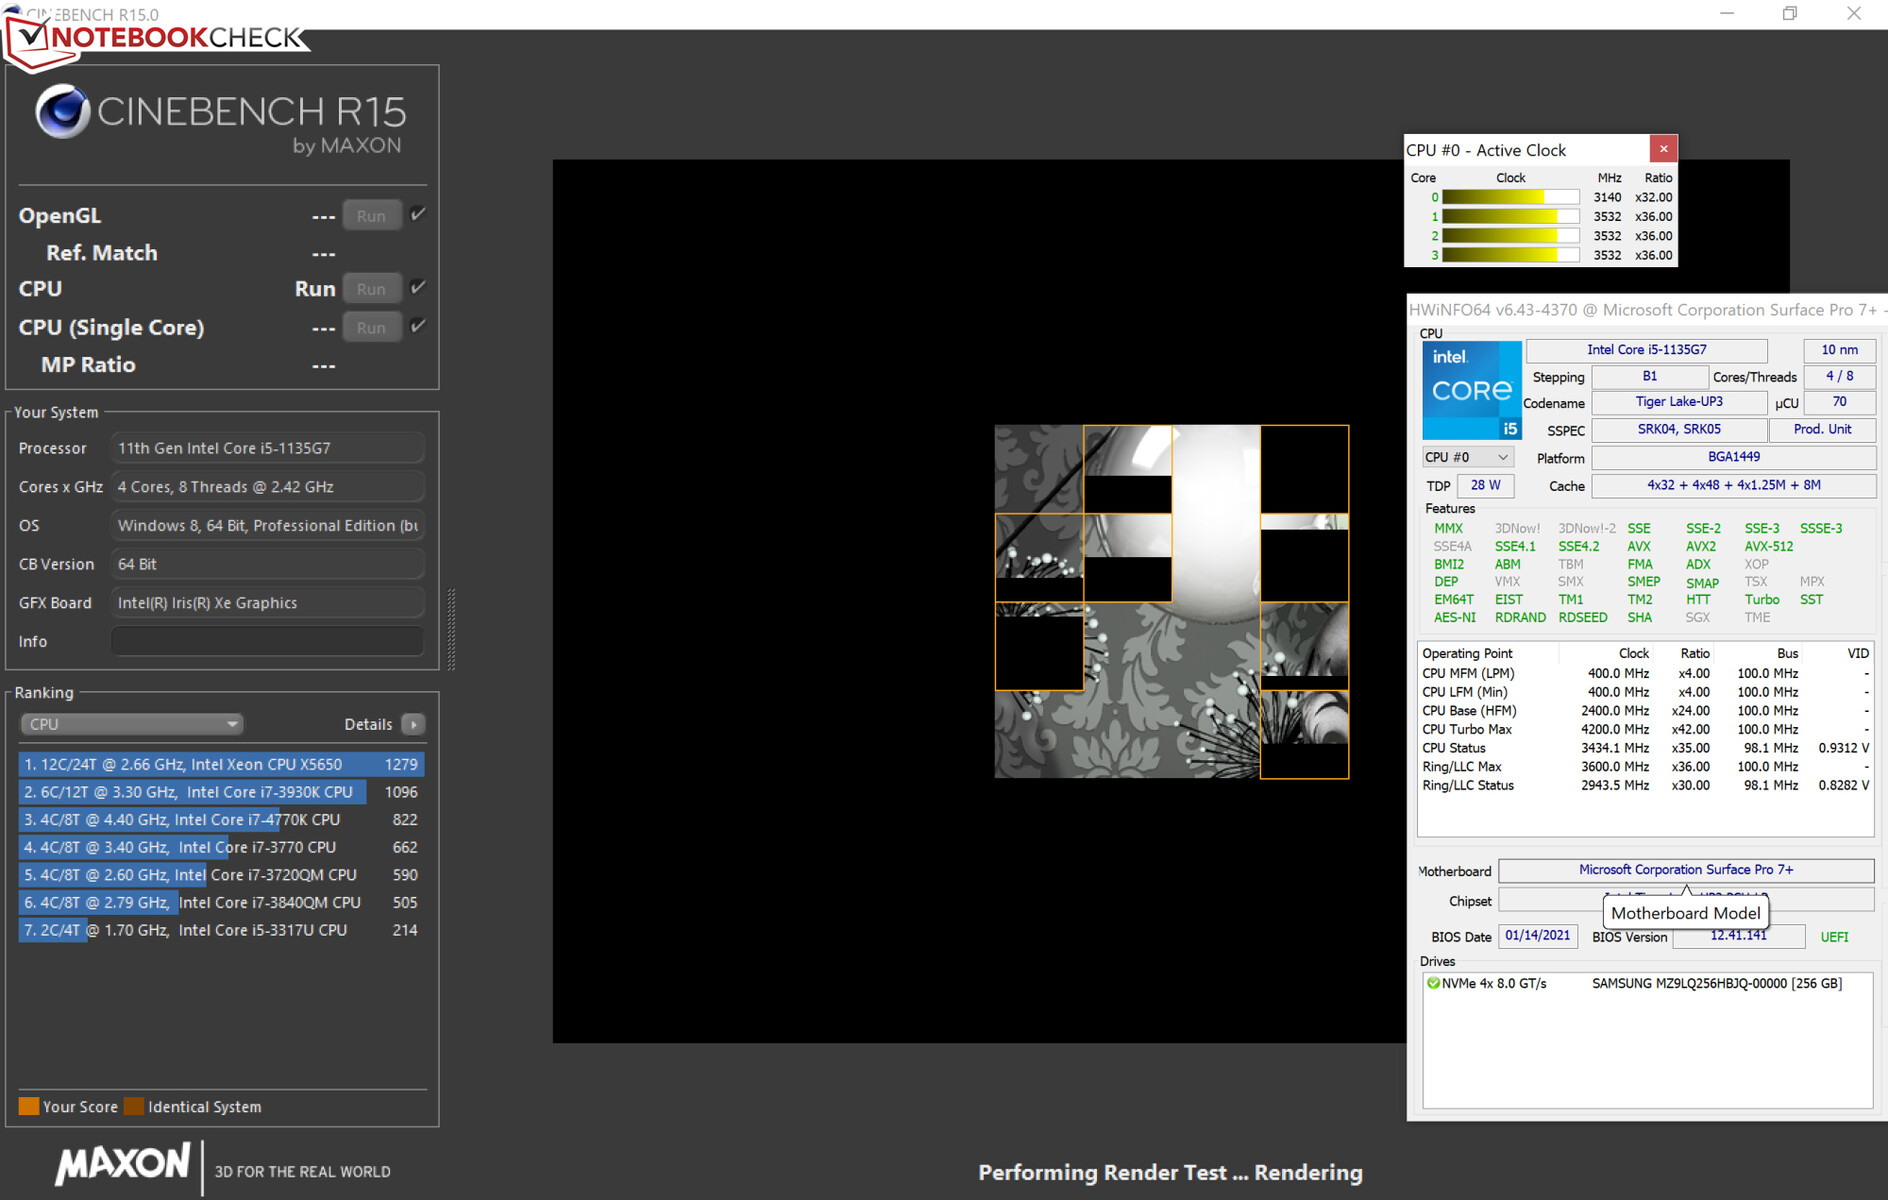
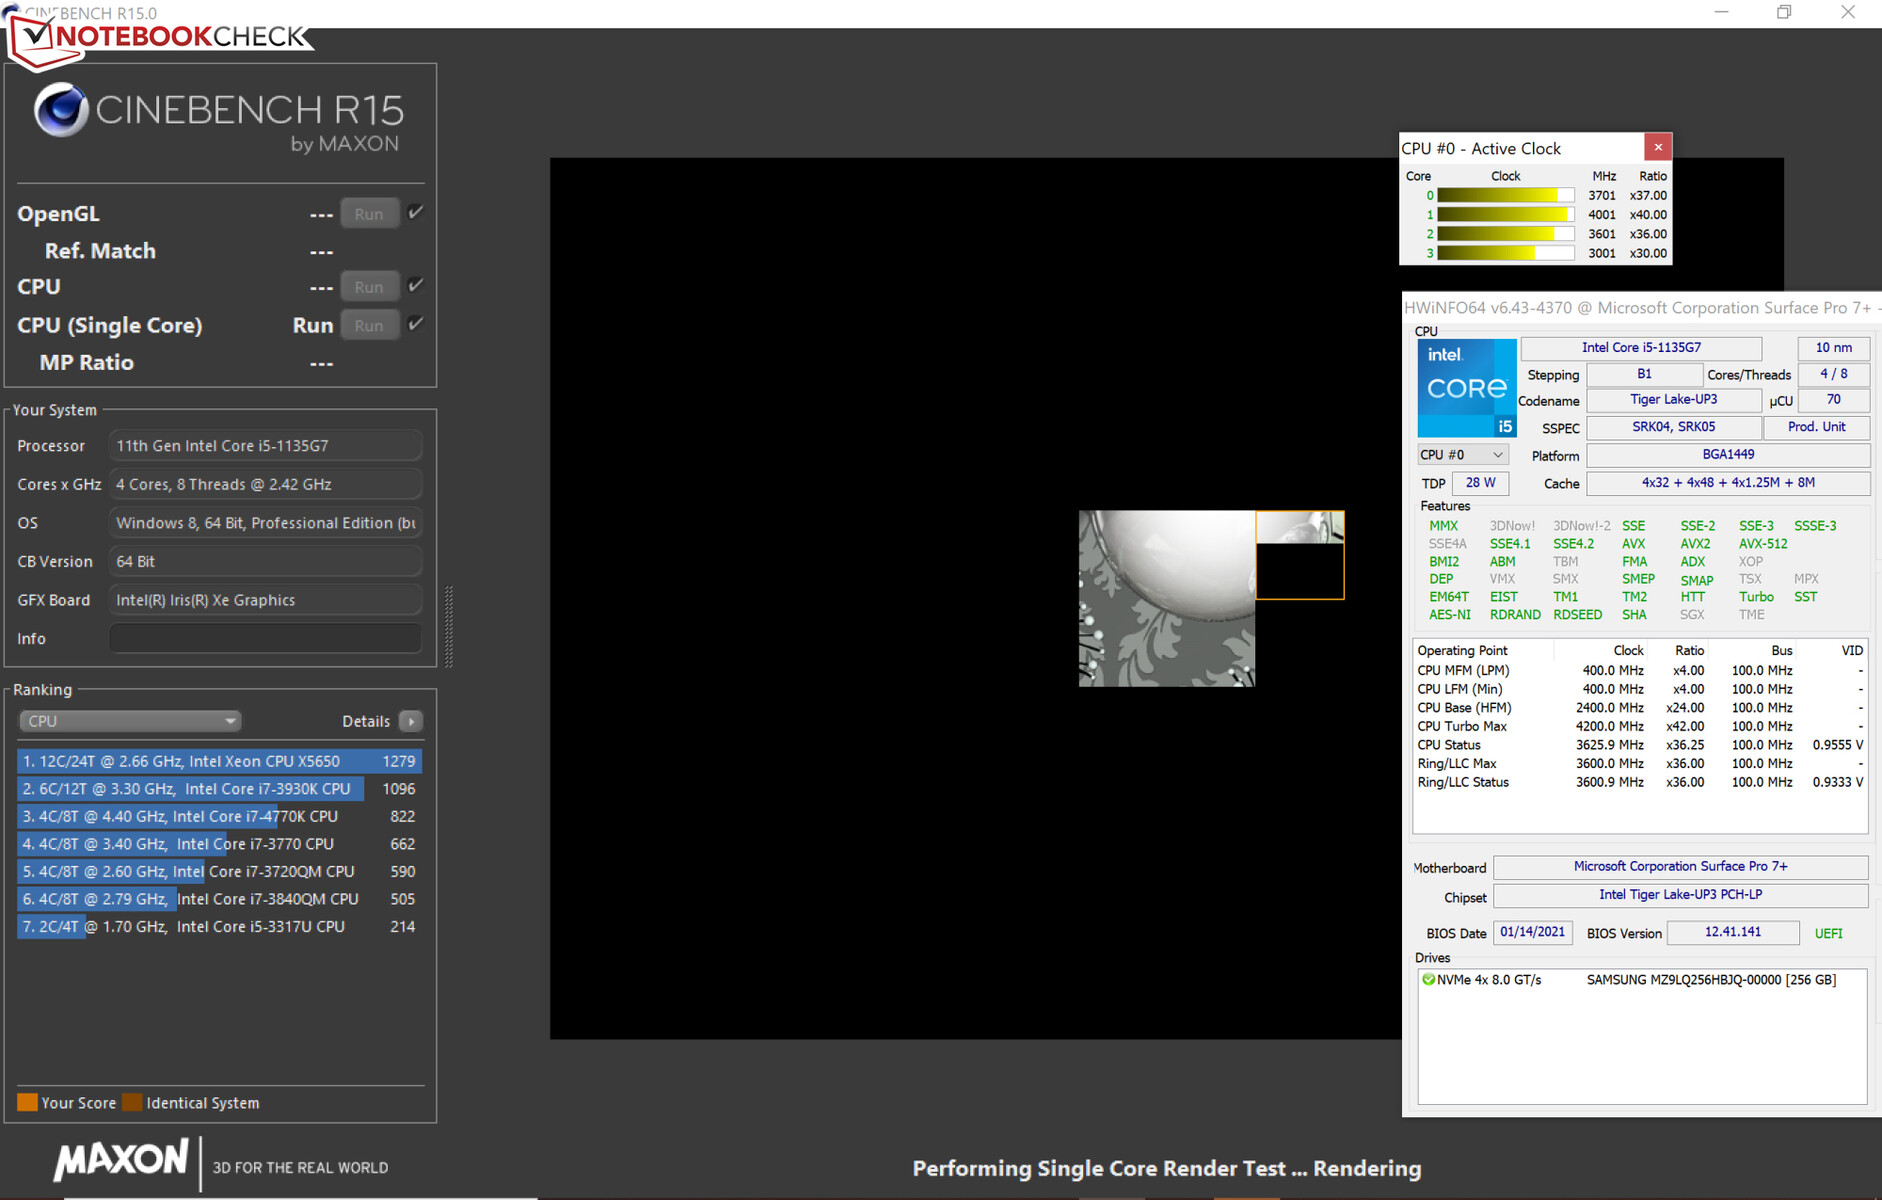
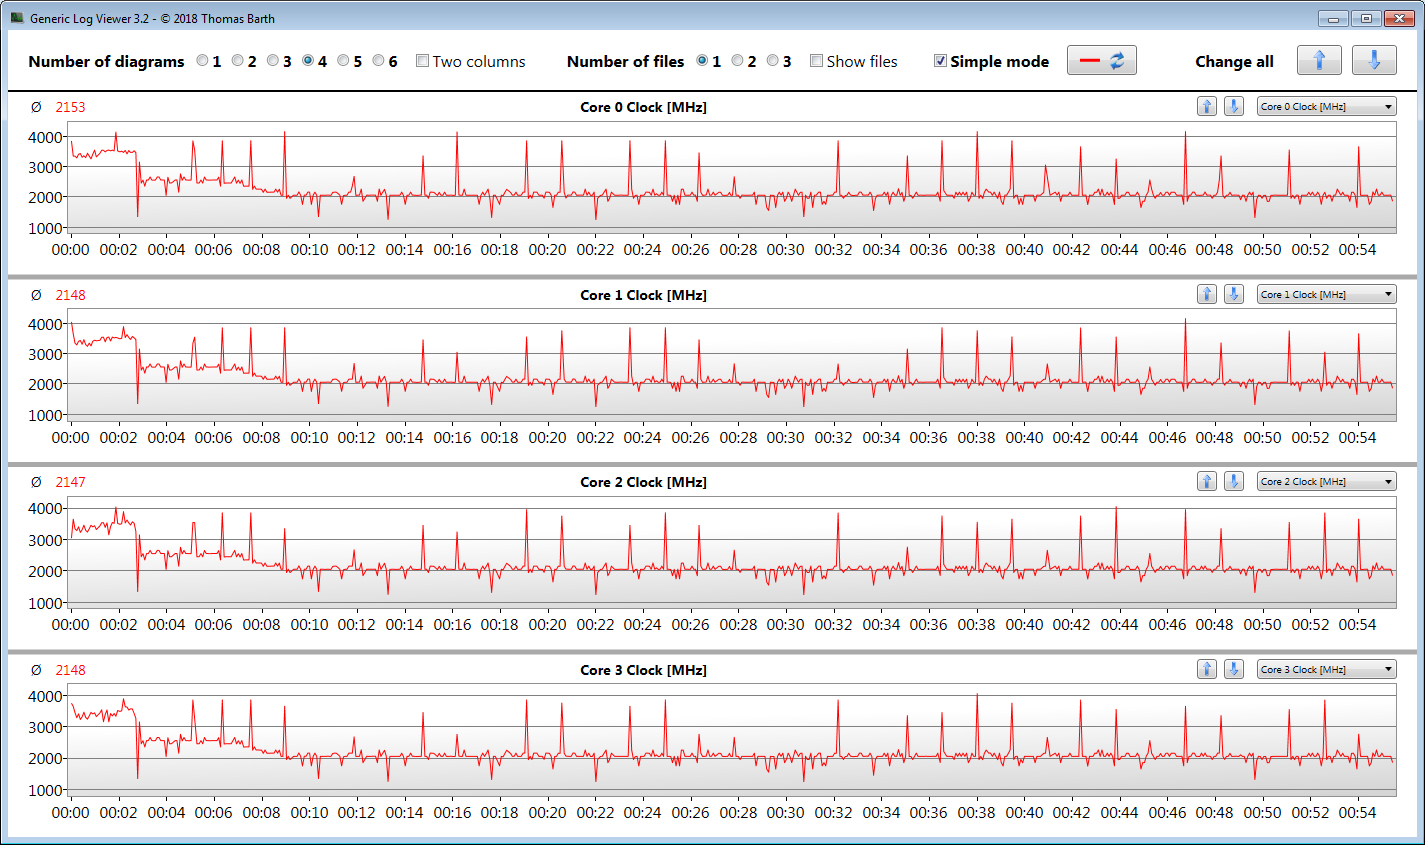
We verify if the CPU Turbo is consistently used when plugged in by running the Cinebench R15 benchmark's multithread test in a continuous loop for at least 30 minutes. Clock rates beyond 3 GHz are only reached in the first three minutes of the test. In the further course, the CPU has to be throttled and falls below its base clock speed - the passive cooling becomes noticeable here.
All in all, the benchmark results are good. The Tiger Lake processor responds to short load peaks with a lot of computing power and outperforms the Ice Lake Core i5 processor in the Surface Pro 7. However, performance is brought to its knees under prolonged load.
* ... smaller is better
System performance
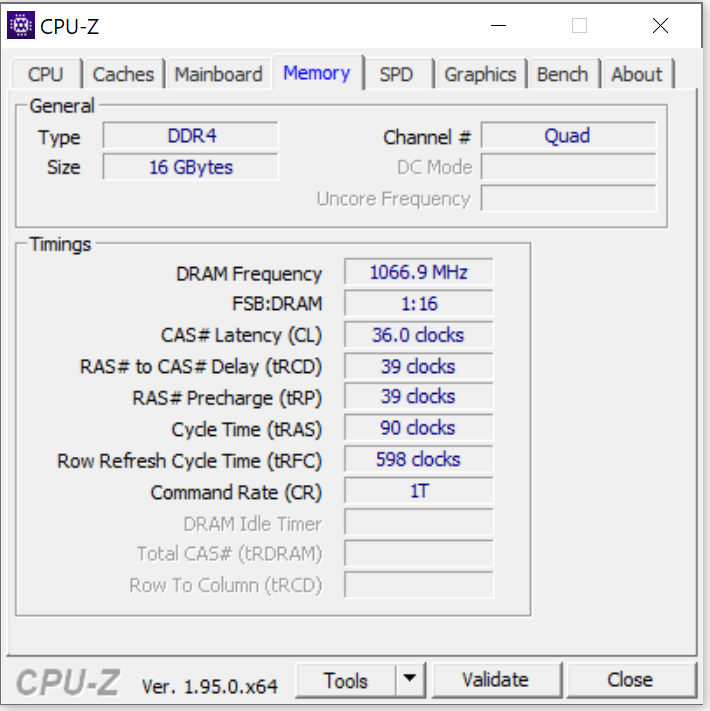
The smooth and fast system didn't cause any problems. It offers more than enough computing power for office and Internet applications. This is complemented by good PCMark results. The 12.3-incher's RAM (16 GB, LPDDR4X, on-board) runs in dual-channel mode. Expanding memory is not possible.
| PCMark 8 Home Score Accelerated v2 | 3472 points | |
| PCMark 8 Creative Score Accelerated v2 | 4157 points | |
| PCMark 8 Work Score Accelerated v2 | 2473 points | |
| PCMark 10 Score | 4026 points | |
Help | ||
DPC latencies
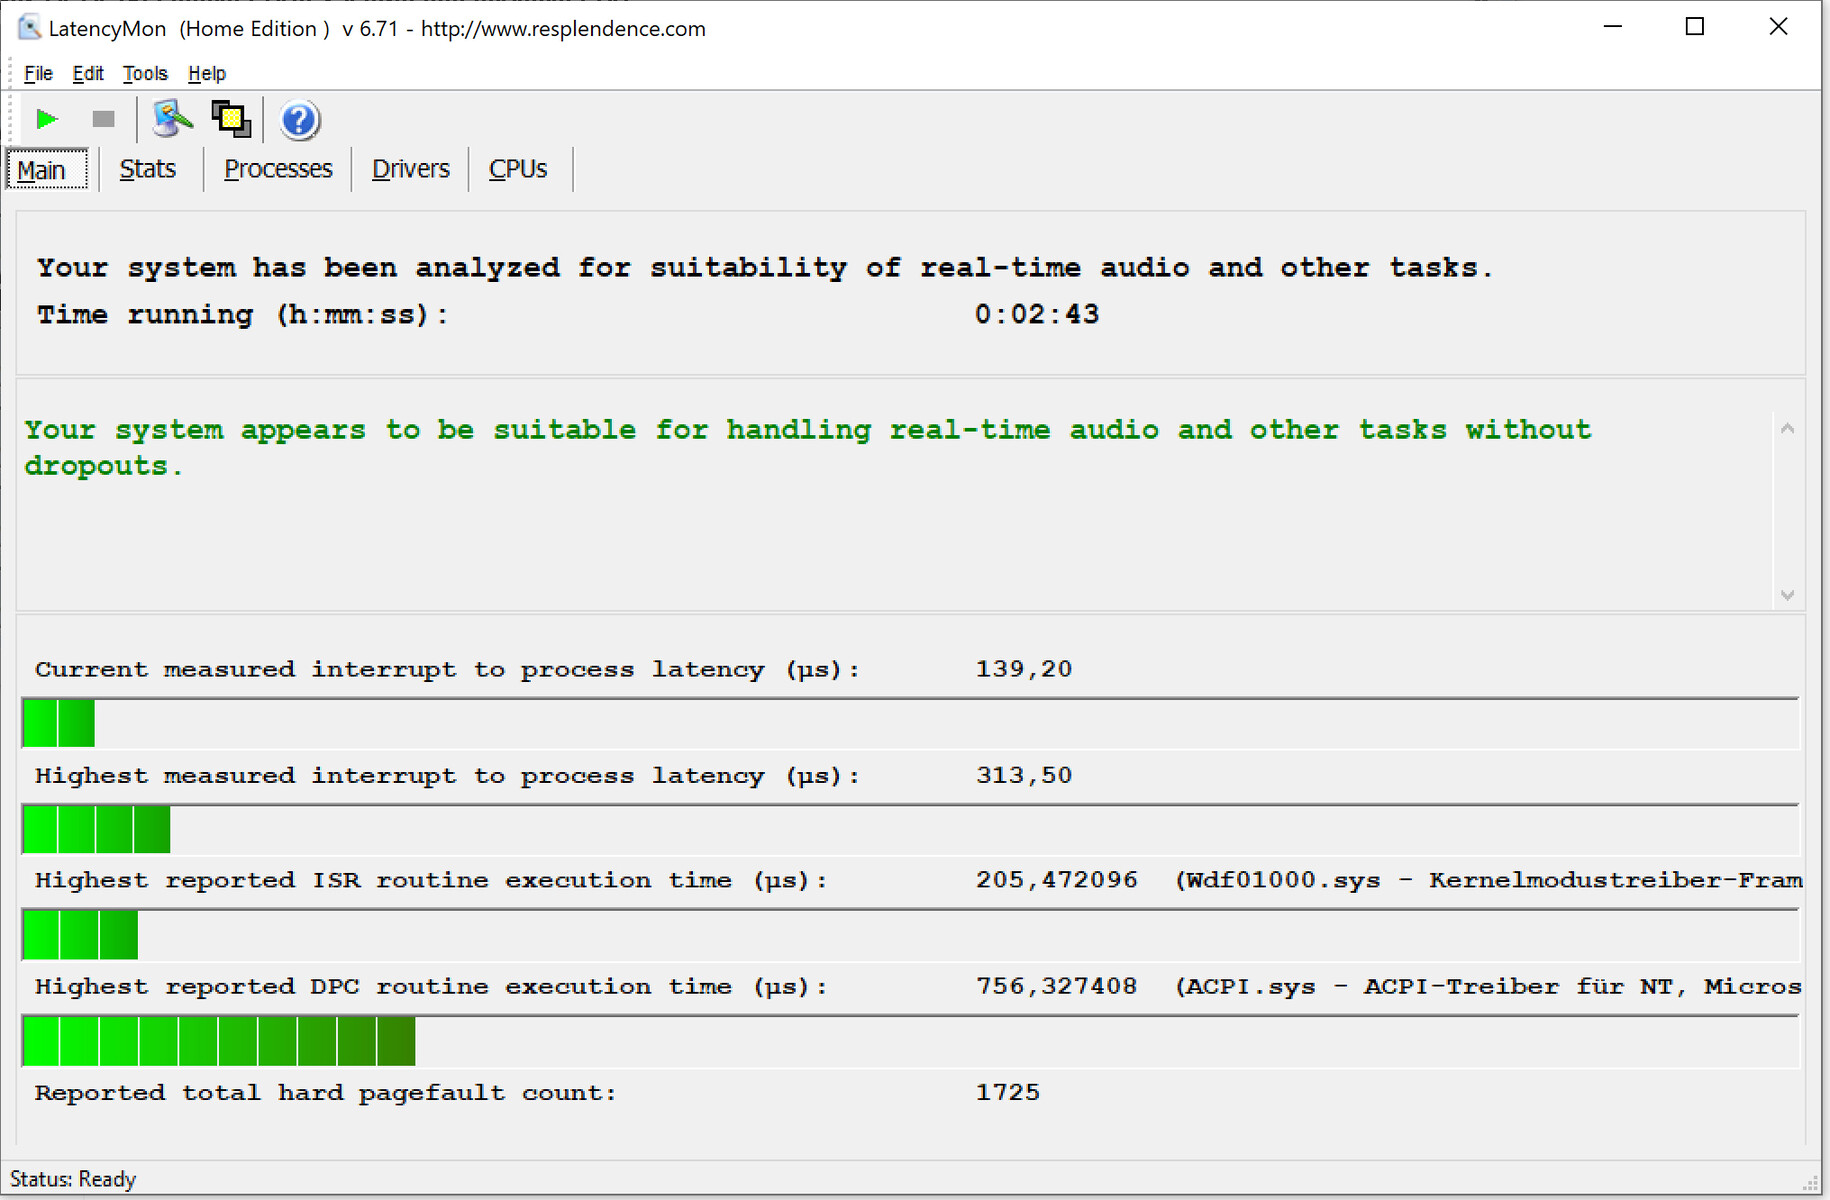
In our standardized latency monitor test (web browsing, 4K video playback, high-load Prime95), we didn't observe any issues with DPC latencies. The system seems to be suitable for real-time video and audio-editing.
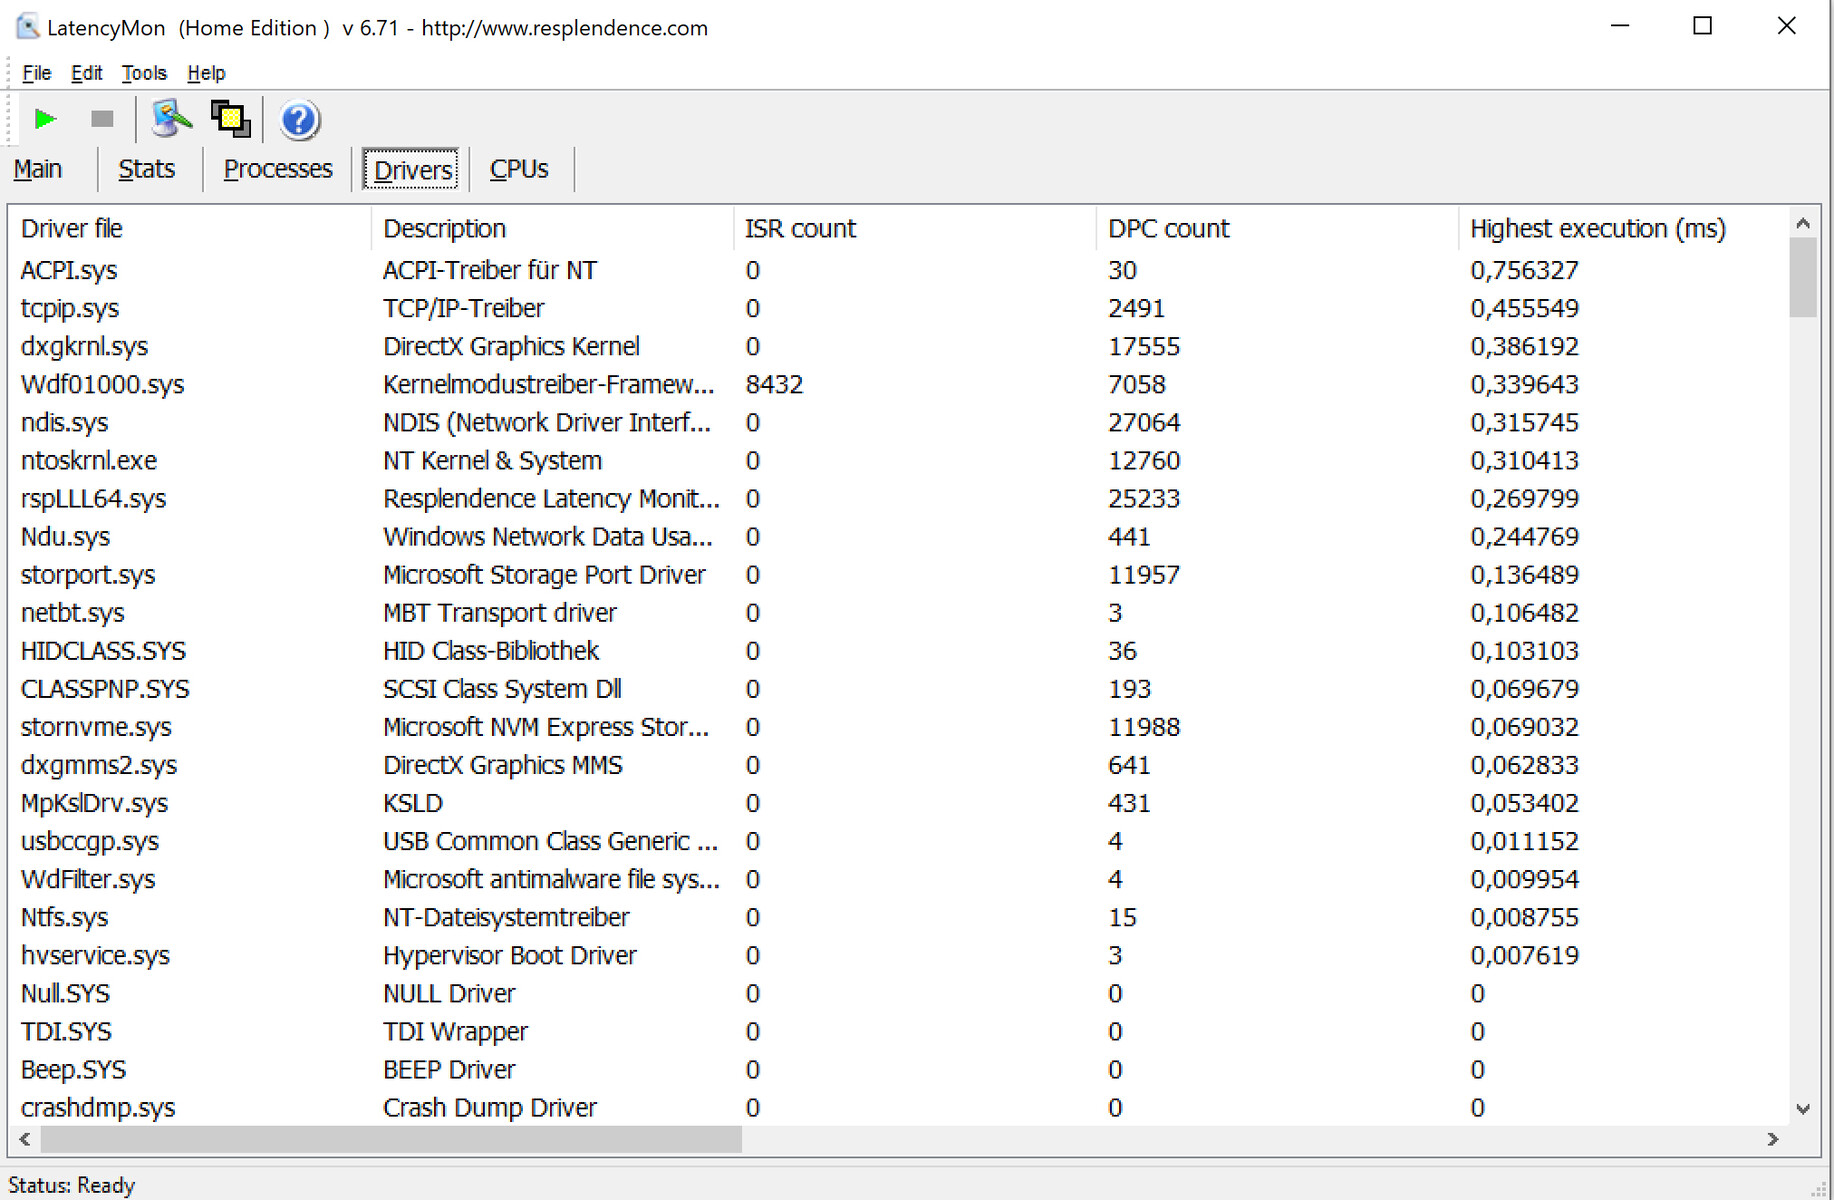
| DPC Latencies / LatencyMon - interrupt to process latency (max), Web, Youtube, Prime95 | |
| Lenovo Yoga Duet 7 13IML05-82AS000WGE | |
| Dell Latitude 12 7210 2-in-1 | |
| Microsoft Surface Pro 7 Plus | |
* ... smaller is better
Storage
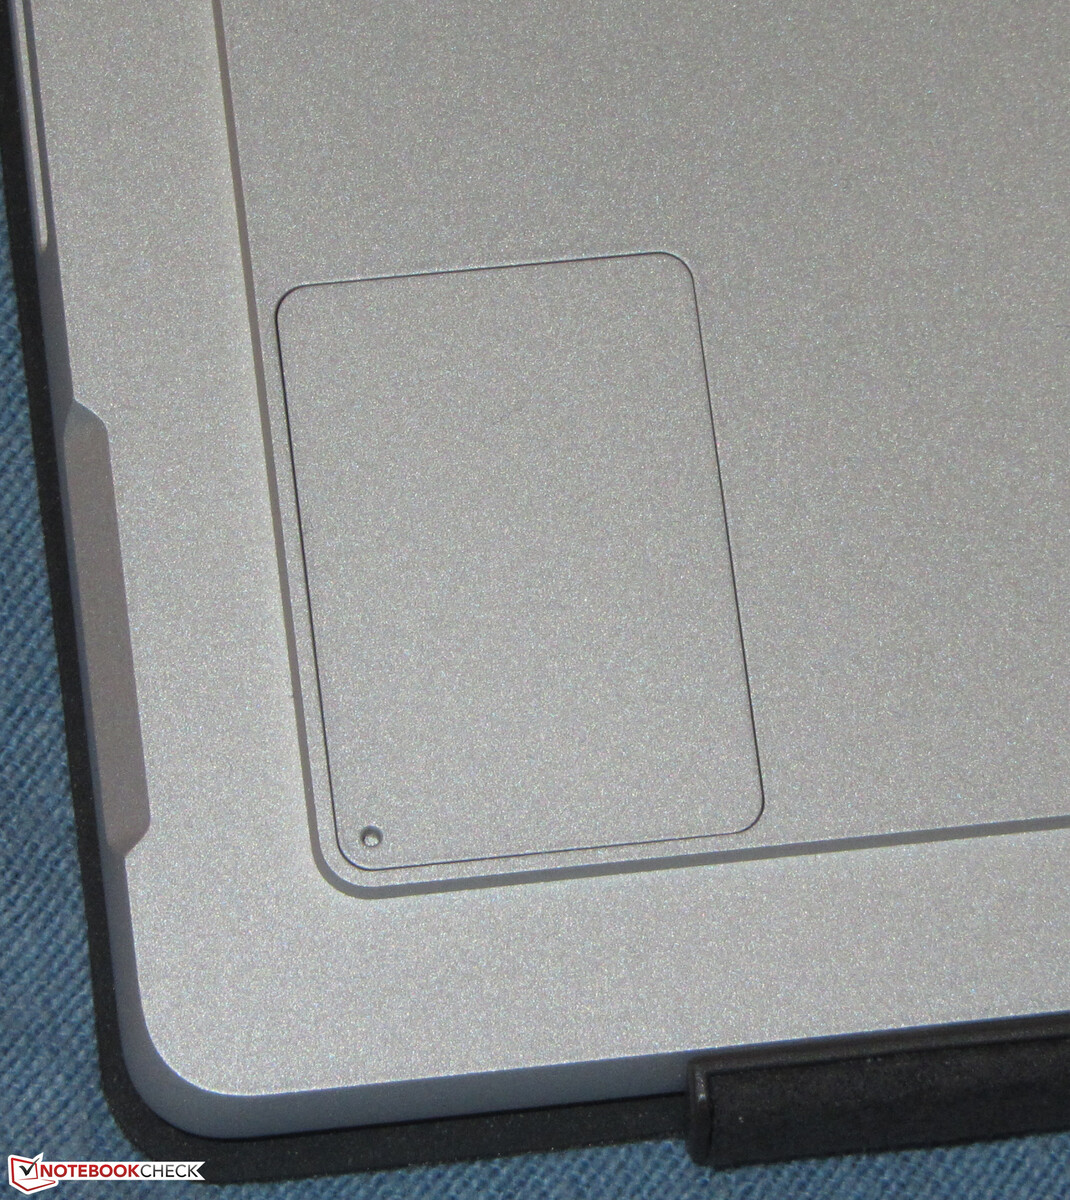
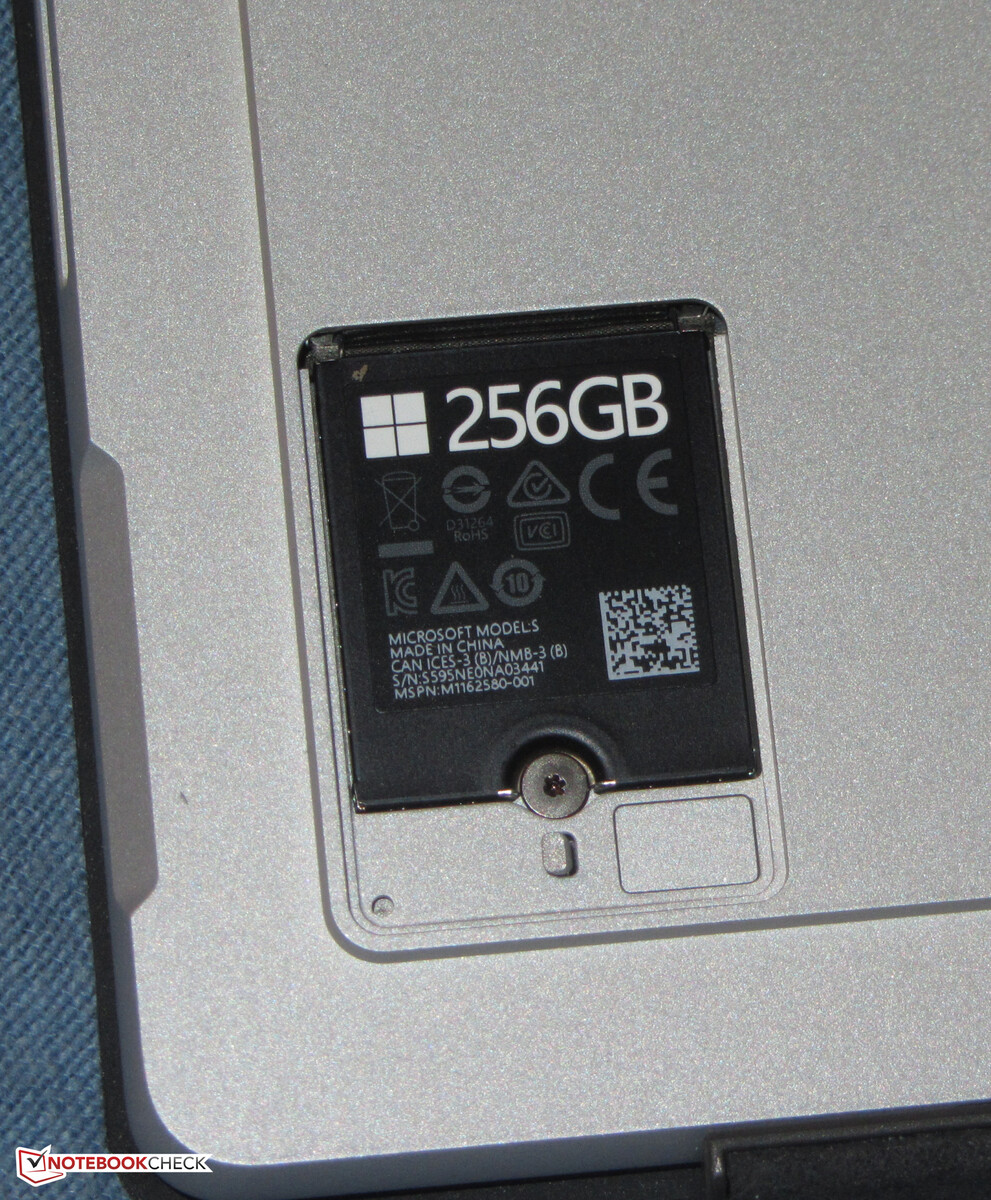
A 256 GB NVMe SSD (M.2-2230) from Samsung serves as system drive, and it delivers good transfer rates. It's not one of the best SSD models, though. Replacing the SSD can be done easily thanks to a small maintenance hatch, but the range of SSDs in the M.2-2230 format is (still) limited. The hatch is held magnetically and can be opened using the included SIM tool or similar equipment.

| Microsoft Surface Pro 7 Plus Samsung PM991 MZ9LQ256HBJQ | Lenovo Yoga Duet 7 13IML05-82AS000WGE Lenovo UMIS RPJTJ256MEE1OWX | Dell Latitude 12 7210 2-in-1 WDC PC SN530 SDBPTPZ-512G | Microsoft Surface Pro 7 Toshiba KBG40ZNS256G NVMe | Microsoft Surface Pro 7 Core i5-1035G4 Toshiba BG4 KBG40ZPZ256G | Average Samsung PM991 MZ9LQ256HBJQ | |
|---|---|---|---|---|---|---|
| CrystalDiskMark 5.2 / 6 | 11% | 25% | 29% | 16% | -10% | |
| Write 4K | 165.3 | 118 -29% | 182.7 11% | 131.3 -21% | 118.5 -28% | 122.1 ? -26% |
| Read 4K | 42.95 | 53 23% | 51.4 20% | 52.4 22% | 54.1 26% | 35.4 ? -18% |
| Write Seq | 955 | 1208 26% | 1303 36% | 1613 69% | 1166 22% | 849 ? -11% |
| Read Seq | 867 | 1625 87% | 1450 67% | 1613 86% | 1676 93% | 854 ? -1% |
| Write 4K Q32T1 | 423.5 | 431 2% | 342.9 -19% | 411.6 -3% | 330.5 -22% | 394 ? -7% |
| Read 4K Q32T1 | 479.2 | 356 -26% | 523 9% | 415.6 -13% | 393.1 -18% | 398 ? -17% |
| Write Seq Q32T1 | 1060 | 1278 21% | 1776 68% | 2340 121% | 1569 48% | 1059 ? 0% |
| Read Seq Q32T1 | 2251 | 1949 -13% | 2378 6% | 1568 -30% | 2390 6% | 2254 ? 0% |
| Write 4K Q8T8 | 410.9 | |||||
| Read 4K Q8T8 | 1033 | |||||
| AS SSD | -9% | 32% | -31% | -169% | -1% | |
| Seq Read | 1725 | 1629 -6% | 2185 27% | 1881 9% | 1590 -8% | 1706 ? -1% |
| Seq Write | 931 | 694 -25% | 1731 86% | 703 -24% | 714 -23% | 803 ? -14% |
| 4K Read | 50.1 | 47.87 -4% | 46.28 -8% | 52.3 4% | 50.7 1% | 45.1 ? -10% |
| 4K Write | 136.9 | 107 -22% | 161.6 18% | 154.1 13% | 109.4 -20% | 123.6 ? -10% |
| 4K-64 Read | 870 | 411 -53% | 1021 17% | 1048 20% | 924 6% | 773 ? -11% |
| 4K-64 Write | 762 | 377 -51% | 1125 48% | 703 -8% | 294.6 -61% | 721 ? -5% |
| Access Time Read * | 0.279 | 0.068 76% | 0.069 75% | 0.069 75% | 0.066 76% | 0.229 ? 18% |
| Access Time Write * | 0.028 | 0.035 -25% | 0.046 -64% | 0.221 -689% | 0.697 -2389% | 0.0315 ? -13% |
| Score Read | 1093 | 614 -44% | 1286 18% | 1288 18% | 1133 4% | 989 ? -10% |
| Score Write | 992 | 550 -45% | 1460 47% | 927 -7% | 475 -52% | 925 ? -7% |
| Score Total | 2616 | 1441 -45% | 3389 30% | 2826 8% | 2157 -18% | 2386 ? -9% |
| Copy ISO MB/s | 1174 | 1074 -9% | 1555 32% | 1160 -1% | 1177 0% | 1085 ? -8% |
| Copy Program MB/s | 262.8 | 532 102% | 468.5 78% | 454.7 73% | 406 54% | 389 ? 48% |
| Copy Game MB/s | 562 | 730 30% | 841 50% | 991 76% | 923 64% | 687 ? 22% |
| Total Average (Program / Settings) | 1% /
-1% | 29% /
30% | -1% /
-9% | -77% /
-102% | -6% /
-4% |
* ... smaller is better
Continuous load read: DiskSpd Read Loop, Queue Depth 8
Graphics card
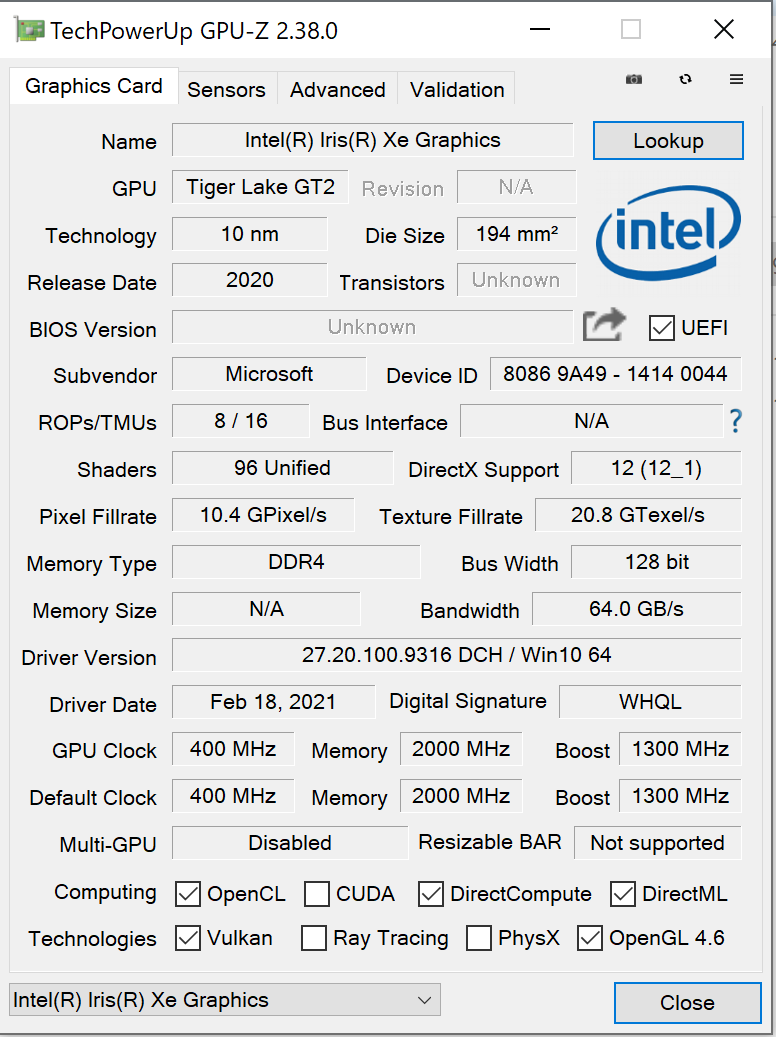
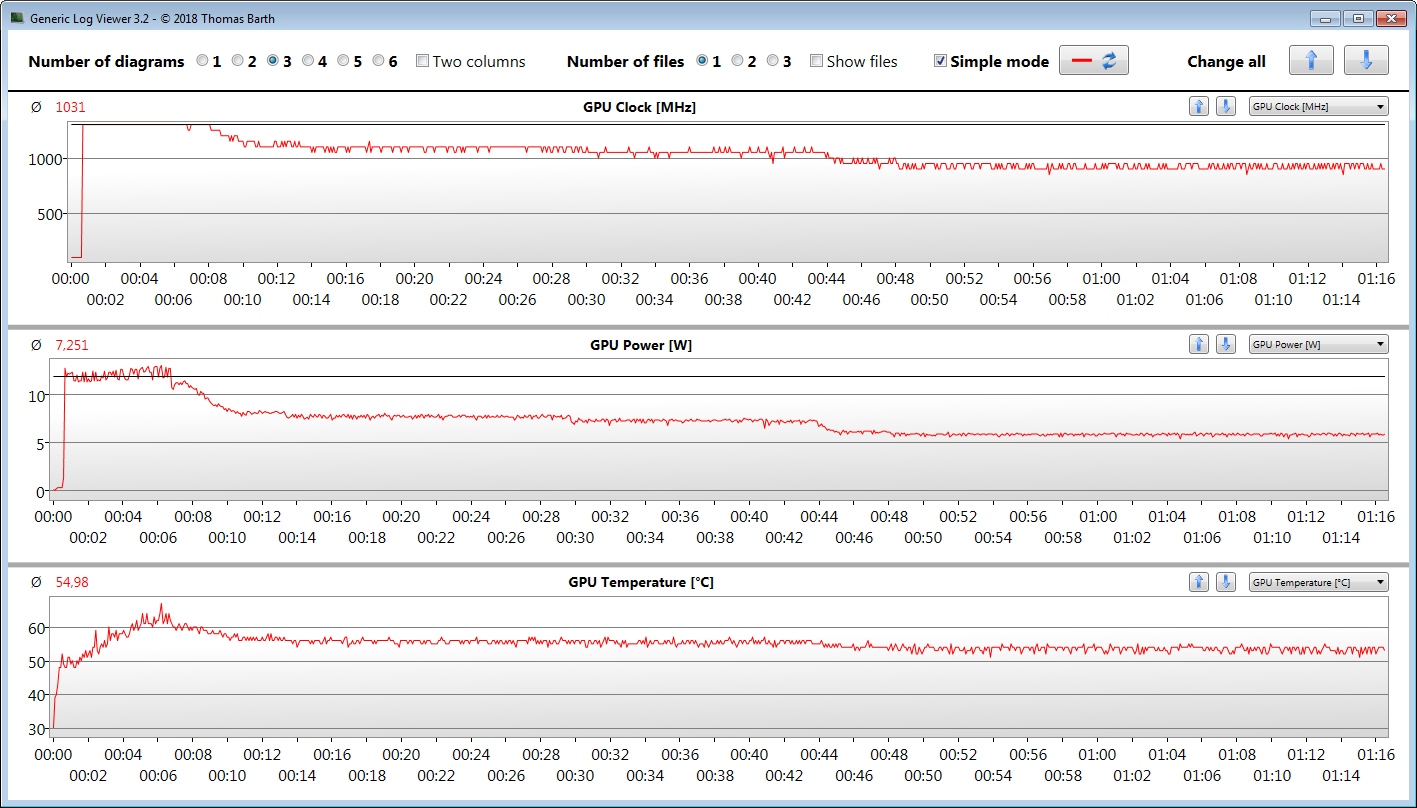
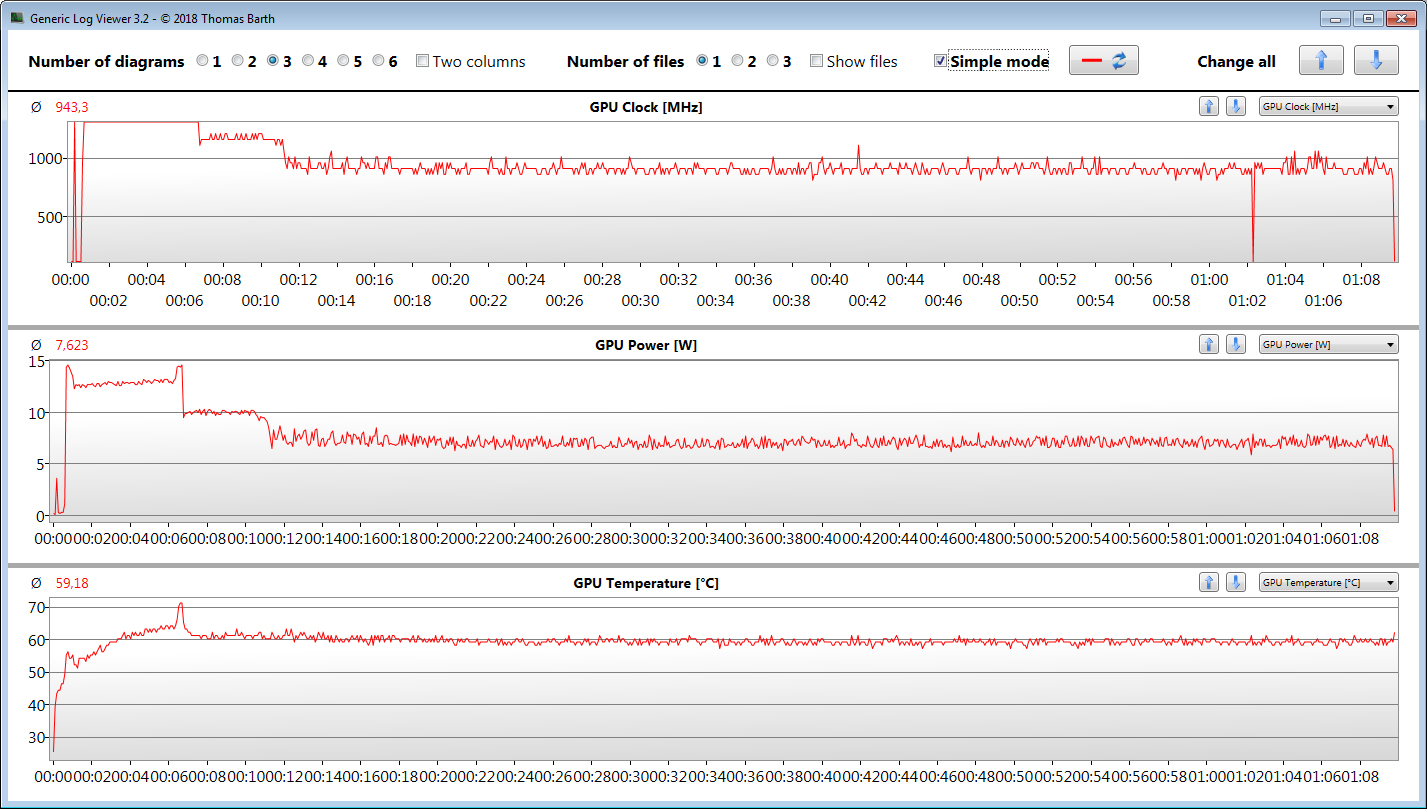
Intel's integrated Iris Xe Graphics G7 80EUs GPU is responsible for graphics output. It supports DirectX 12 and reaches an operating clock speed of up to 1,300 MHz. The Witcher 3 test shows that the Tiger Lake GPU can work at full speed for about seven minutes. Afterwards, the passive cooling takes its toll.
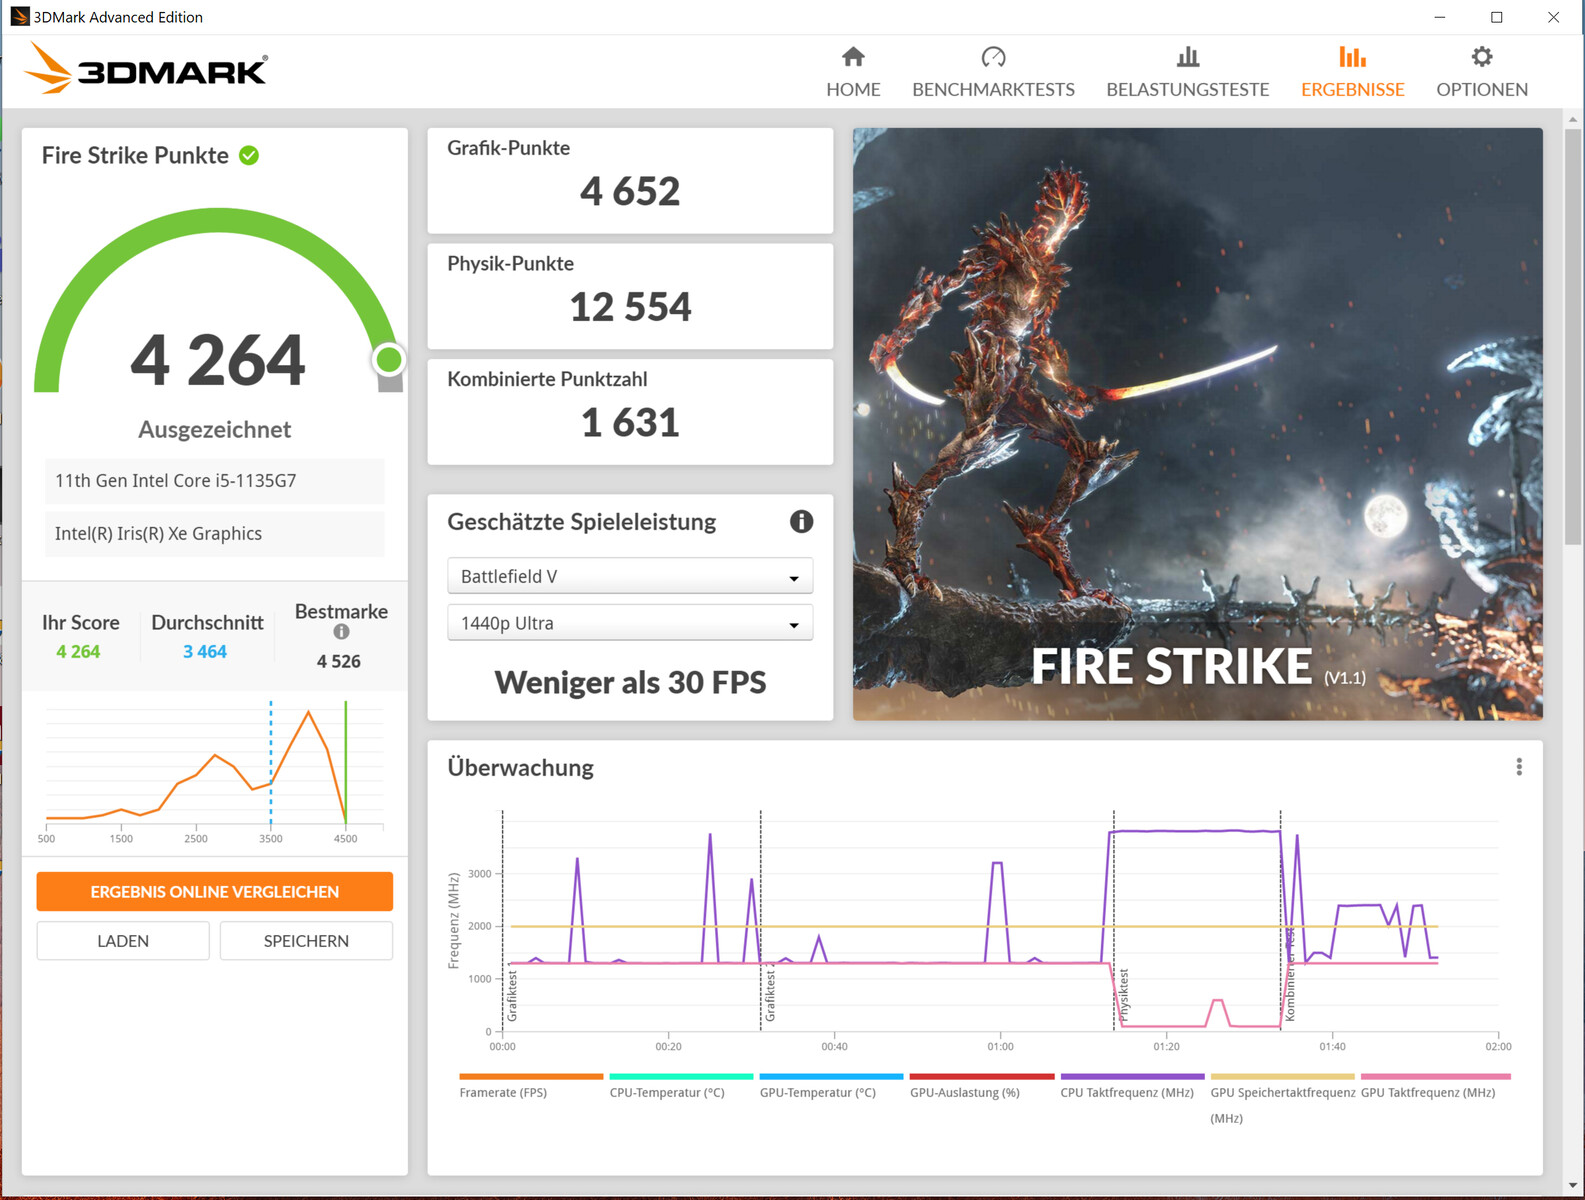
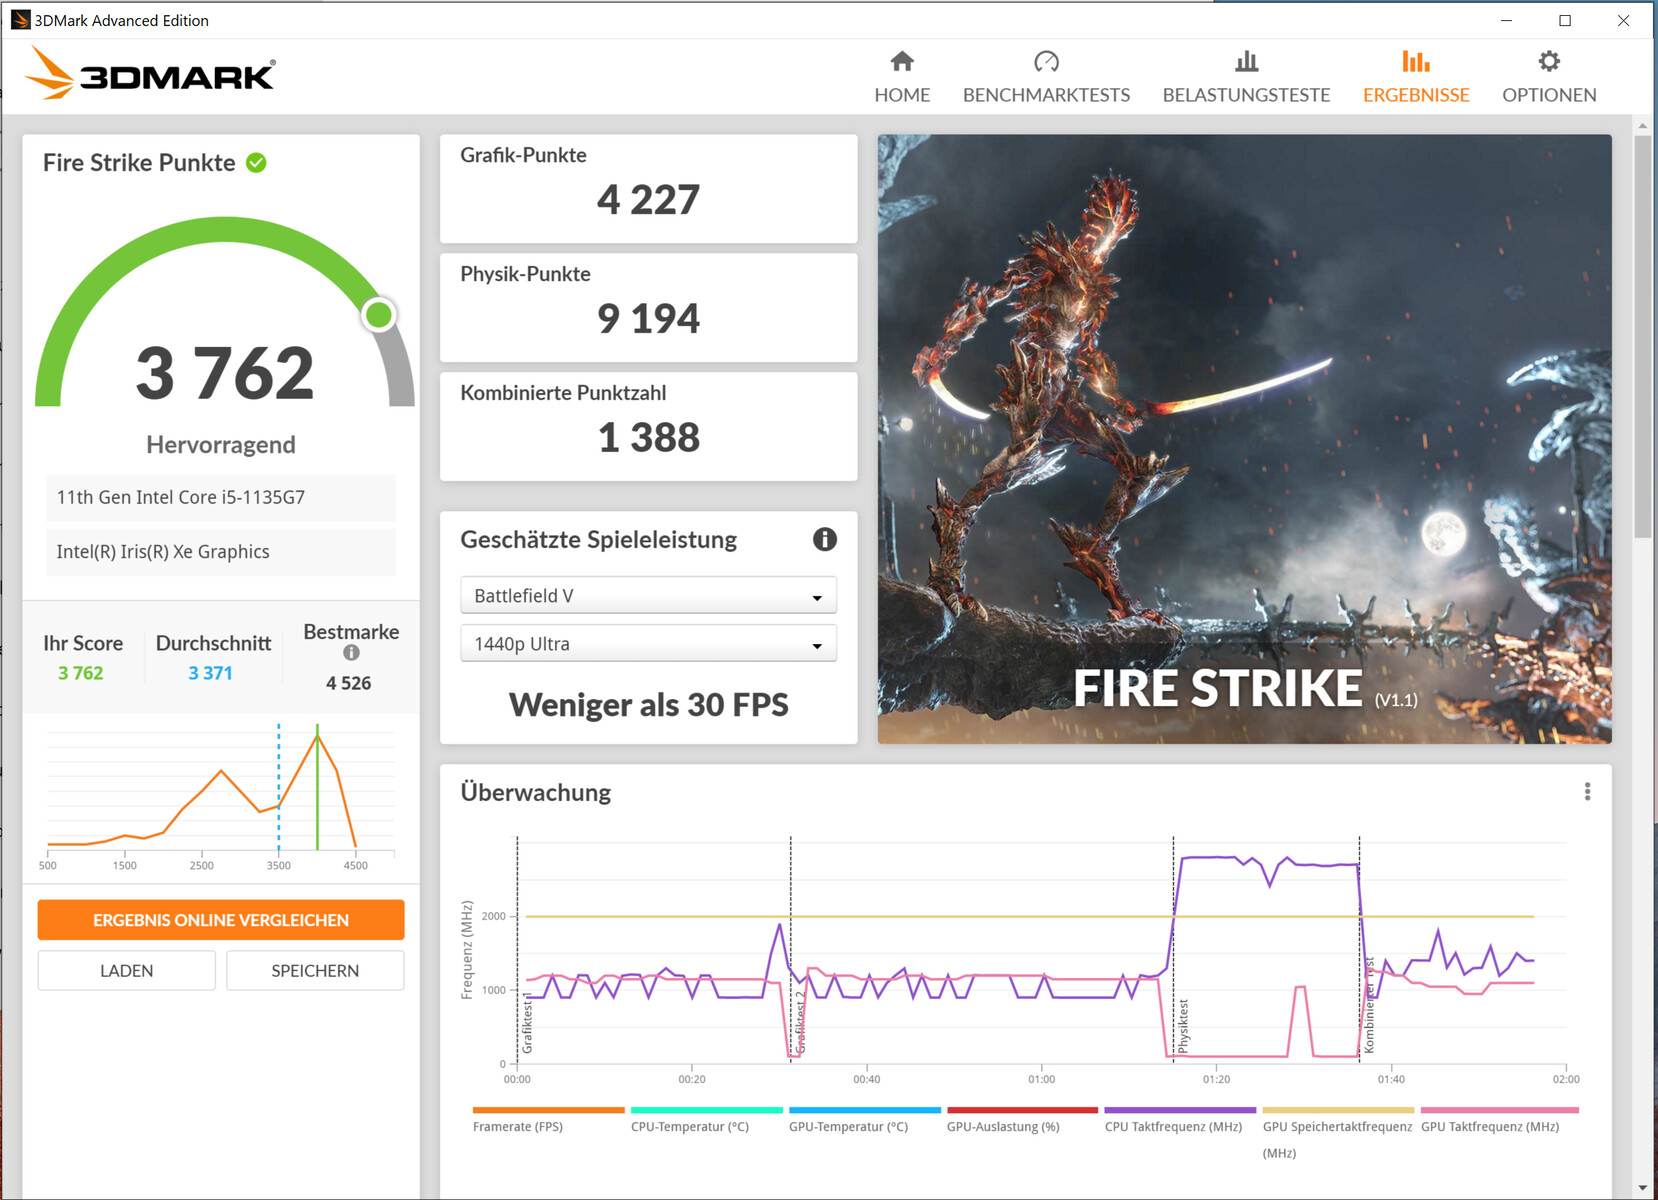
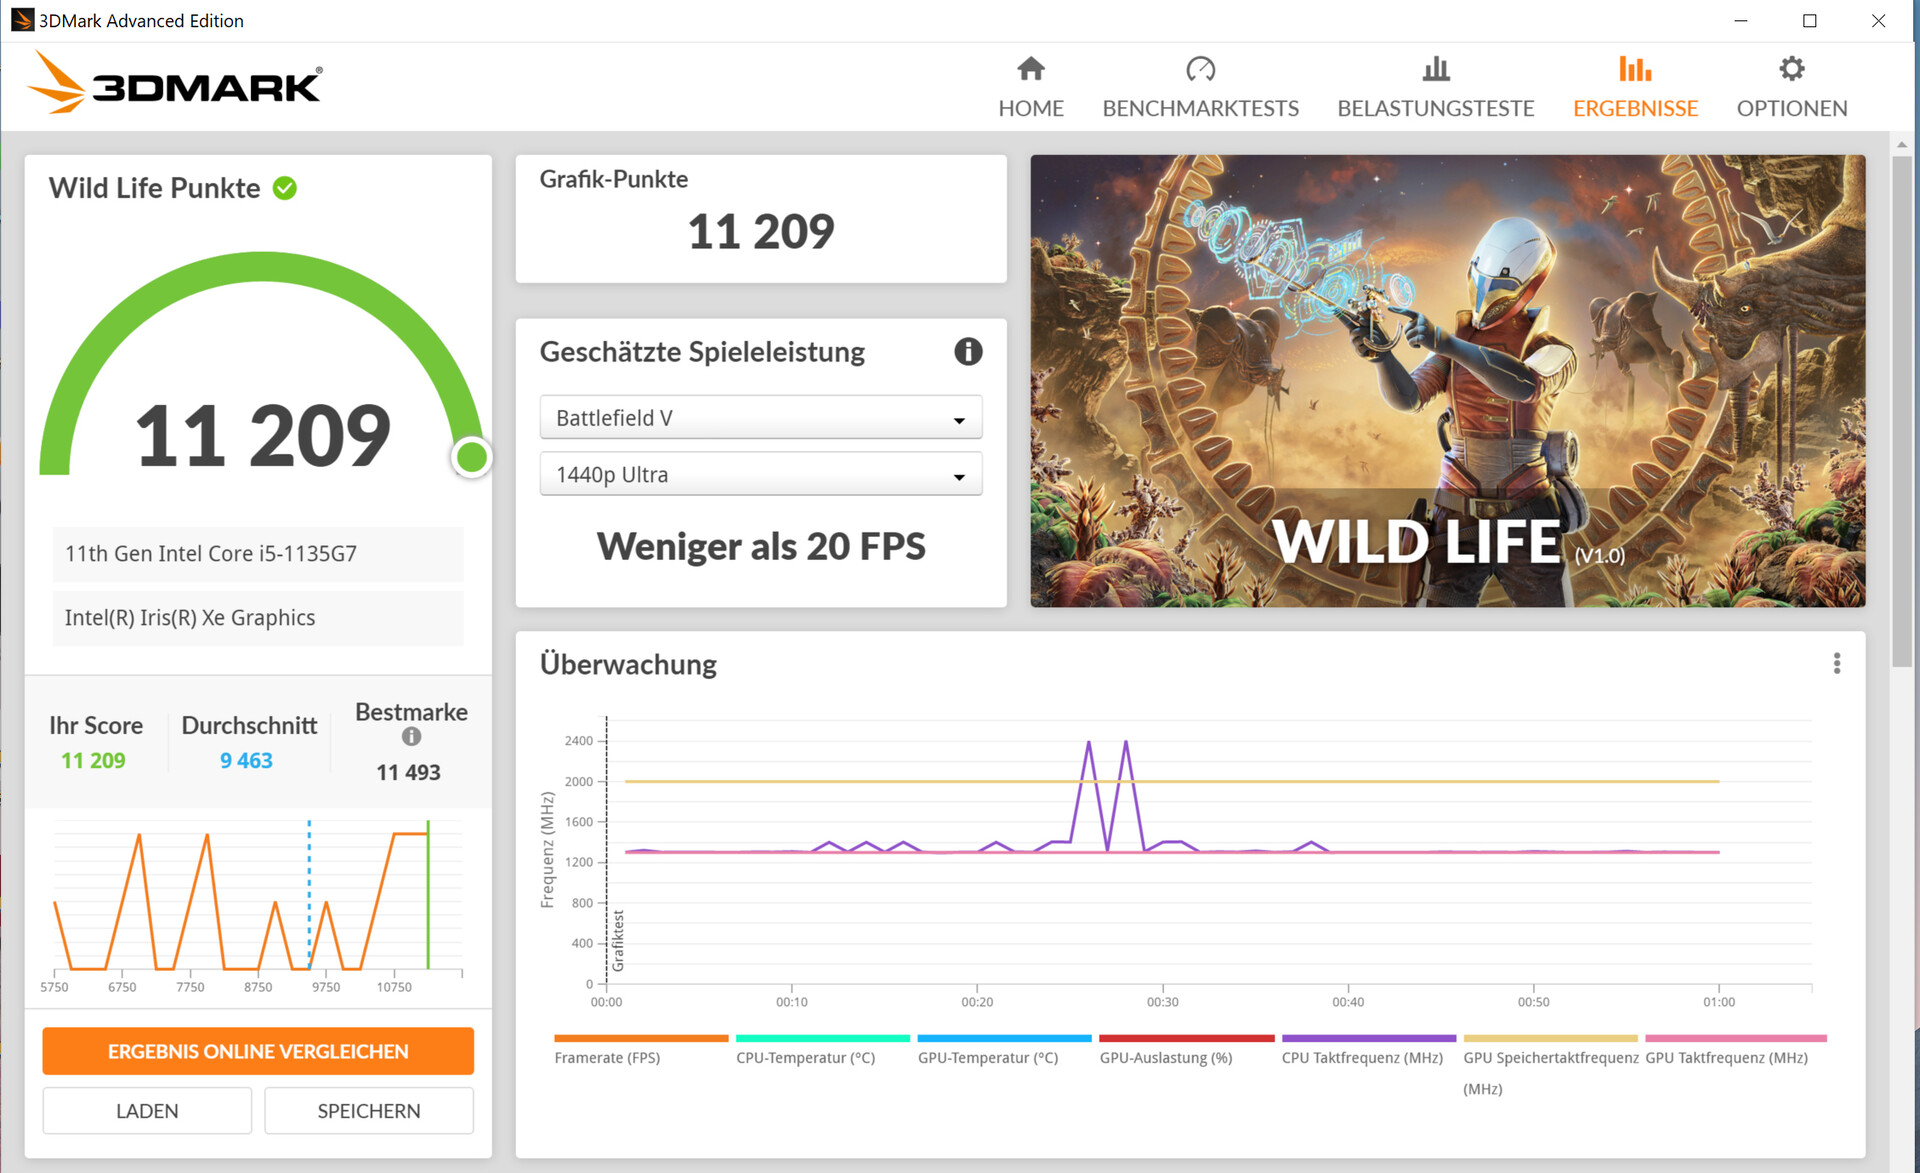
The 3DMark results are among the best values that we have determined for the GPU installed here so far. Compared to the Ice Lake Surface Pro 7 models, there is a significant increase in graphics performance.
| 3DMark 11 Performance | 6343 points | |
| 3DMark Ice Storm Standard Score | 81444 points | |
| 3DMark Cloud Gate Standard Score | 17777 points | |
| 3DMark Fire Strike Score | 4264 points | |
| 3DMark Time Spy Score | 1537 points | |
Help | ||
| GFXBench (DX / GLBenchmark) 2.7 | |
| 1920x1080 T-Rex Offscreen | |
| Microsoft Surface Pro 7 Plus | |
| Average Intel Iris Xe Graphics G7 80EUs (253 - 257, n=2) | |
| T-Rex Onscreen | |
| Microsoft Surface Pro 7 Plus | |
| Average Intel Iris Xe Graphics G7 80EUs (55 - 157.5, n=2) | |
| GFXBench 3.0 | |
| 1920x1080 1080p Manhattan Offscreen | |
| Microsoft Surface Pro 7 Plus | |
| Average Intel Iris Xe Graphics G7 80EUs (148 - 170.4, n=2) | |
| Average of class Convertible (last 2 years) | |
| on screen Manhattan Onscreen OGL | |
| Microsoft Surface Pro 7 Plus | |
| Average Intel Iris Xe Graphics G7 80EUs (44 - 86.6, n=2) | |
| Average of class Convertible (last 2 years) | |
| GFXBench 3.1 | |
| 1920x1080 Manhattan ES 3.1 Offscreen | |
| Average of class Convertible (last 2 years) | |
| Microsoft Surface Pro 7 Plus | |
| Average Intel Iris Xe Graphics G7 80EUs (69 - 108.6, n=2) | |
| on screen Manhattan ES 3.1 Onscreen | |
| Average of class Convertible (last 2 years) | |
| Average Intel Iris Xe Graphics G7 80EUs (46.5 - 58, n=2) | |
| Microsoft Surface Pro 7 Plus | |
| Unigine Heaven 2.1 - 1280x1024 high, Tesselation (normal), DirectX11 AA:off AF:1x | |
| Microsoft Surface Pro 7 Plus | |
| Average Intel Iris Xe Graphics G7 80EUs () | |
| Unigine Heaven 3.0 | |
| 1920x1080 OpenGL, Normal Tessellation, High Shaders AA:Off AF:Off | |
| Microsoft Surface Pro 7 Plus | |
| Average Intel Iris Xe Graphics G7 80EUs () | |
| 1920x1080 DX 11, Normal Tessellation, High Shaders AA:Off AF:Off | |
| Microsoft Surface Pro 7 Plus | |
| Average Intel Iris Xe Graphics G7 80EUs () | |
| Unigine Superposition | |
| 1920x1080 1080p High | |
| Average of class Convertible (last 2 years) | |
| Average Intel Iris Xe Graphics G7 80EUs (1907 - 2216, n=2) | |
| Microsoft Surface Pro 7 Plus | |
| 1280x720 720p Low | |
| Average of class Convertible (last 2 years) | |
| Average Intel Iris Xe Graphics G7 80EUs (6057 - 6928, n=2) | |
| Microsoft Surface Pro 7 Plus | |
| Unigine Valley 1.0 | |
| 1920x1080 Extreme HD DirectX AA:x8 | |
| Average of class Convertible (20.7 - 25, n=2, last 2 years) | |
| Microsoft Surface Pro 7 Plus | |
| Average Intel Iris Xe Graphics G7 80EUs (14.6 - 17.4, n=4) | |
| 1920x1080 Extreme HD Preset OpenGL AA:x8 | |
| Average of class Convertible (19.7 - 21.7, n=2, last 2 years) | |
| Microsoft Surface Pro 7 Plus | |
| Average Intel Iris Xe Graphics G7 80EUs (14.1 - 18.8, n=4) | |
Gaming performance
The Surface Pro 7 Plus is not a gaming device. Nevertheless: The installed CPU-GPU combination is generally capable of bringing many of the games in our database smoothly onto the screen - at low resolutions and low quality settings.
Since the CPU and GPU are throttled after a few minutes, the frame rates drop as a result. Therefore, we recommend titles that don't have excessively high hardware requirements and still run smoothly even at lower clock speeds.
| The Witcher 3 - 1024x768 Low Graphics & Postprocessing | |
| Average of class Convertible (35 - 354, n=58, last 2 years) | |
| Microsoft Surface Pro 7 Plus | |
| Average Intel Iris Xe Graphics G7 80EUs (30.2 - 97.4, n=99) | |
| Microsoft Surface Pro 7 Core i5-1035G4 | |
| Lenovo Yoga Duet 7 13IML05-82AS000WGE | |
| Shadow of the Tomb Raider - 1280x720 Lowest Preset | |
| Average of class Convertible (last 2 years) | |
| Average Intel Iris Xe Graphics G7 80EUs (31 - 62.8, n=6) | |
| Microsoft Surface Pro 7 Plus | |
| Microsoft Surface Pro 7 | |
| Microsoft Surface Pro 7 Core i5-1035G4 | |
| F1 2020 - 1280x720 Ultra Low Preset | |
| Average of class Convertible (last 2 years) | |
| Microsoft Surface Pro 7 Plus | |
| Average Intel Iris Xe Graphics G7 80EUs (45 - 76.6, n=10) | |
| Serious Sam 4 - 1280x720 Lowest (DX12) | |
| Microsoft Surface Pro 7 Plus | |
| Average Intel Iris Xe Graphics G7 80EUs () | |
| Hitman 3 - 1280x720 Minimum Settings | |
| Average of class Convertible (last 2 years) | |
| Microsoft Surface Pro 7 Plus | |
| Average Intel Iris Xe Graphics G7 80EUs (56.3 - 82.3, n=2) | |
In order to verify whether the frame rates remain largely constant over a prolonged period of time, we let the game The Witcher 3 run for about 60 minutes at Full HD resolution and maximum quality settings. The character is not moved. The GPU clock speed is throttled from 1,300 MHz to about 1,000 MHz after approximately seven minutes. Consequently, there is a drop in frame rates.
Since no playable frame rates are achieved, we repeated our The Witcher 3 test at minimum settings. The same behavior is seen, but frame rates are still within a playable range even after throttling takes place.
| low | med. | high | ultra | |
| The Witcher 3 (2015) | 81.9 | 55.8 | 29 | 13.5 |
| Dota 2 Reborn (2015) | 80.4 | 60.5 | 38.7 | 36.8 |
| X-Plane 11.11 (2018) | 37.4 | 29.9 | 27.7 | |
| Far Cry 5 (2018) | 54 | 23 | 21 | 19 |
| Shadow of the Tomb Raider (2018) | 37 | 17 | 14 | 9 |
| Battlefield V (2018) | 51.7 | 25.8 | 23.3 | 22.6 |
| Apex Legends (2019) | 82 | 37.7 | 28.2 | 25.3 |
| Metro Exodus (2019) | 28 | 13.7 | 10.5 | 8.7 |
| Control (2019) | 57.9 | 17.3 | 11.6 | |
| Borderlands 3 (2019) | 46.6 | 20.6 | 12.6 | 9.34 |
| Red Dead Redemption 2 (2019) | 49.2 | 22.7 | 12.9 | |
| F1 2020 (2020) | 76.6 | 38.7 | 26.8 | 17.5 |
| Death Stranding (2020) | 42.2 | 23.4 | 20.7 | 19.8 |
| Crysis Remastered (2020) | 54.9 | 24.9 | 8.49 | |
| Serious Sam 4 (2020) | 99.4 | 14.6 | 10.1 | 6.67 |
| Assassin´s Creed Valhalla (2020) | 31 | 19 | 16 | |
| Yakuza Like a Dragon (2020) | 32.5 | 16.3 | 14.6 | 12.4 |
| Immortals Fenyx Rising (2020) | 36 | 22 | 19 | 17 |
| Cyberpunk 2077 1.0 (2020) | 23.8 | 10.5 | ||
| Hitman 3 (2021) | 82.3 | 35.2 | 28.5 | 23.9 |
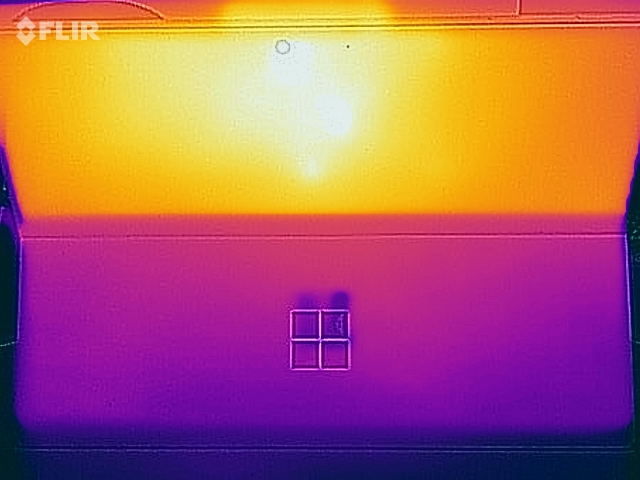
Emissions - Microsoft's 2-in-1 device is cooled passively
Noise emissions
The device has no fan and no mechanical drive. Nevertheless, it's not completely silent. Occasionally, an electronic rattling sound can be heard coming from the inside.
Temperature
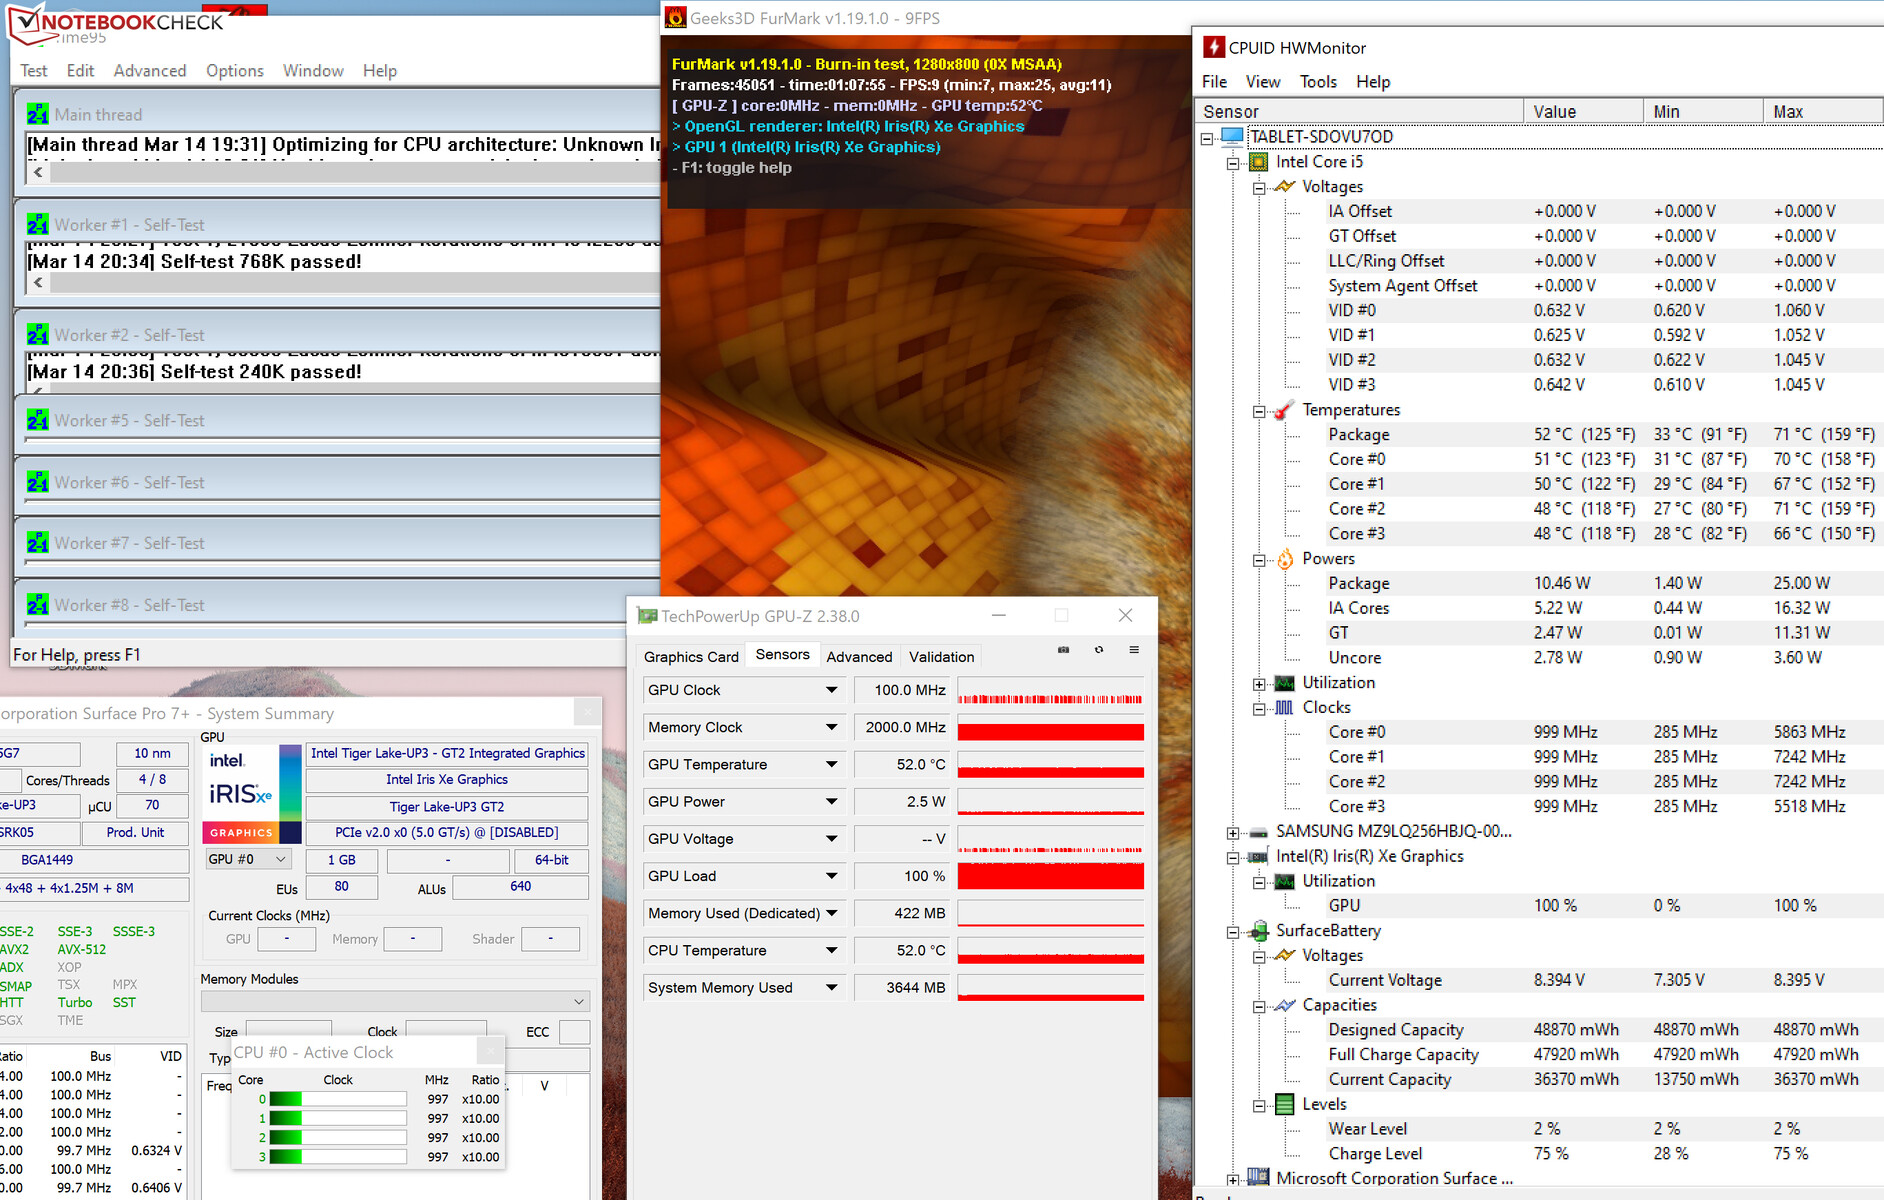
In the first few minutes of our stress test (Prime95 and FurMark run for at least an hour), the CPU and GPU run at 900 to 2,000 MHz and 700 to 750 MHz, respectively. In the further course of the test, the speeds drop to 900 to 1,000 MHz (CPU) and 100 MHz (GPU). The stress test represents an extreme scenario, though. We use this test to verify that the system remains stable even under full load.
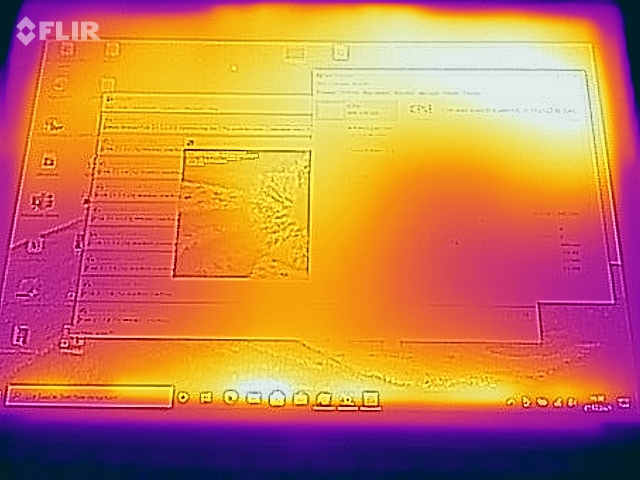
It's not surprising that the Surface heats up noticeably under load. After all, the device is cooled passively. During the stress test, we register temperatures in the lower to mid 40 °C (~104 °F) range at several measuring points. Furthermore, the rates are within the green range in everyday use.
(±) The maximum temperature on the upper side is 42.9 °C / 109 F, compared to the average of 35.3 °C / 96 F, ranging from 19.6 to 55.7 °C for the class Convertible.
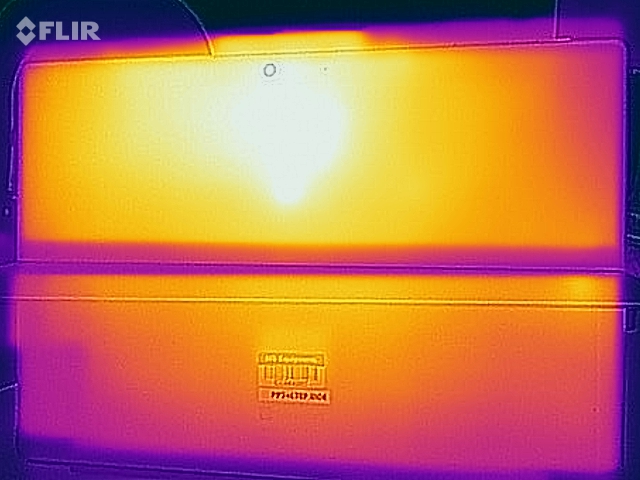
(±) The bottom heats up to a maximum of 44.8 °C / 113 F, compared to the average of 36.7 °C / 98 F
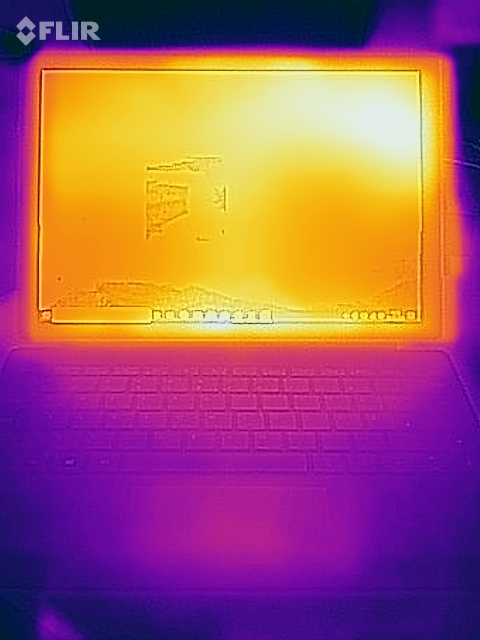
(+) In idle usage, the average temperature for the upper side is 25.3 °C / 78 F, compared to the device average of 30.2 °C / 86 F.
(-) The palmrests and touchpad can get very hot to the touch with a maximum of 41.1 °C / 106 F.
(-) The average temperature of the palmrest area of similar devices was 28.1 °C / 82.6 F (-13 °C / -23.4 F).
| Microsoft Surface Pro 7 Plus i5-1135G7, Iris Xe G7 80EUs | Lenovo Yoga Duet 7 13IML05-82AS000WGE i5-10210U, UHD Graphics 620 | Dell Latitude 12 7210 2-in-1 i7-10610U, UHD Graphics 620 | Microsoft Surface Pro 7 i7-1065G7, Iris Plus Graphics G7 (Ice Lake 64 EU) | Microsoft Surface Pro 7 Core i5-1035G4 i5-1035G4, Iris Plus Graphics G4 (Ice Lake 48 EU) | Average Intel Iris Xe Graphics G7 80EUs | Average of class Convertible | |
|---|---|---|---|---|---|---|---|
| Heat | 16% | 12% | -2% | -12% | -1% | -0% | |
| Maximum Upper Side * | 42.9 | 33.6 22% | 37.5 13% | 40.1 7% | 43.6 -2% | 40.6 ? 5% | 40.5 ? 6% |
| Maximum Bottom * | 44.8 | 33.9 24% | 36.2 19% | 41 8% | 47.8 -7% | 43.7 ? 2% | 43.2 ? 4% |
| Idle Upper Side * | 28.8 | 24.8 14% | 25.7 11% | 31.7 -10% | 32 -11% | 27.9 ? 3% | 28.3 ? 2% |
| Idle Bottom * | 25.8 | 25.4 2% | 24.3 6% | 28.8 -12% | 32.4 -26% | 29.1 ? -13% | 29.2 ? -13% |
* ... smaller is better
Speakers
Microsoft Surface Pro 7 Plus audio analysis
(±) | speaker loudness is average but good (75.2 dB)
Bass 100 - 315 Hz
(±) | reduced bass - on average 14.7% lower than median
(±) | linearity of bass is average (10.2% delta to prev. frequency)
Mids 400 - 2000 Hz
(+) | balanced mids - only 4.9% away from median
(+) | mids are linear (6.1% delta to prev. frequency)
Highs 2 - 16 kHz
(+) | balanced highs - only 4.1% away from median
(±) | linearity of highs is average (9% delta to prev. frequency)
Overall 100 - 16.000 Hz
(±) | linearity of overall sound is average (17.4% difference to median)
Compared to same class
» 27% of all tested devices in this class were better, 9% similar, 65% worse
» The best had a delta of 6%, average was 21%, worst was 57%
Compared to all devices tested
» 28% of all tested devices were better, 8% similar, 64% worse
» The best had a delta of 4%, average was 25%, worst was 134%
Energy consumption - The Surface Pro Plus delivers good battery life
Energy consumption
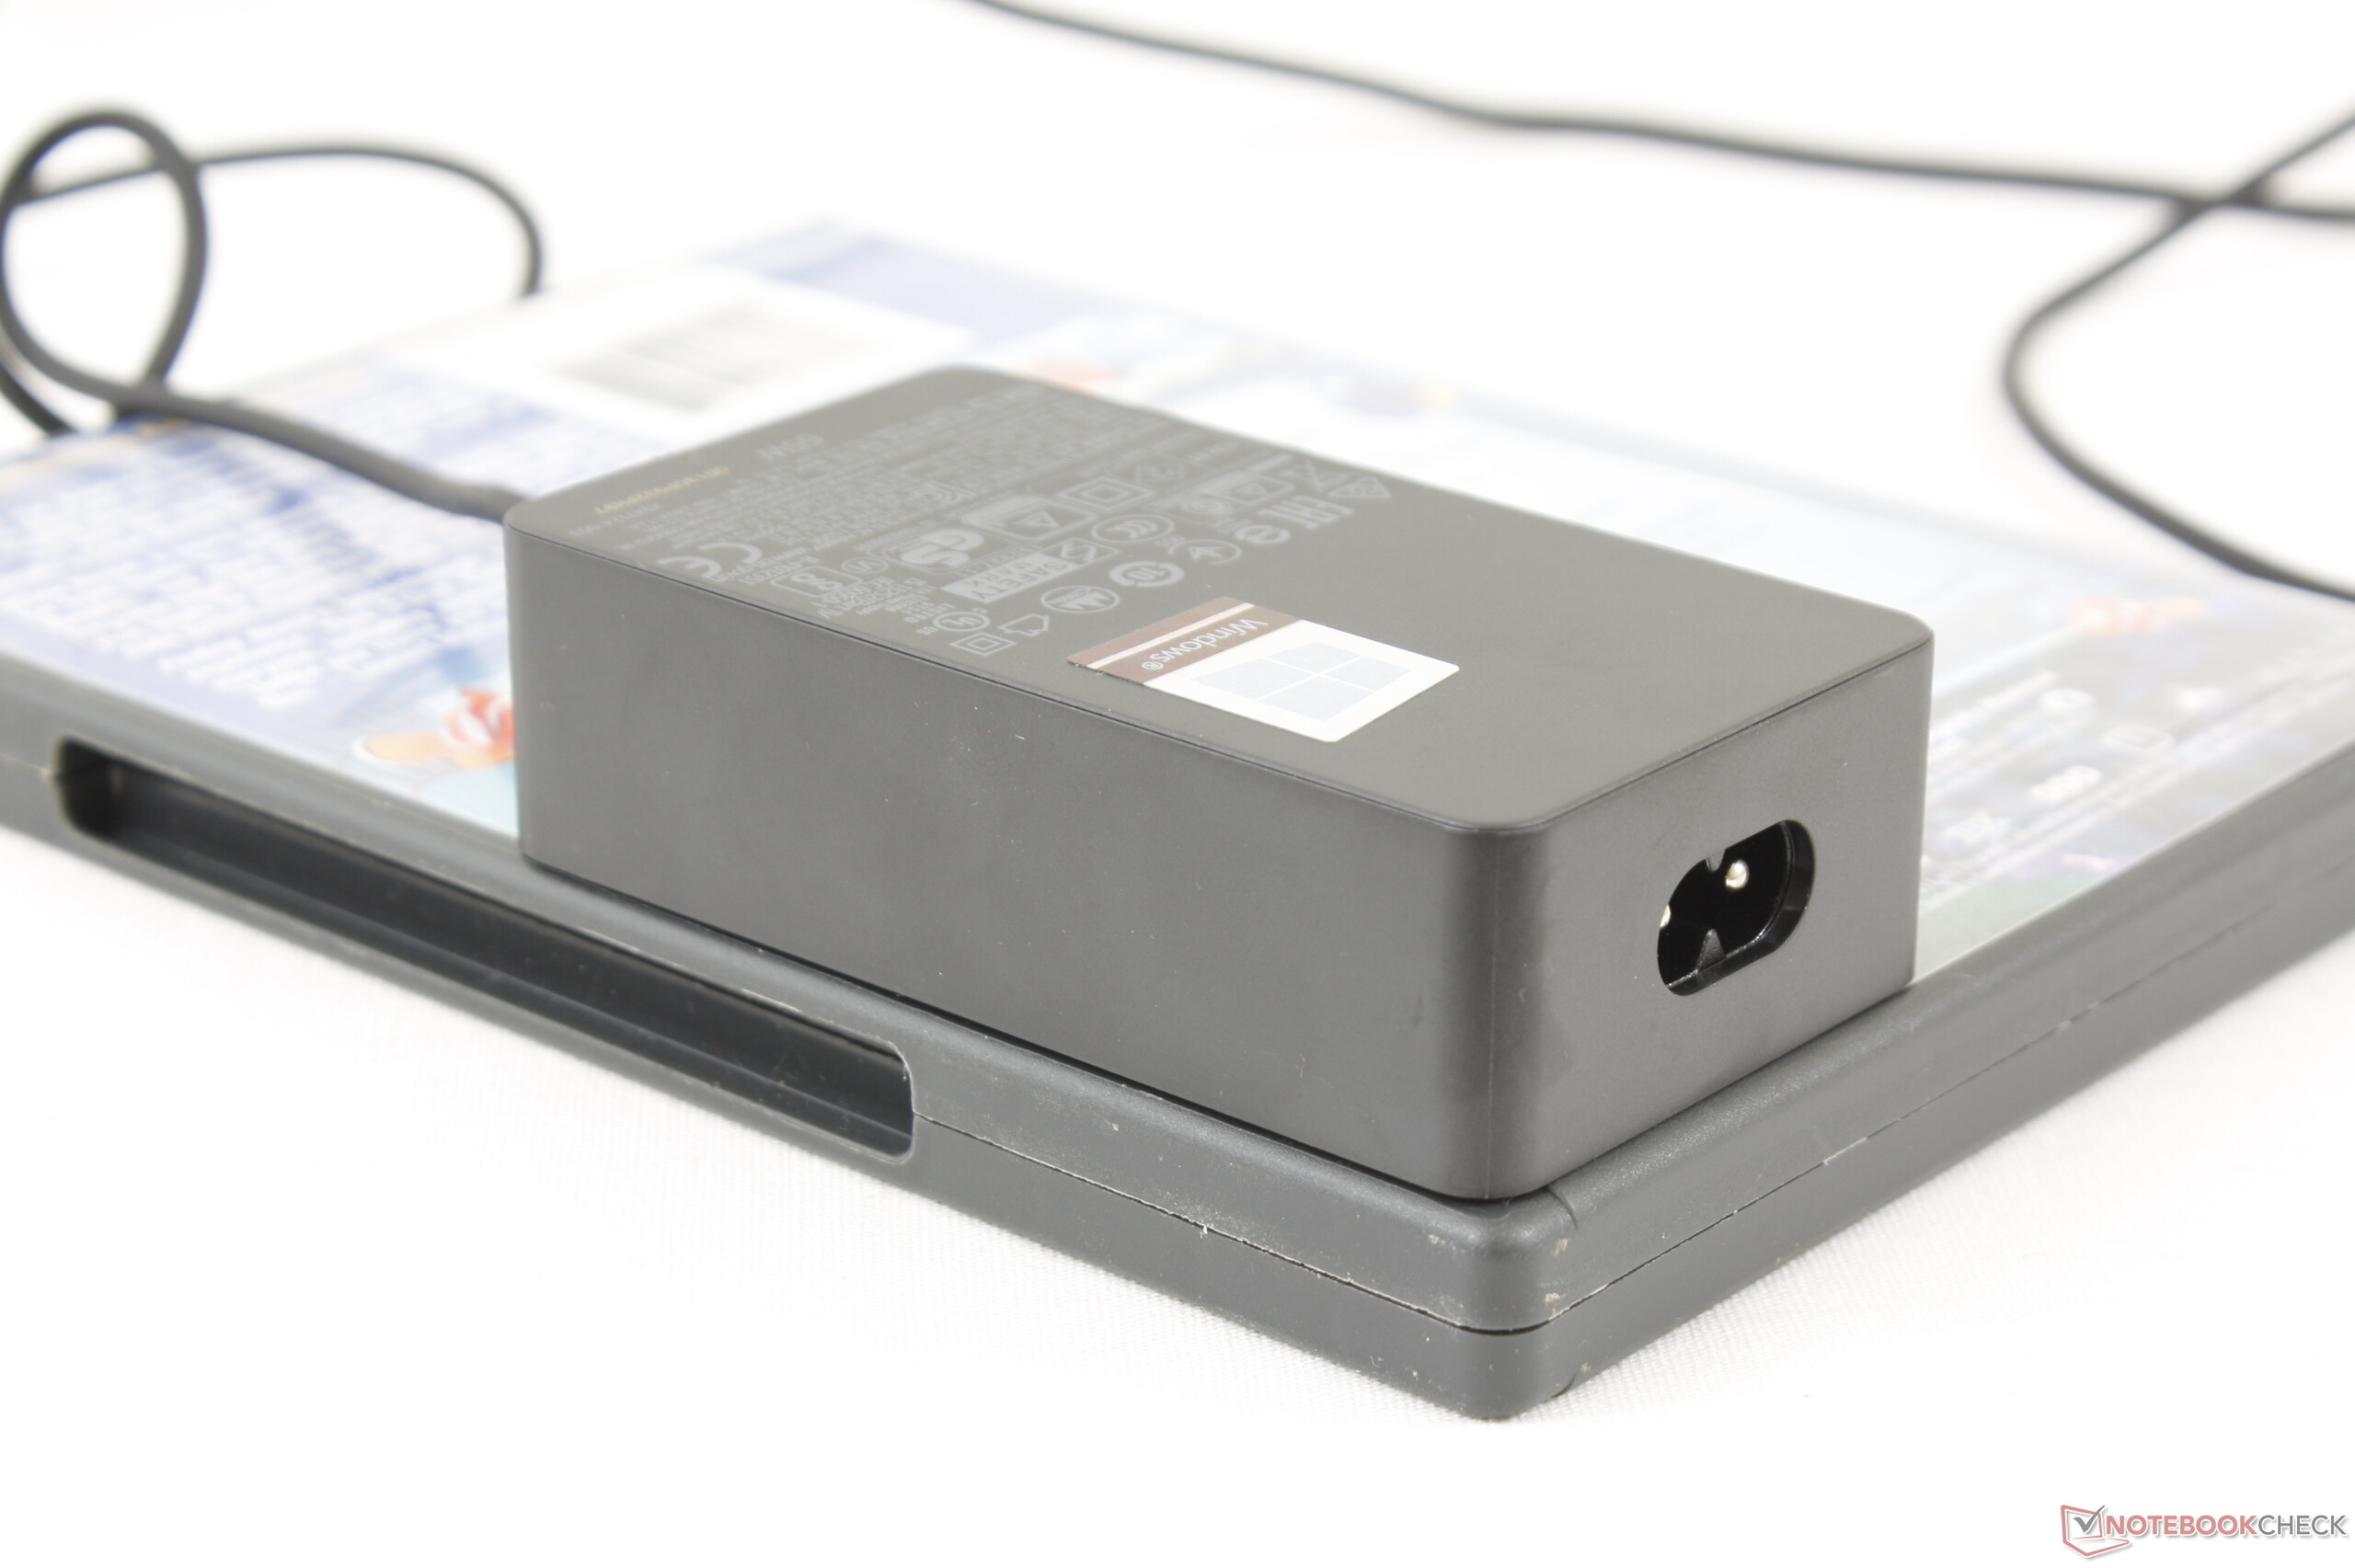
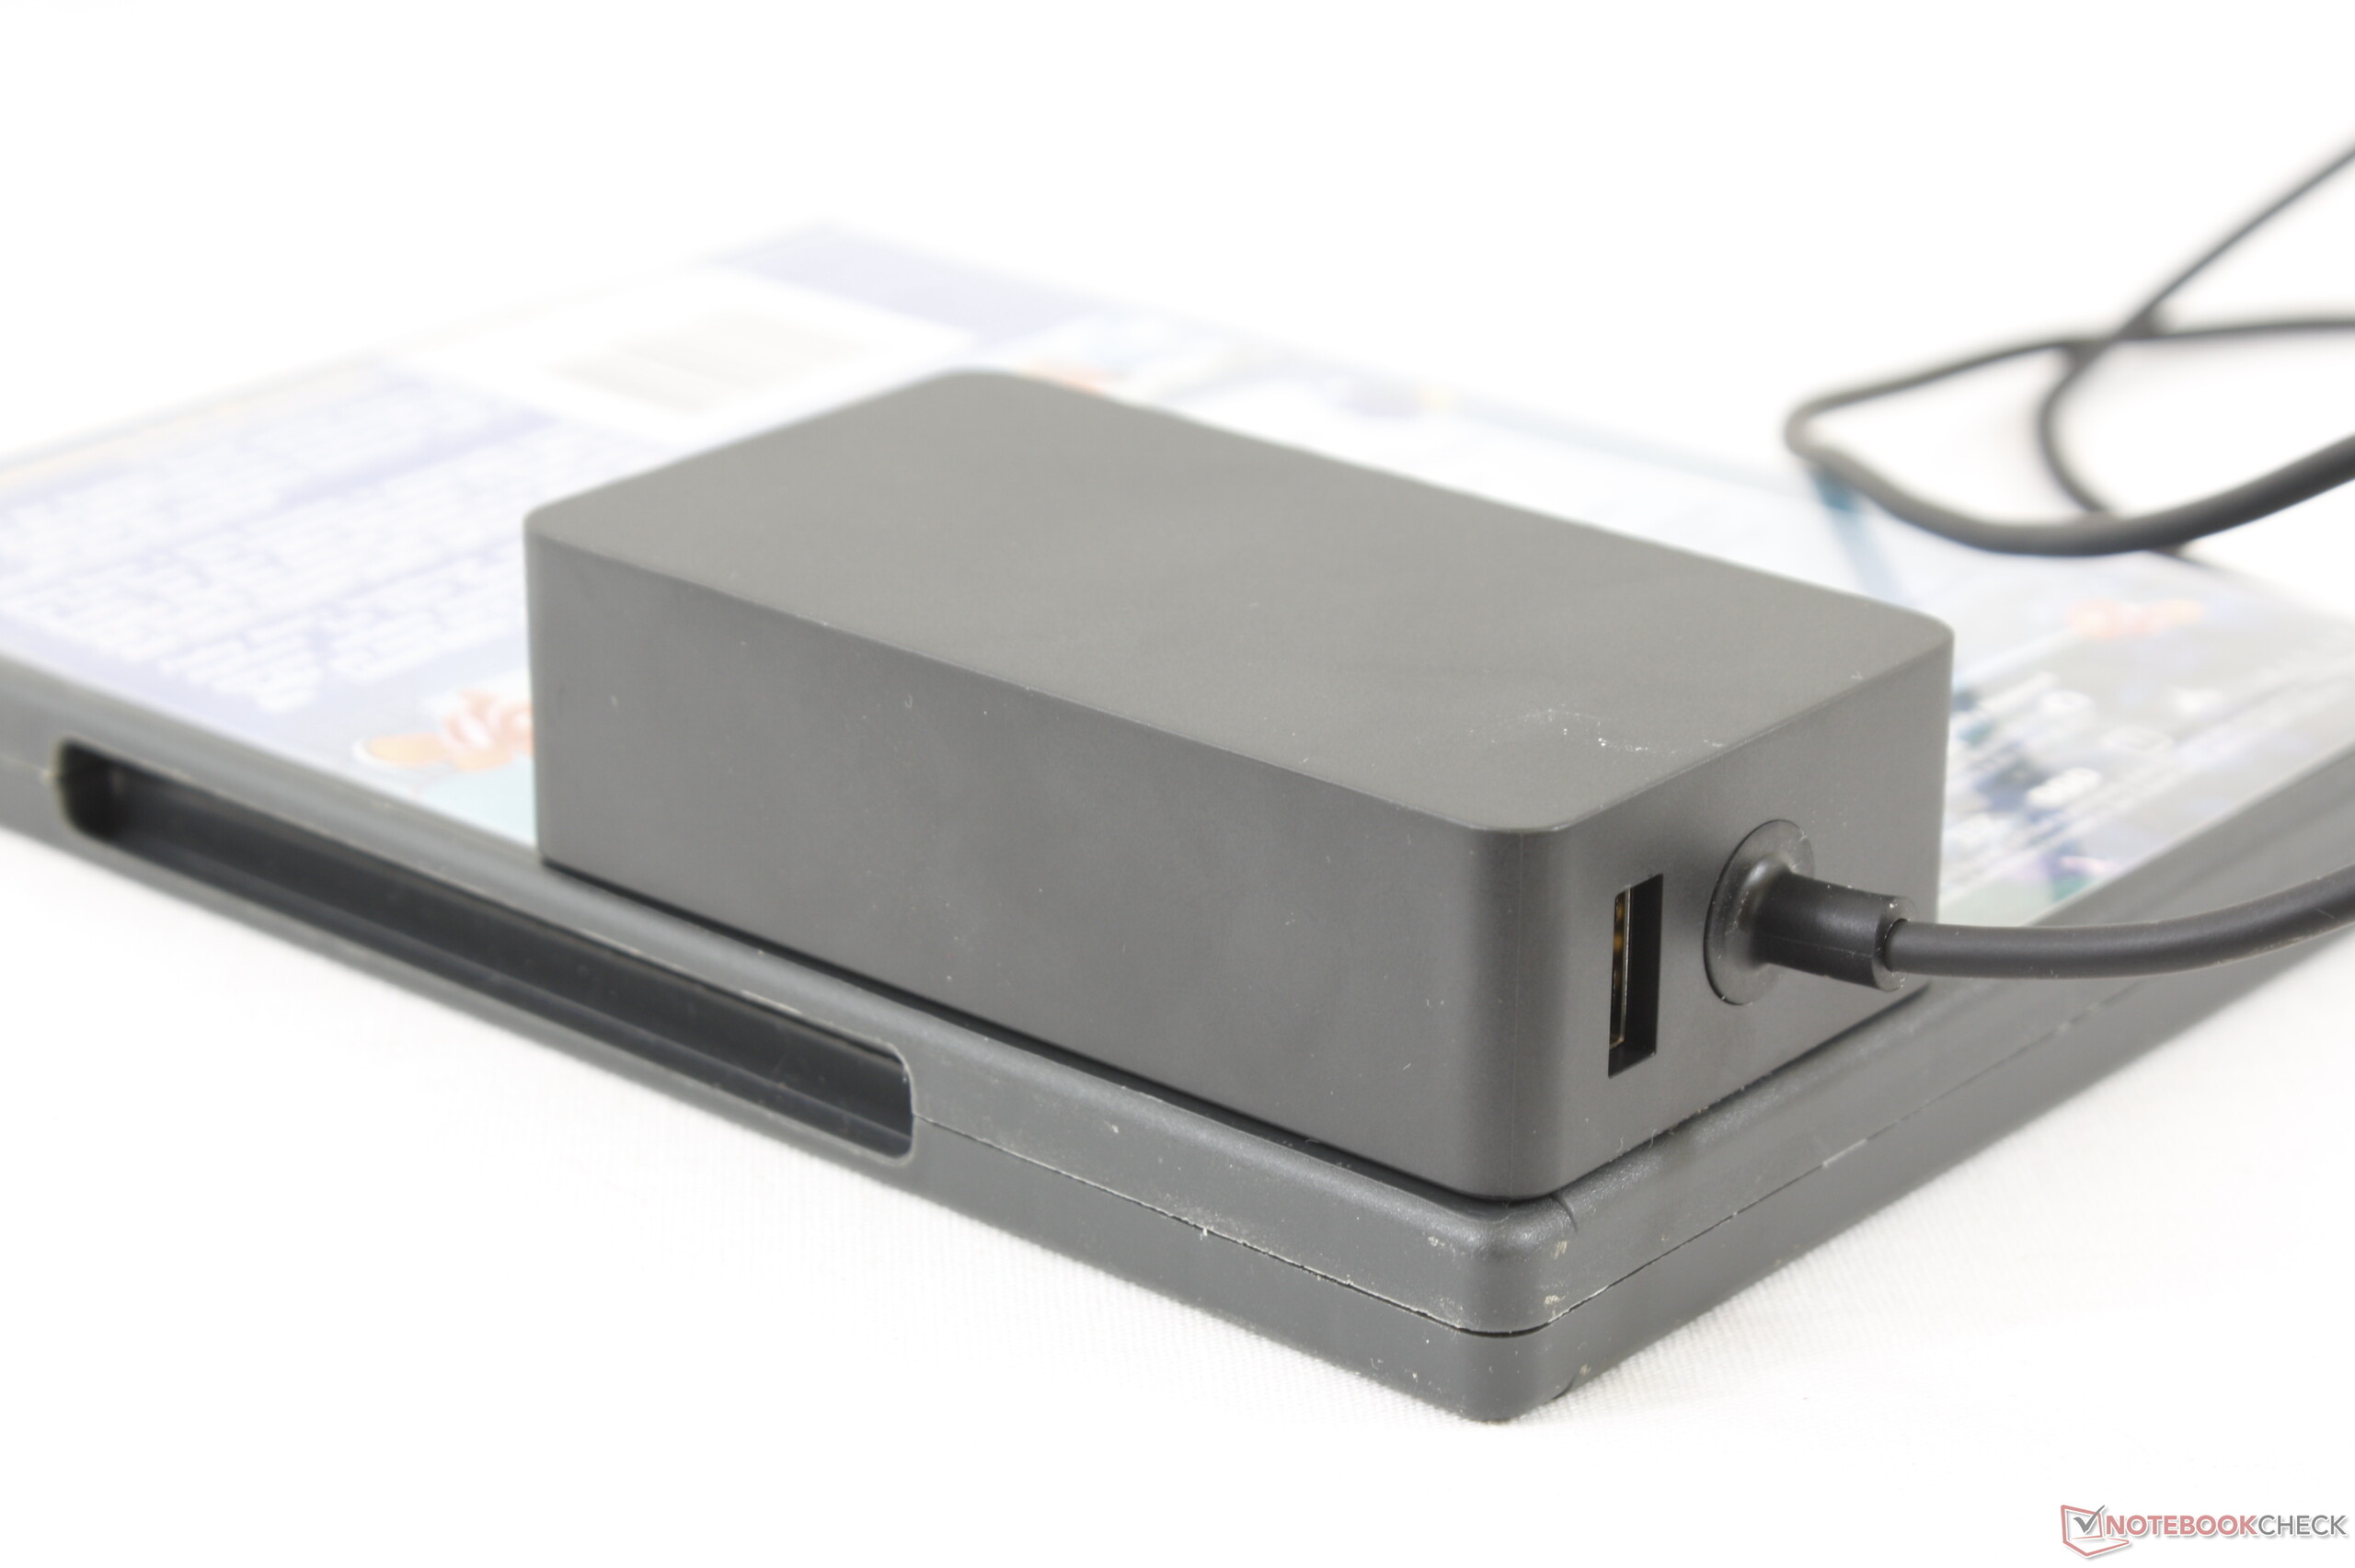
The device doesn't reveal any problems in terms of energy consumption. Power consumption is on par with the Ice Lake Surface Pro 7 models. In addition, the output of the included USB Type-C power adapter is 65 watts.
| Off / Standby | |
| Idle | |
| Load |
|
| Microsoft Surface Pro 7 Plus i5-1135G7, Iris Xe G7 80EUs | Lenovo Yoga Duet 7 13IML05-82AS000WGE i5-10210U, UHD Graphics 620 | Dell Latitude 12 7210 2-in-1 i7-10610U, UHD Graphics 620 | Microsoft Surface Pro 7 i7-1065G7, Iris Plus Graphics G7 (Ice Lake 64 EU) | Microsoft Surface Pro 7 Core i5-1035G4 i5-1035G4, Iris Plus Graphics G4 (Ice Lake 48 EU) | Average Intel Iris Xe Graphics G7 80EUs | Average of class Convertible | |
|---|---|---|---|---|---|---|---|
| Power Consumption | 42% | 32% | 5% | 4% | 13% | -2% | |
| Idle Minimum * | 5.5 | 3.1 44% | 3.2 42% | 4.4 20% | 4.5 18% | 4.45 ? 19% | 5.34 ? 3% |
| Idle Average * | 9.1 | 5.7 37% | 5.3 42% | 8.7 4% | 9.2 -1% | 7.33 ? 19% | 8.12 ? 11% |
| Idle Maximum * | 10.8 | 8.7 19% | 8.4 22% | 9.6 11% | 9.6 11% | 9.23 ? 15% | 11 ? -2% |
| Load Average * | 39.2 | 20.5 48% | 27 31% | 44 -12% | 42 -7% | 36.1 ? 8% | 46.4 ? -18% |
| Load Maximum * | 62.5 | 22.6 64% | 46.9 25% | 61 2% | 63.5 -2% | 61.1 ? 2% | 65.2 ? -4% |
* ... smaller is better
Battery life
Microsoft promises a maximum battery life of 15 hours - we were able to determine a maximum idle runtime of 13:36 hours. The Wi-Fi test (accessing websites via a script) and the video test (the short film Big Buck Bunny (H.264, Full HD) running in a loop) are completed by the device after 8:03 hours and 10:50 hours, respectively. During the tests, the 2-in-1's power-saving features are disabled, and the display brightness is set to about 150 cd/m². The wireless modules are also disabled during the video test.
| Microsoft Surface Pro 7 Plus i5-1135G7, Iris Xe G7 80EUs, 48.9 Wh | Lenovo Yoga Duet 7 13IML05-82AS000WGE i5-10210U, UHD Graphics 620, 39 Wh | Dell Latitude 12 7210 2-in-1 i7-10610U, UHD Graphics 620, 38 Wh | Microsoft Surface Pro 7 i7-1065G7, Iris Plus Graphics G7 (Ice Lake 64 EU), 45 Wh | Microsoft Surface Pro 7 Core i5-1035G4 i5-1035G4, Iris Plus Graphics G4 (Ice Lake 48 EU), 45 Wh | Average of class Convertible | |
|---|---|---|---|---|---|---|
| Battery Runtime | -20% | 5% | -21% | 13% | 6% | |
| Reader / Idle | 816 | 768 -6% | 1365 67% | 690 -15% | 1336 64% | 1112 ? 36% |
| H.264 | 650 | 494 -24% | 676 4% | 403 -38% | 769 ? 18% | |
| WiFi v1.3 | 483 | 523 8% | 489 1% | 586 21% | 597 24% | 569 ? 18% |
| Load | 232 | 95 -59% | 111 -52% | 115 -50% | 116 -50% | 121.7 ? -48% |
Pros
Cons
Verdict
The Surface Pro 7 Plus is the more well-rounded 2-in-1 variant compared to the Surface Pro 7. The Tiger Lake platform used offers more performance overall compared to Ice Lake - GPU performance increases significantly more than CPU performance. A small maintenance hatch enables an easy replacement of the SSD. The device can also connect to the outside world via LTE.
It is still unclear if many users will be able to purchase the Surface Pro 7 Plus. For now, it will only be sold to businesses and schools.
The slightly increased battery capacity (48.9 Wh vs. 45 Wh) doesn't really have an impact. The Surface Pro 7 Plus achieves real-world runtimes of 8 to 11 hours and is roughly on par with the rates of the Surface Pro 7 as a result. The built-in USB-C port (DisplayPort, Power Delivery) still works according to the USB 3.2 Gen. 1 standard. The opportunity to upgrade to Thunderbolt 4/USB 4 was missed here.
Some weaknesses of the regular Surface have been carried over: Despite being passively cooled, Microsoft's 2-in-1 device is not completely silent. Occasionally, an electronic rattling can be heard from inside. The touchscreen display flickers at a frequency of 199.2 Hz at brightness levels of 57% (corresponds to about 119 cd/m²) and below.
Although the Surface is aimed at businesses and schools, it lacks a fingerprint reader. If required, a correspondingly equipped keyboard (Microsoft Surface Pro Type Cover with Fingerprint ID) has to be used here. Finally, the one-year warranty period isn't appropriate for a device in this price range.
Price and availability
The Microsoft Store has the Surface Pro 7 Plus listed at prices starting from $899.99. There are several configurations available as well as a "Business Essentials Bundle" that includes the Type Cover and Protection Plan of your choice. The bundle starts at around $1,100.
Microsoft Surface Pro 7 Plus
-
03/19/2021 v7
Sascha Mölck
Pricecompare

