 Deutsch
 English
 Español
 Français
 Italiano
 Nederlands
 Polski
 Português
 Русский
 Türkçe
 Svenska
 Chinese
 Magyar
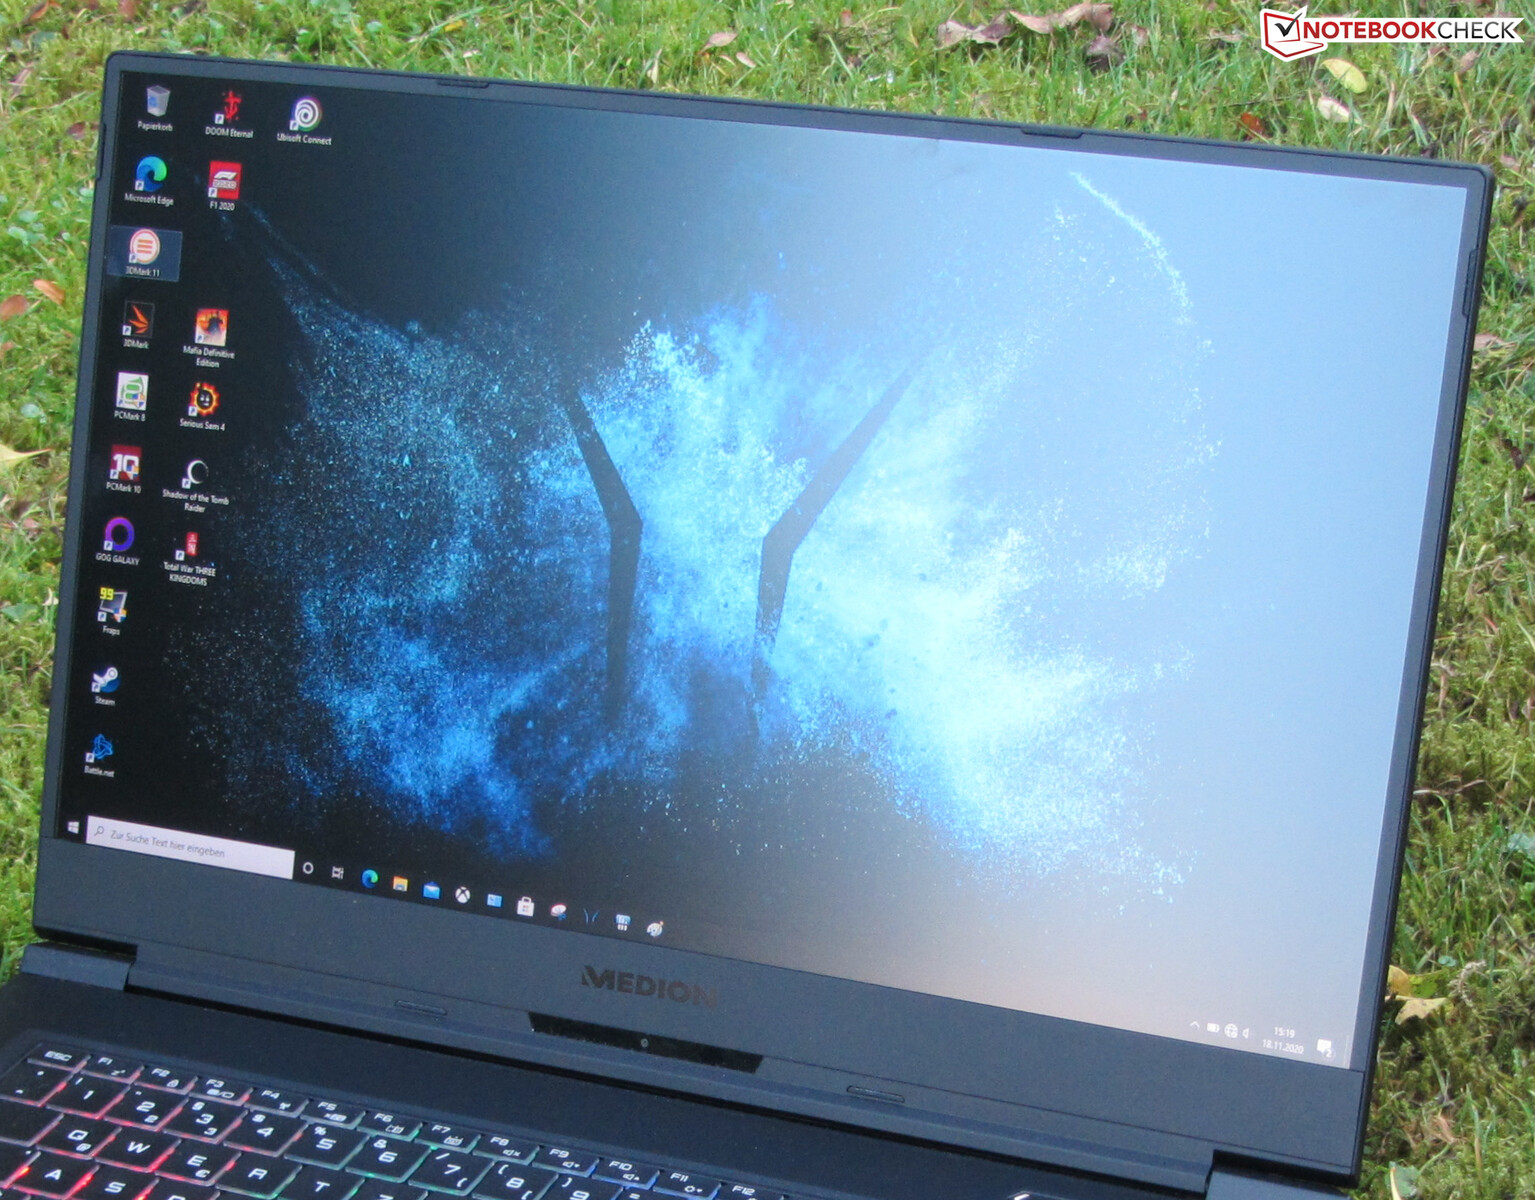
Medion Erazer Beast X10 (Tongfang GM7MPHP) in review: Stable, slim, compact gaming laptop with good battery life

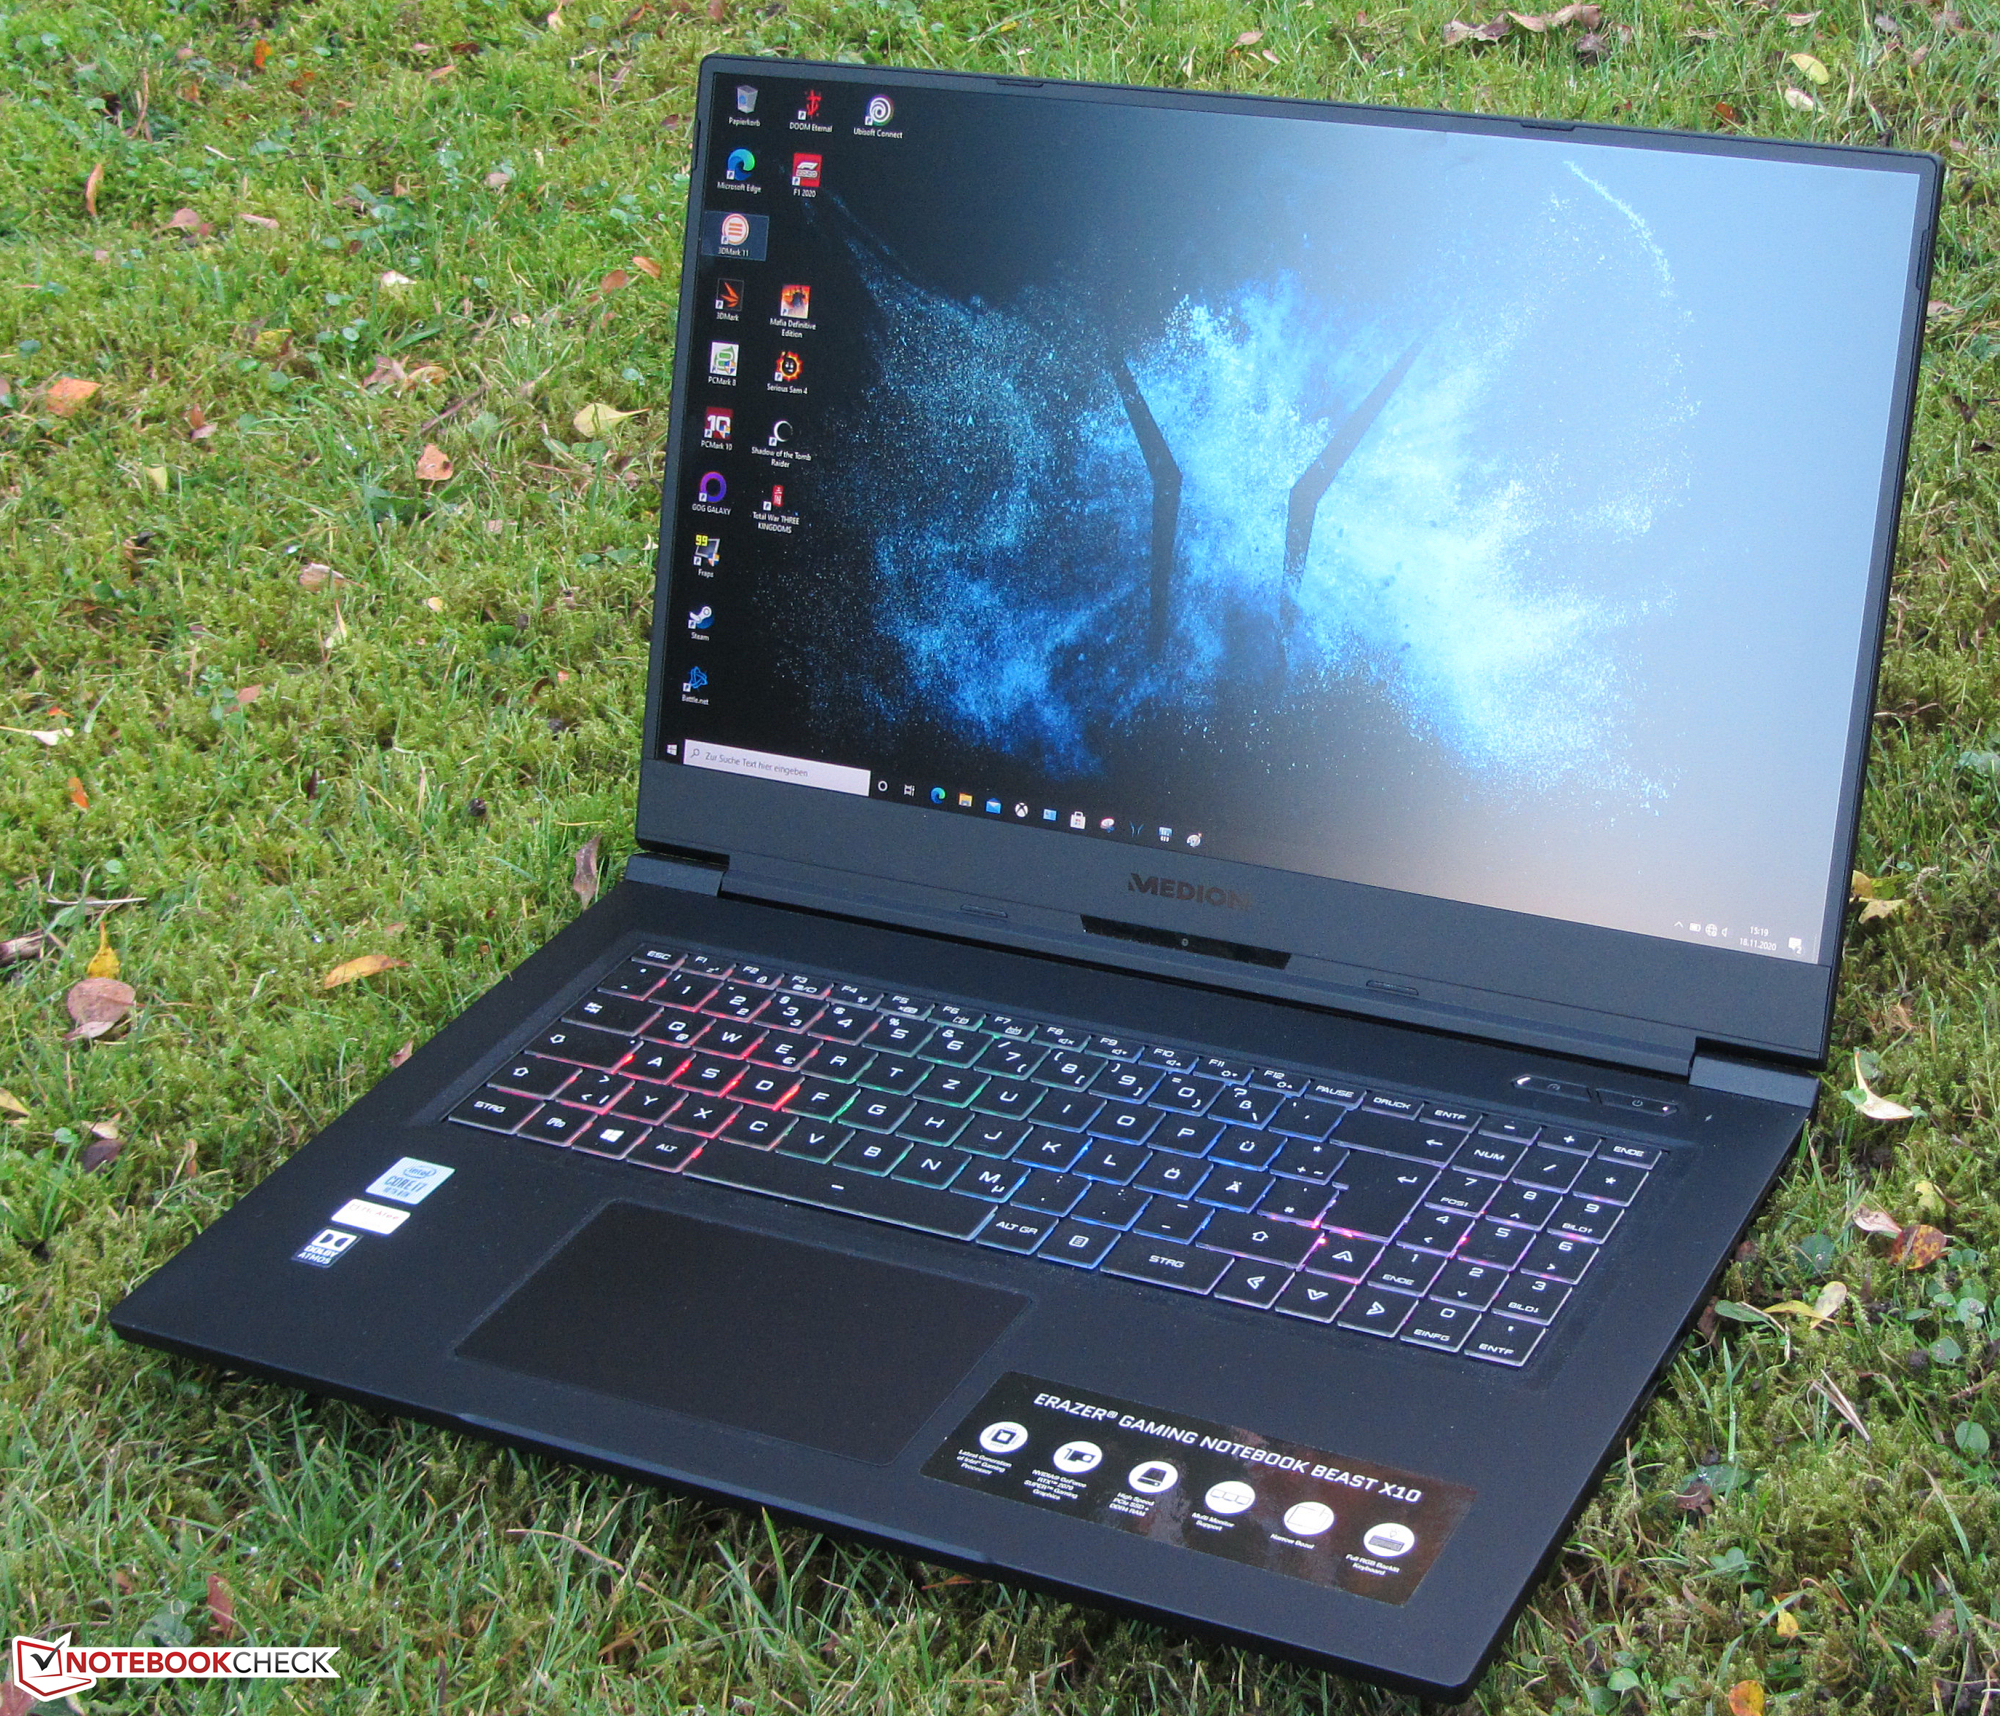
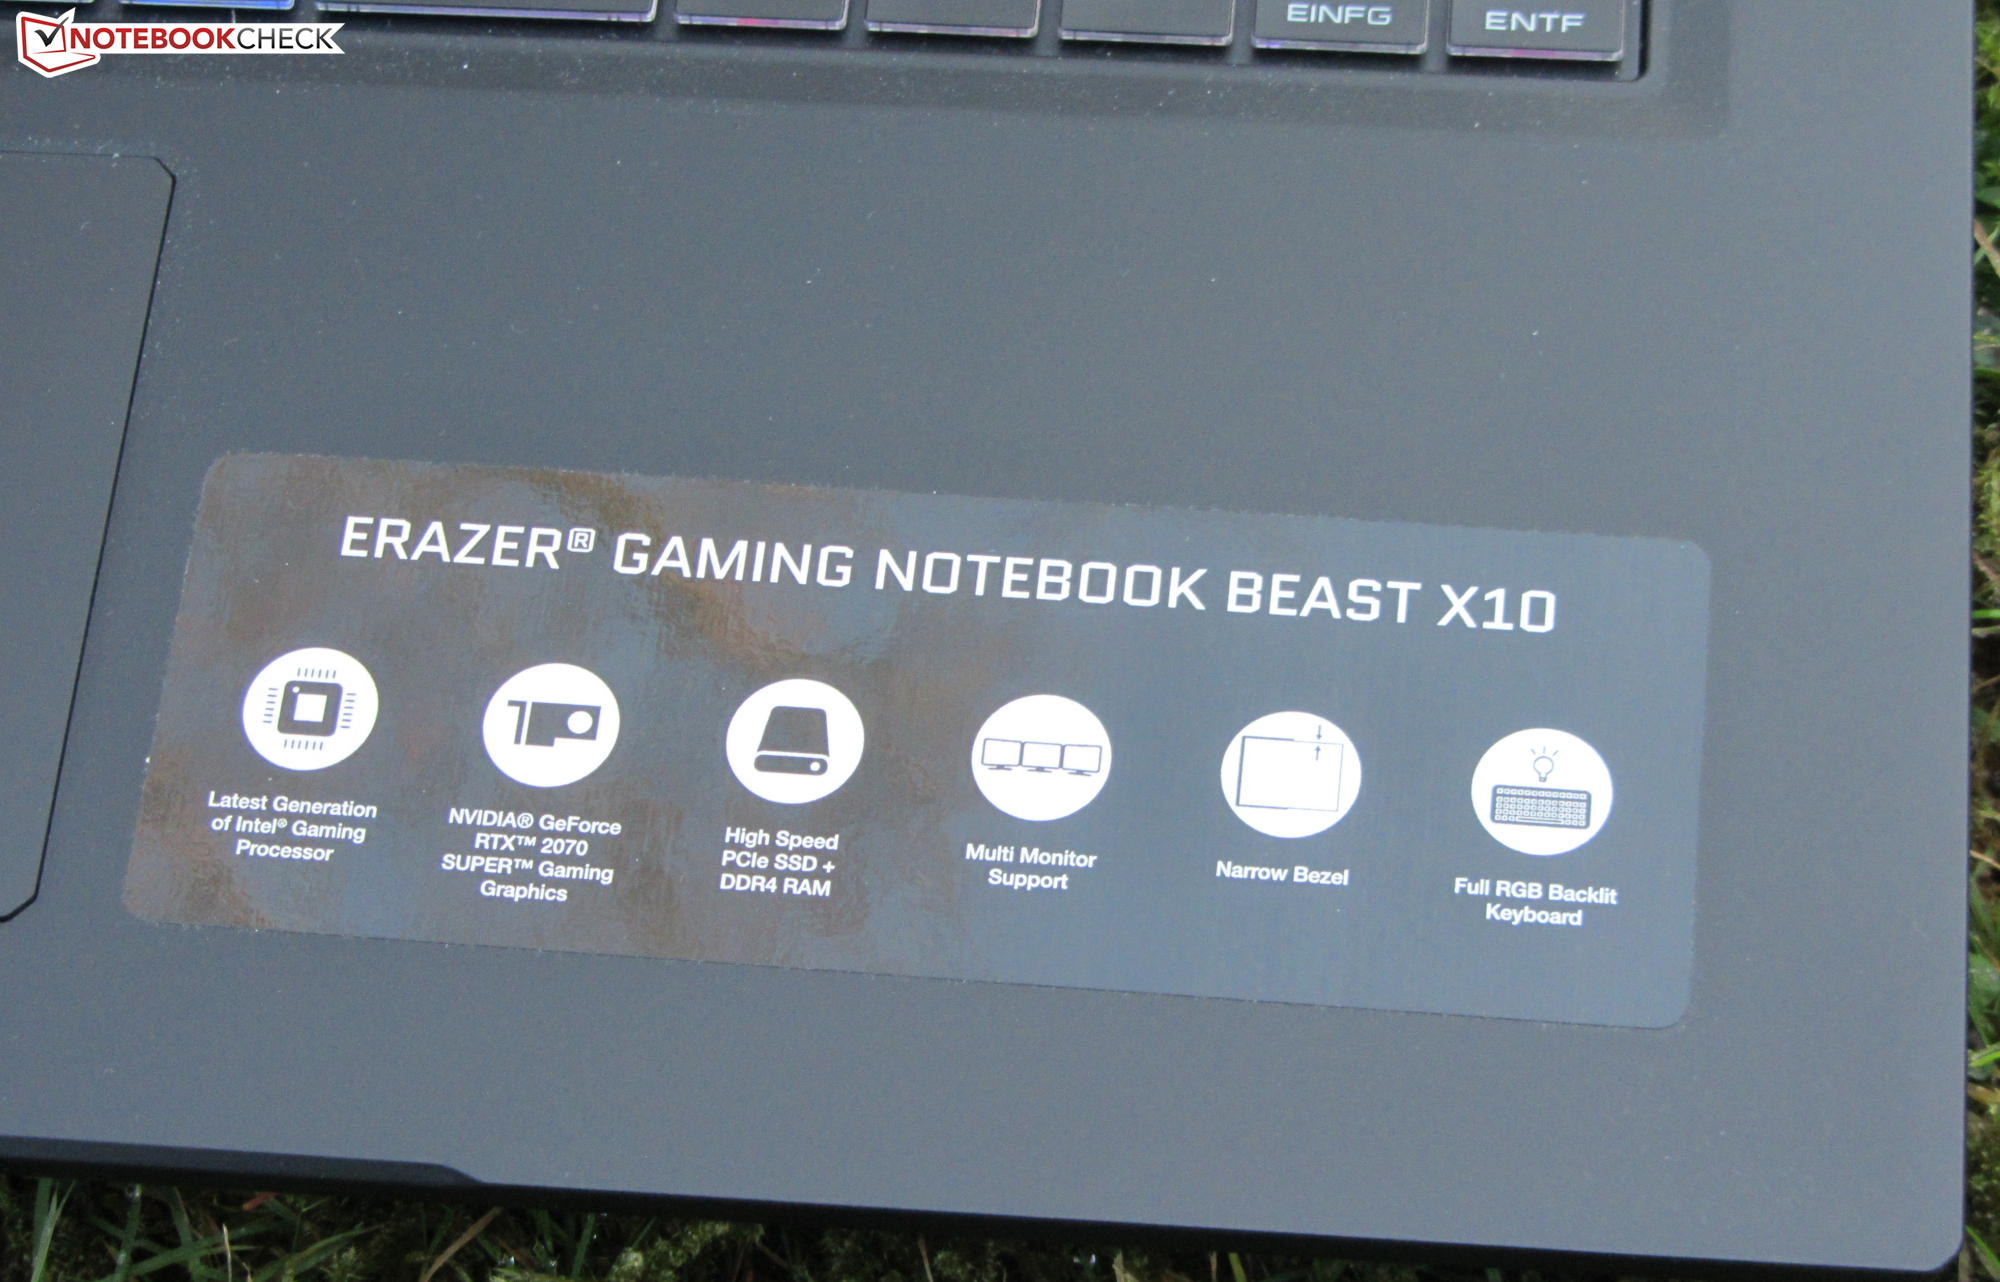
With the Erazer Beast X10, Medion has a compact 17.3-inch gaming laptop in its range that is based on a barebone from Tongfang. The test device provided to us is powered by a Core i7-10750H processor and a GeForce RTX 2070 Super Max Q graphics core. Alternatively, models with the Core i9-10980HK processor and/or the GeForce RTX 2080 Super GPU are available. Competitors include devices like the Schenker XMG Neo 17, the Asus Strix G17 G712LWS, the MSI GS75 10SF, the Acer Predator Helios 300 PH317-54, and the Razer Blade Pro 17.
Rating | Date | Model | Weight | Height | Size | Resolution | Best Price |
|---|---|---|---|---|---|---|---|
| 84.7 % | 11/2020 | Medion Erazer Beast X10 MD61804 i7-10750H, GeForce RTX 2070 Super Max-Q | 2.3 kg | 24.6 mm | 17.30" | 1920x1080 | |
| 85.8 % | 11/2020 | SCHENKER XMG Neo 17 Comet Lake i7-10875H, GeForce RTX 2070 Super Mobile | 2.6 kg | 27.45 mm | 17.30" | 1920x1080 | |
| 83.1 % | 10/2020 | Asus Strix G17 G712LWS i7-10750H, GeForce RTX 2070 Super Mobile | 2.8 kg | 26.5 mm | 17.30" | 1920x1080 | |
| 83.6 % | 10/2020 | Acer Predator Helios 300 PH317-54-75G8 i7-10750H, GeForce RTX 2060 Mobile | 2.8 kg | 25 mm | 17.30" | 1920x1080 | |
| 83.7 % | 07/2020 | MSI GS75 10SF-609US i7-10875H, GeForce RTX 2070 Max-Q | 2.3 kg | 18.9 mm | 17.30" | 1920x1080 | |
| 87.4 % | 06/2020 | Razer Blade Pro 17 RTX 2070 Max-Q 300 Hz i7-10875H, GeForce RTX 2070 Max-Q | 2.7 kg | 19.9 mm | 17.30" | 1920x1080 |
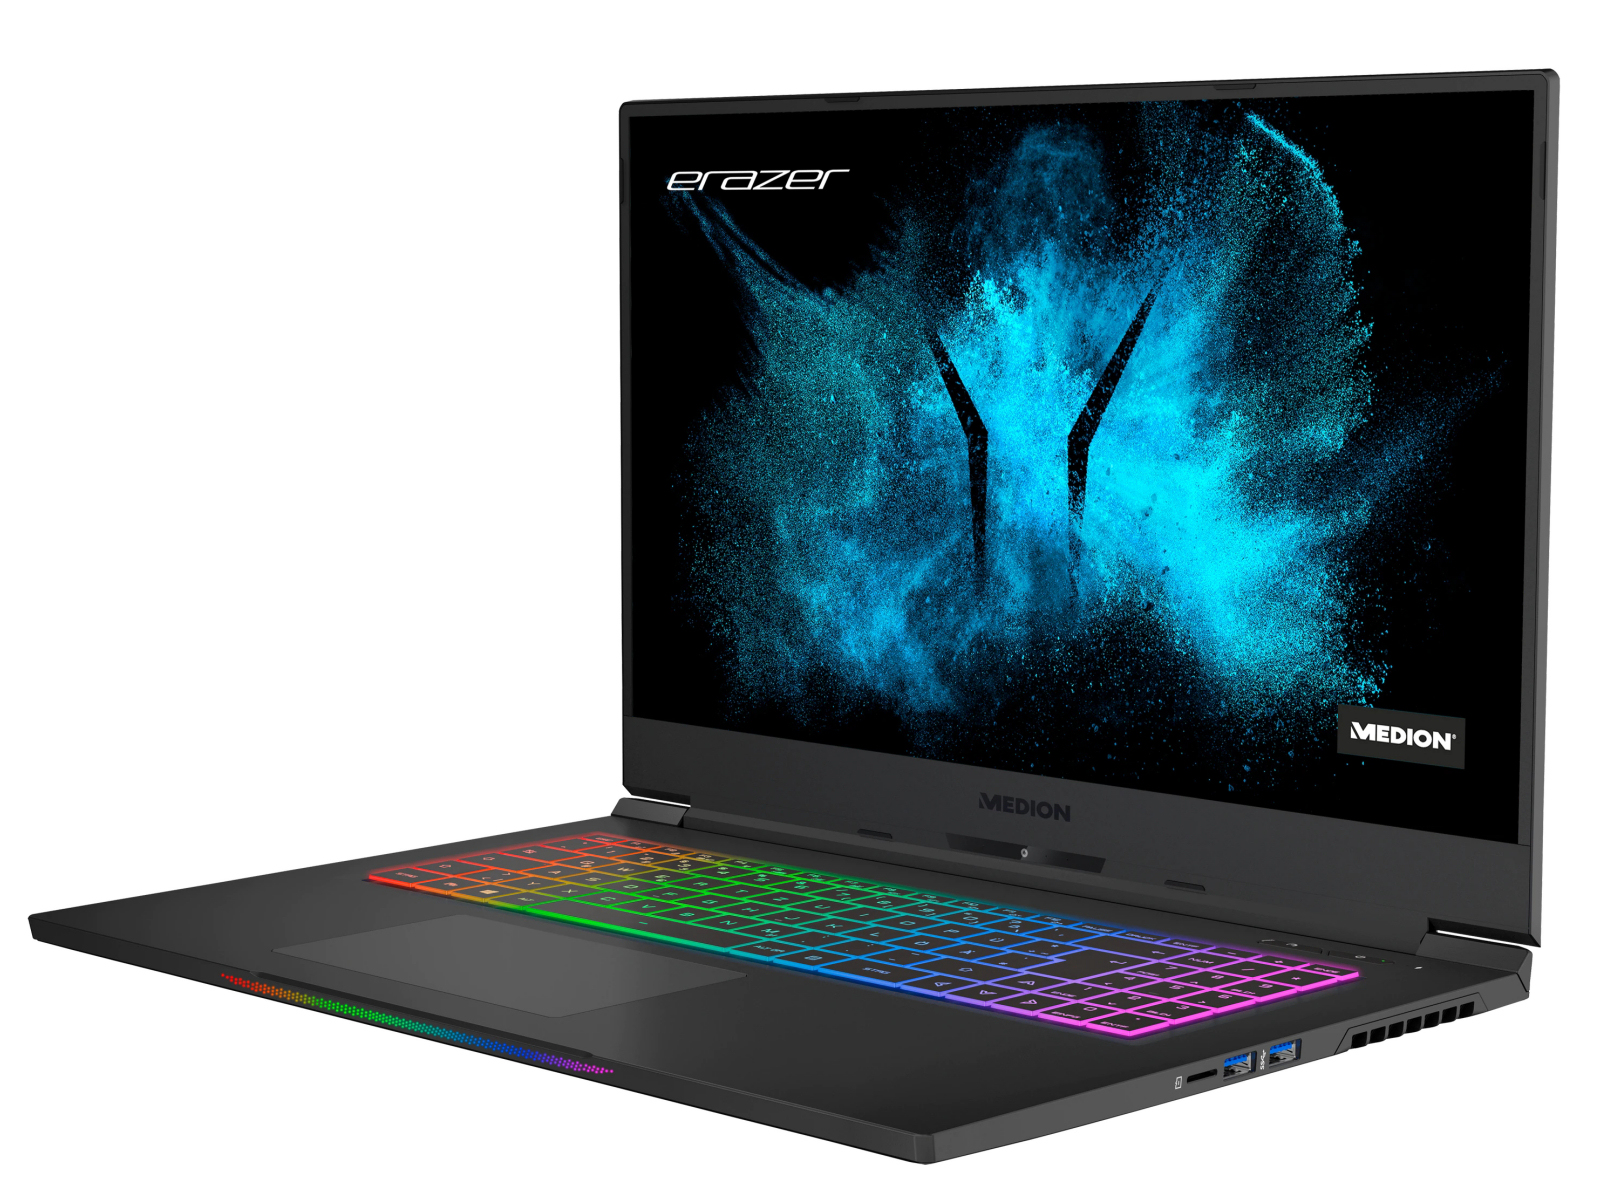
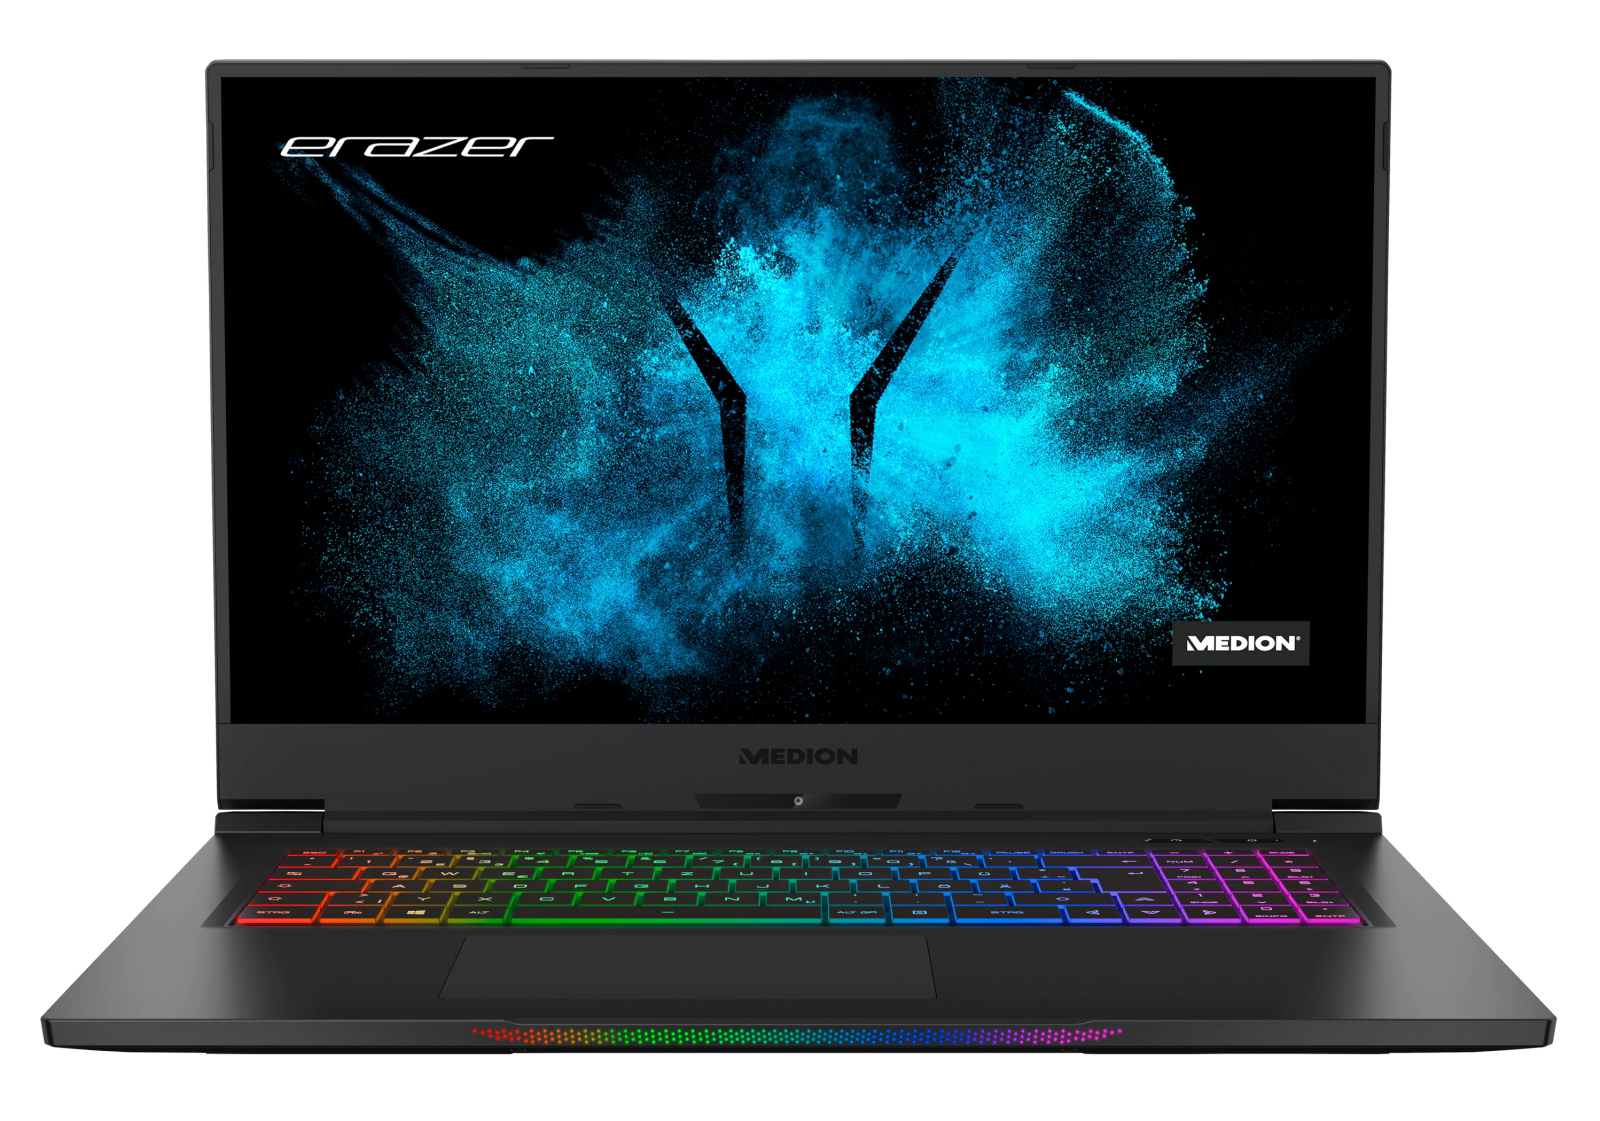
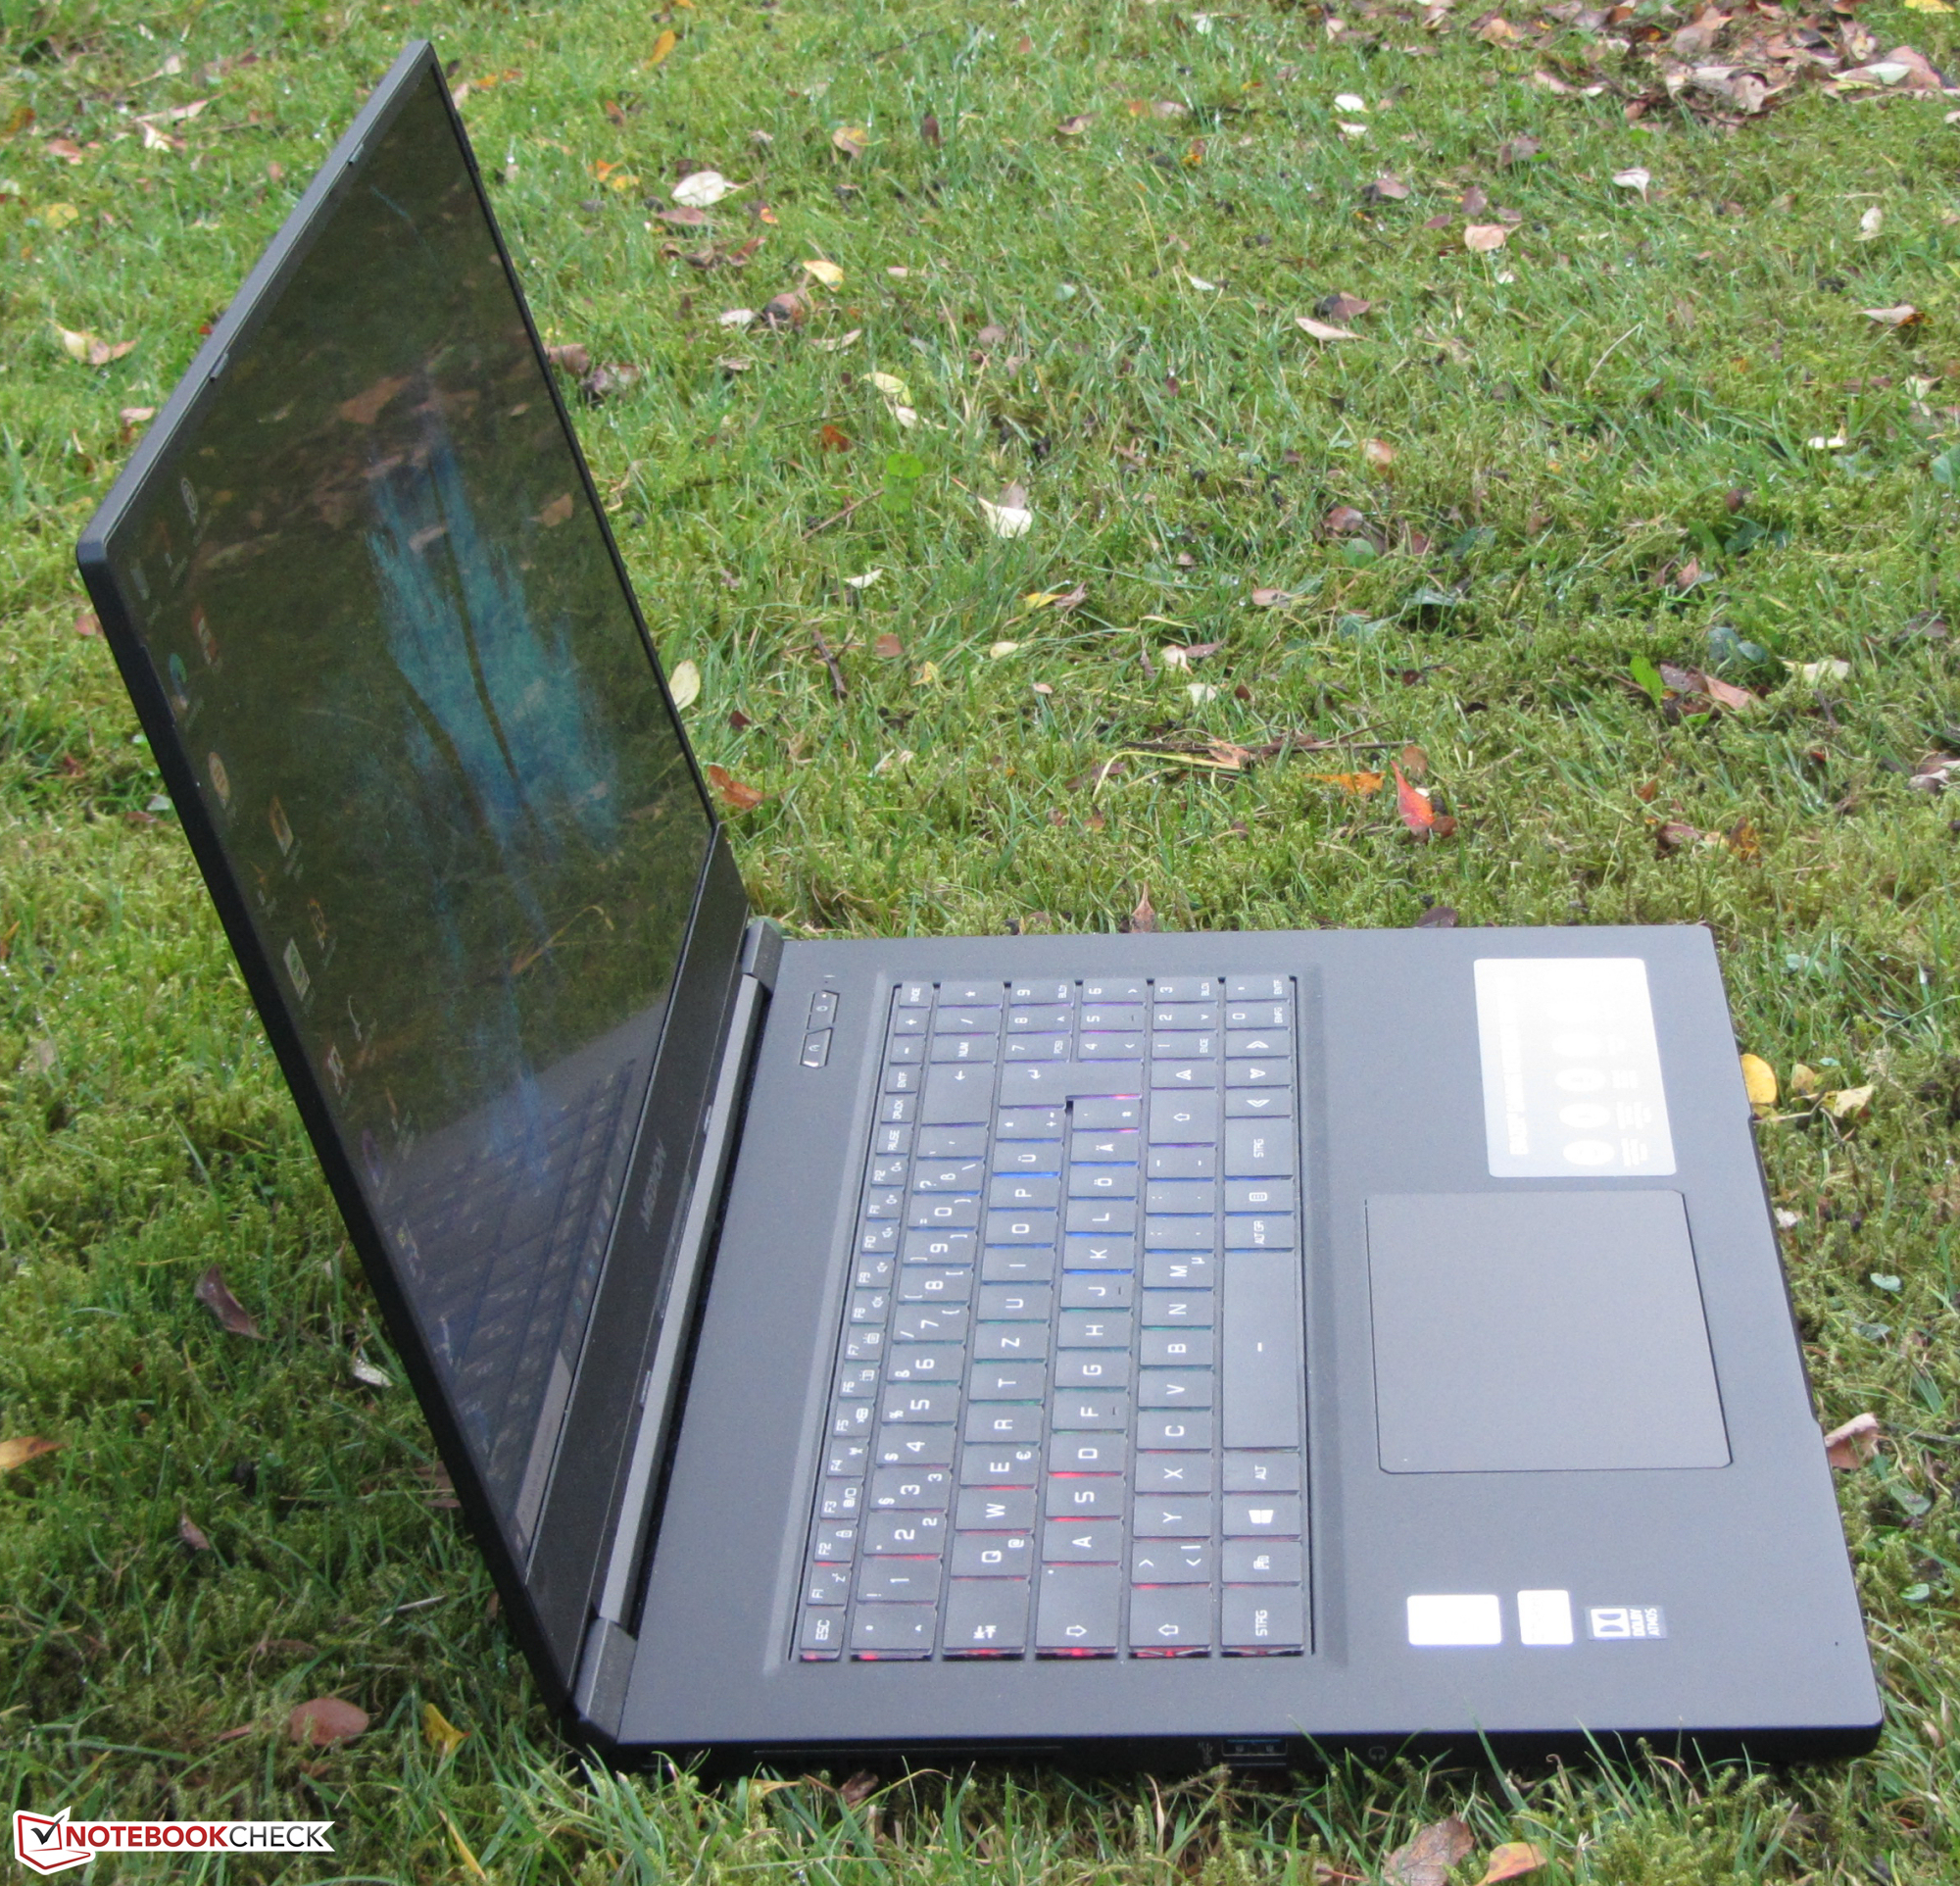
Case - The X10 features a compact metal case
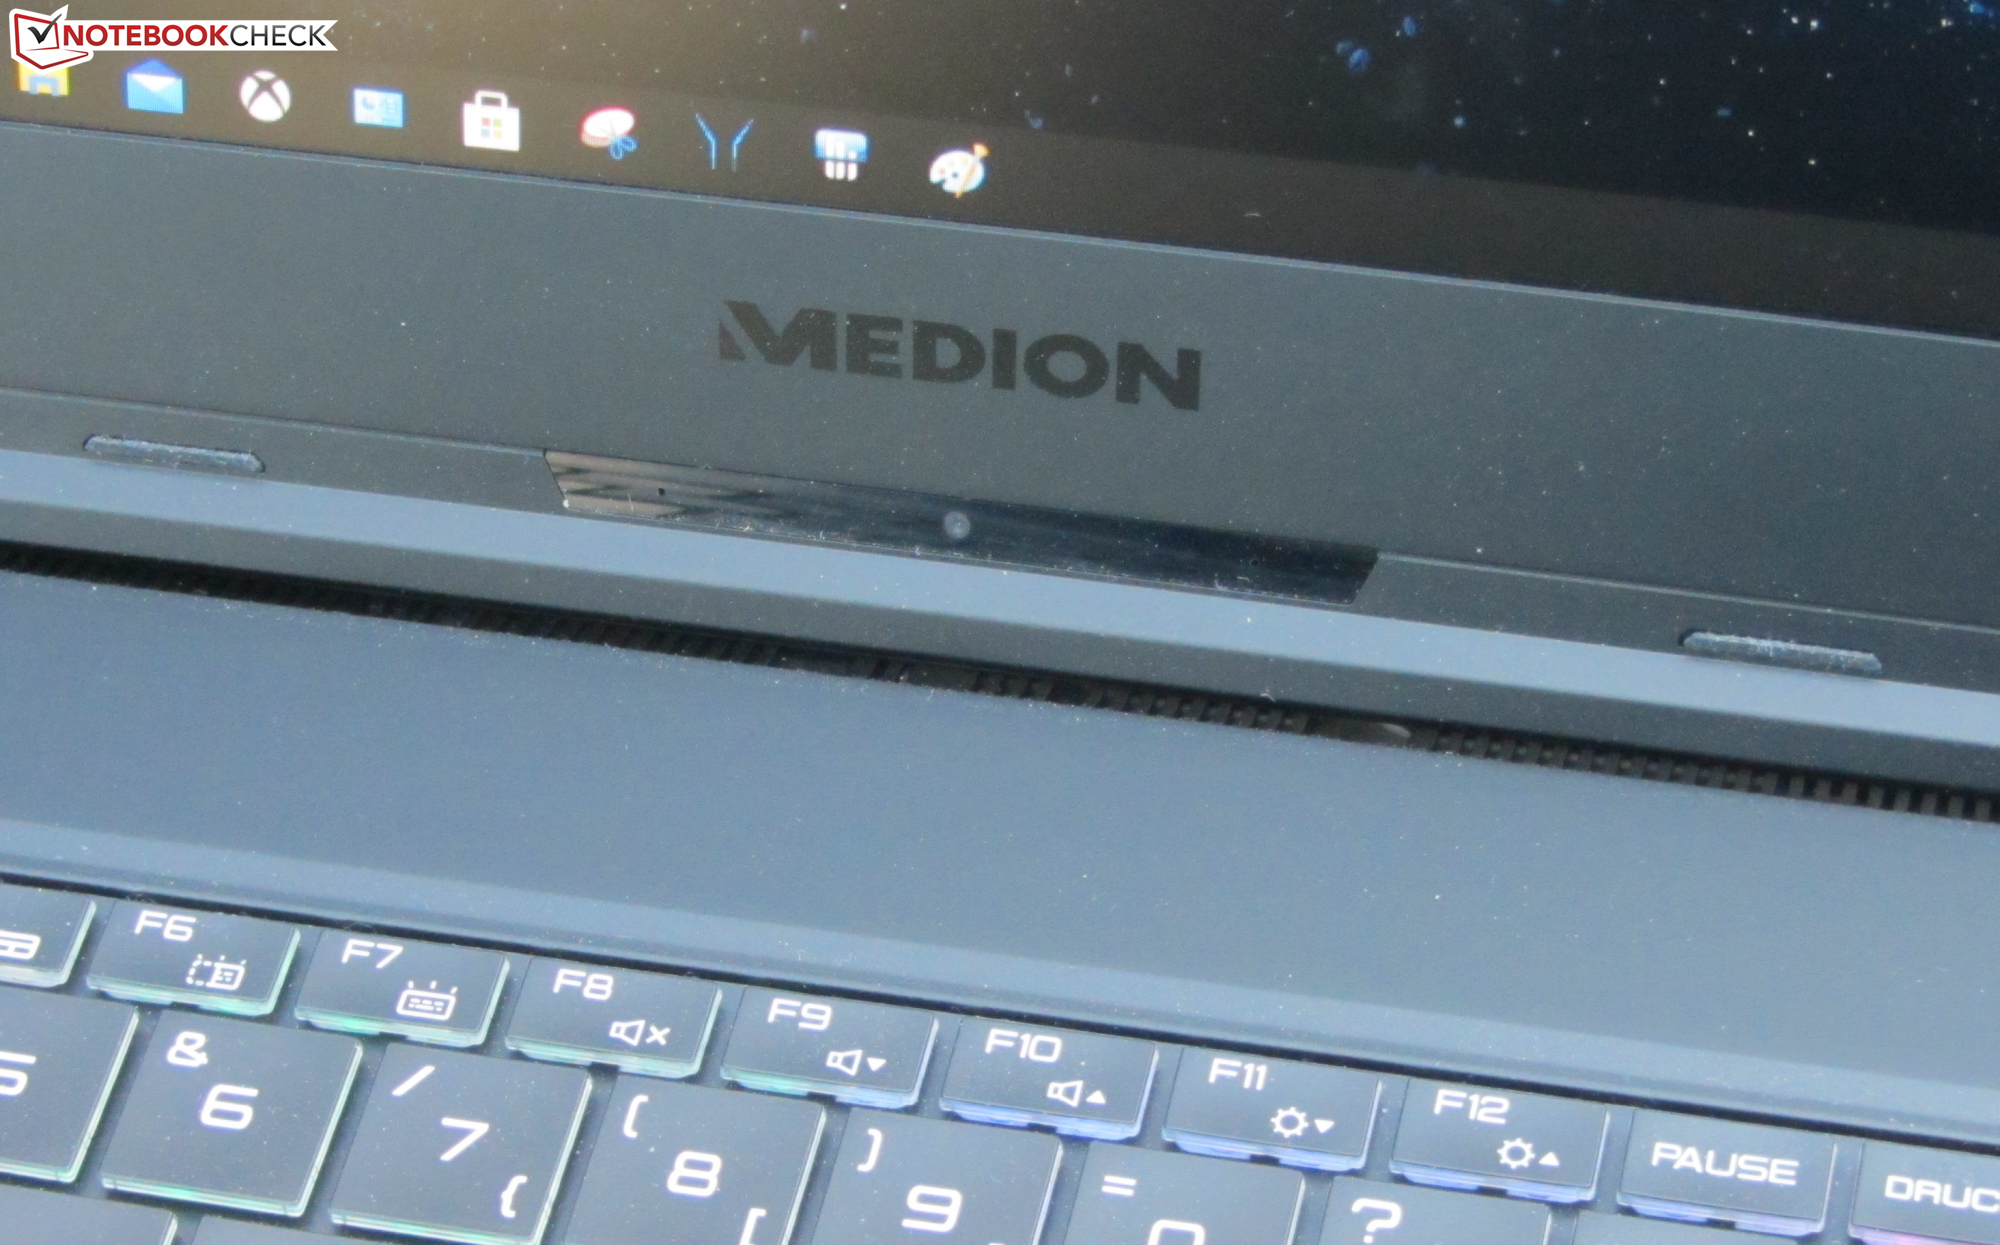
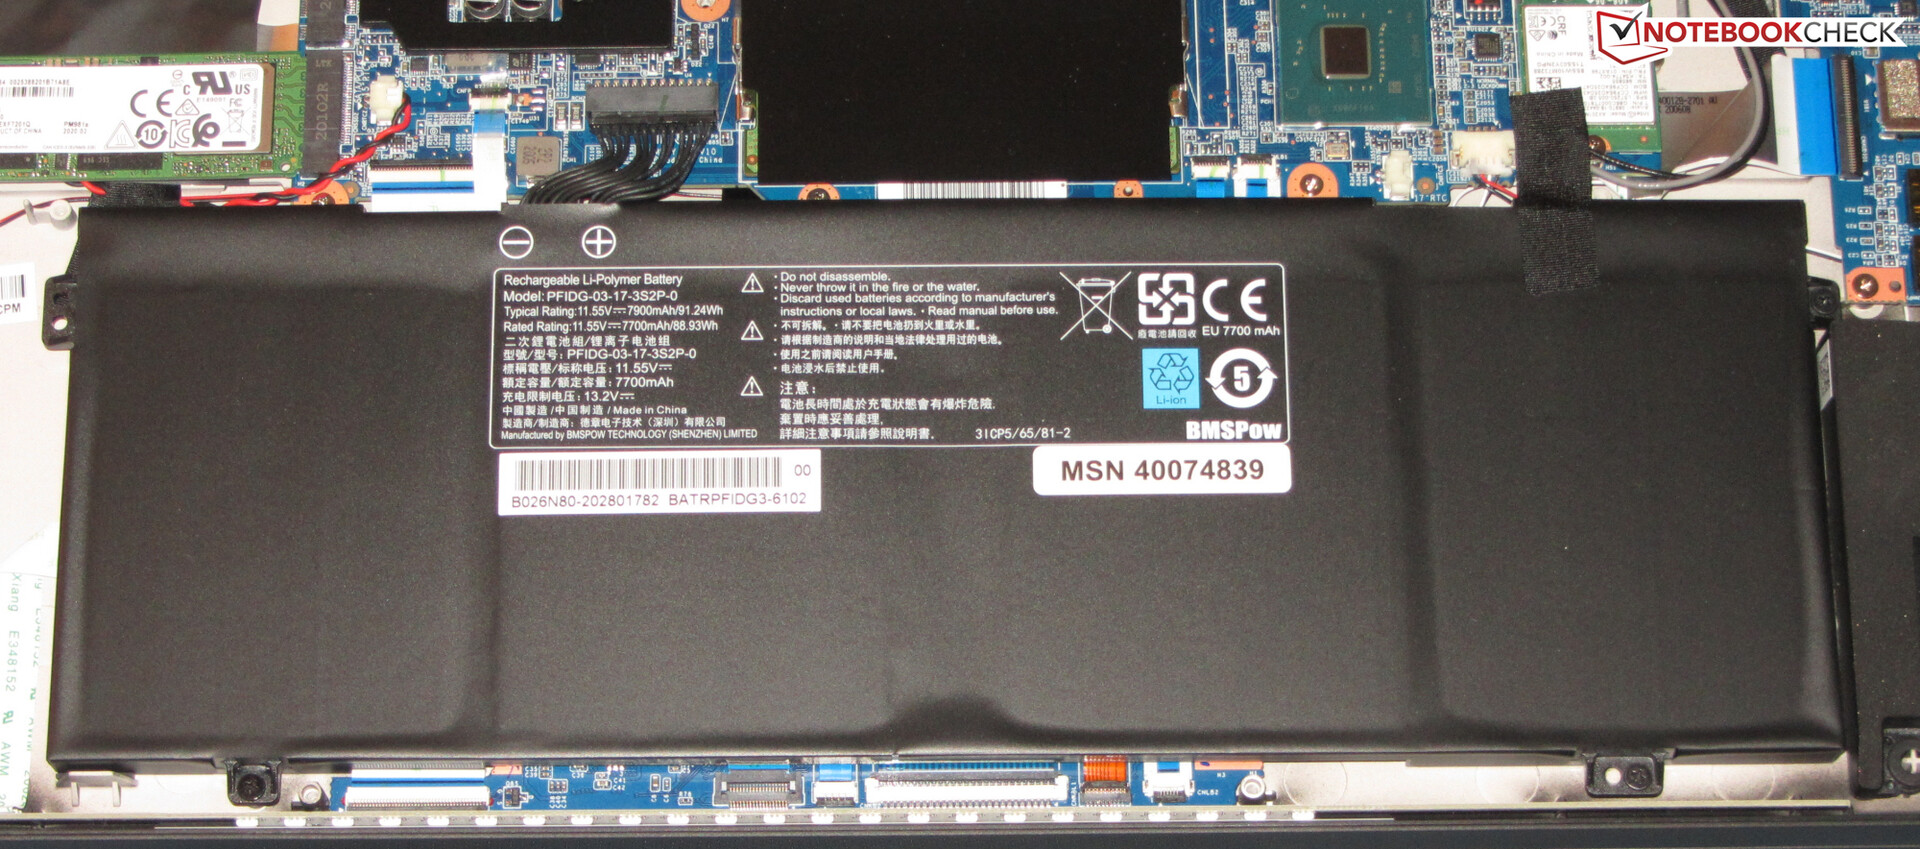
The demand for gaming laptops that come in a discreet design is growing increasingly. With the Beast X10, the supply has been extended by a further device of this kind. Here, Medion uses a fancy, matte black colored full metal case that wouldn't attract attention in a professional environment. The slim display bezels contribute greatly to the laptop's attractive look. You can reach the inside after removing the bottom cover. The battery is firmly installed.
The laptop shows good workmanship. The gap dimensions are in order, and there's no excess material to be found. Moreover, the device doesn't show any stability deficiencies. The opposite is the case: The X10 offers such a rigid base unit that it's rare for us to find something like it. The lid can be twisted, but the whole situation still remains within the limits. Pressure on the backside of the lid doesn't lead to changes on the image. The hinges hold the lid firmly in position. The maximum aperture angle is about 130 degrees. In addition, opening the lid with one hand is possible.
Within our comparison field, the Erazer is one of the most compact devices. It's only just beaten by the Razer Blade Pro 17. However, it weighs almost 400 grams less than the Blade.
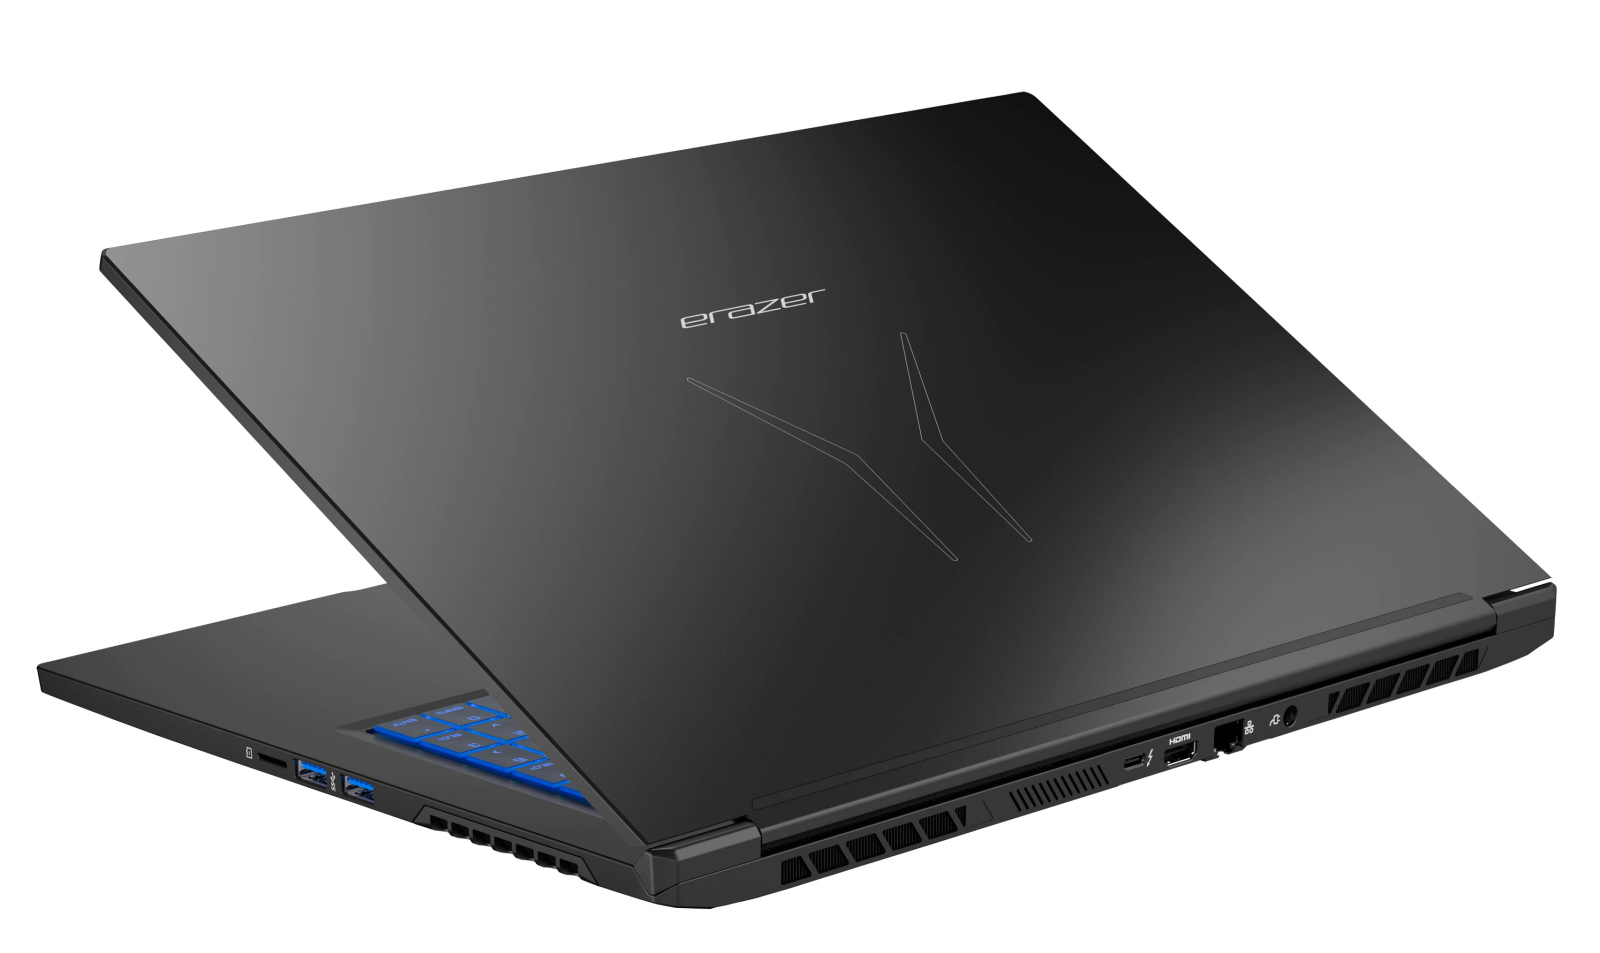
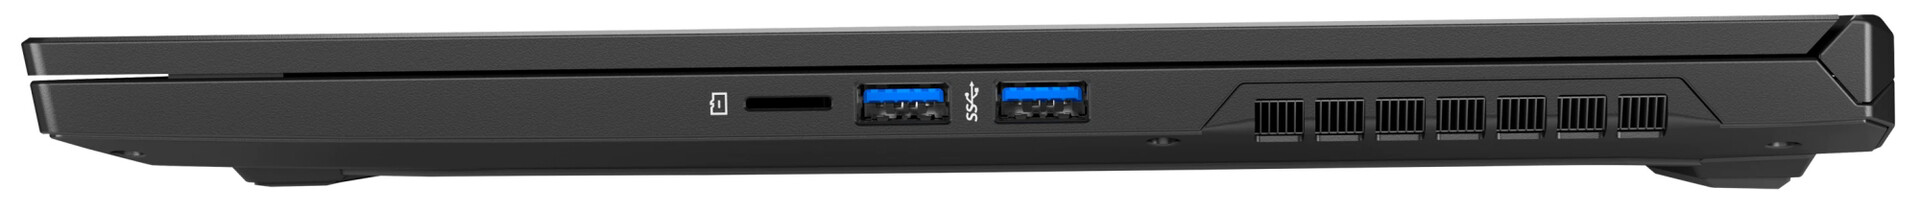
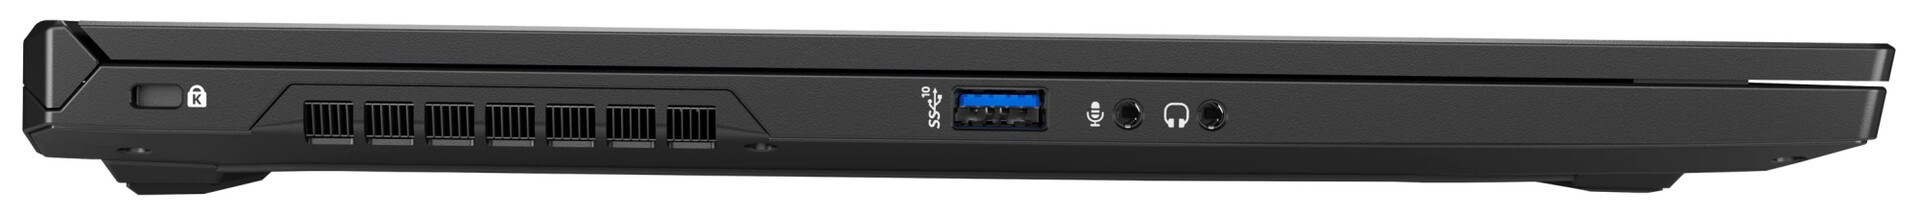
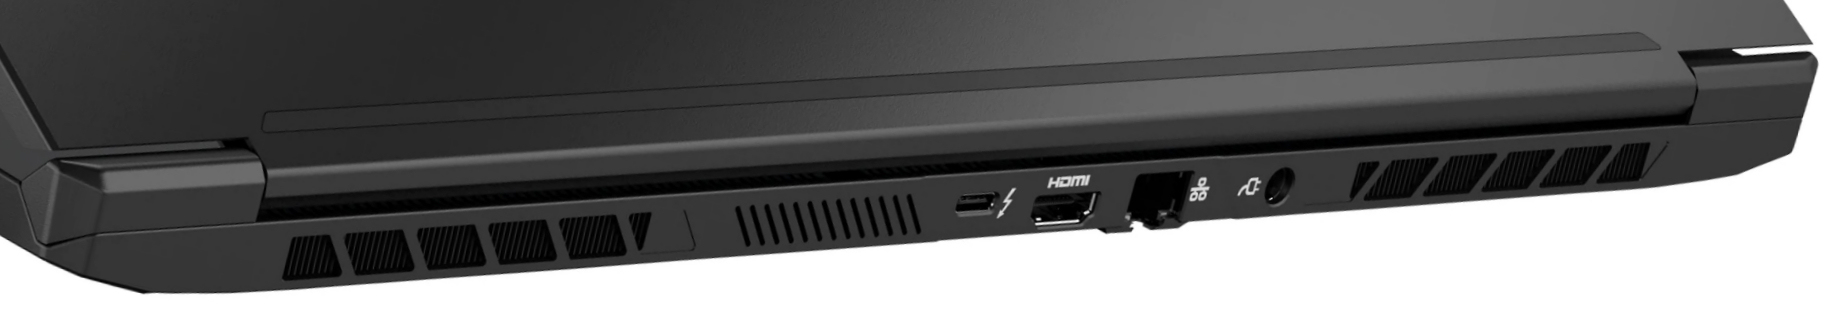
Connectivity - Thunderbolt 3 on board
The X10 offers a well-rounded interface selection. The laptop comes with three USB Type-A ports (2x USB 3.1 Gen 1, 1x USB 3.2 Gen 2) and one USB Type-C port (Thunderbolt 3). The latter supports DisplayPort via USB-C. Therefore, the laptop has two video outputs together with the HDMI 2.0 connection. The whole package is rounded off with two audio jacks (headphone output, microphone input), a Gigabit Ethernet port, and an opening for a cable lock. A microSD memory card reader is also included.
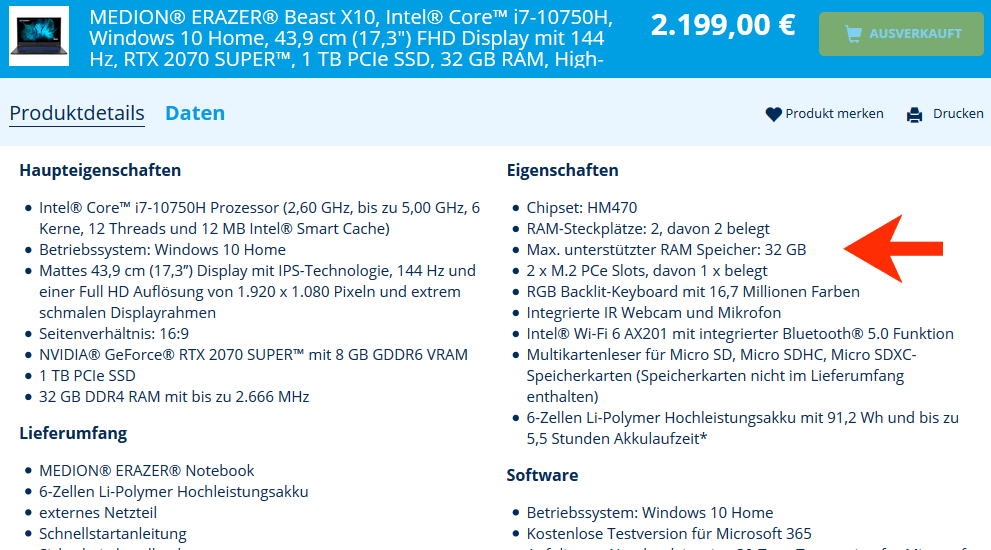
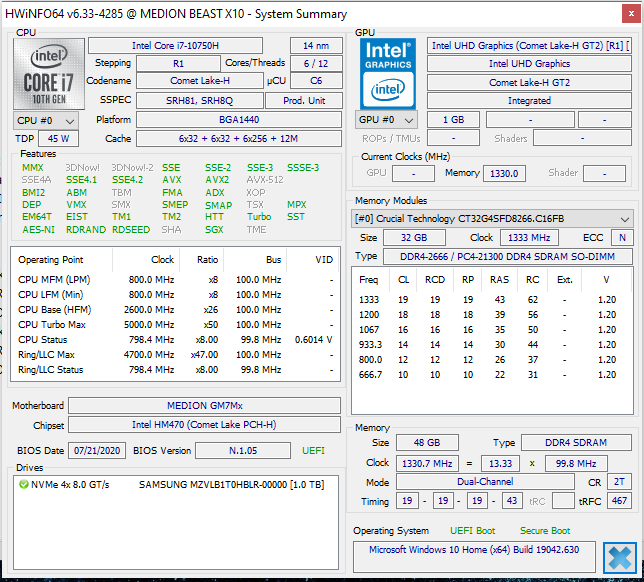
How much memory does the X10 support?
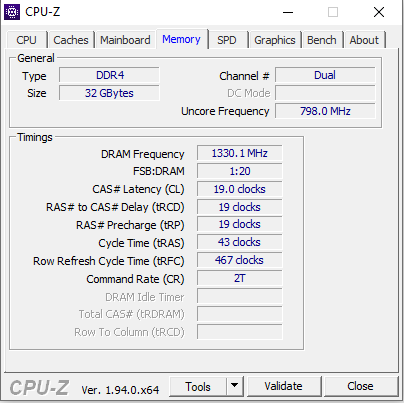
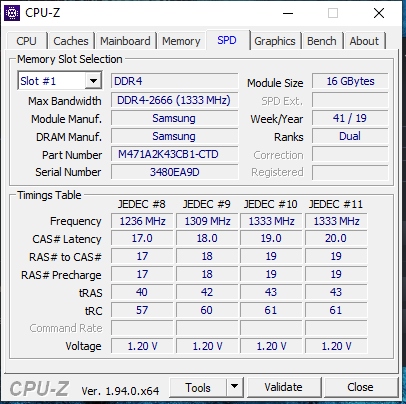
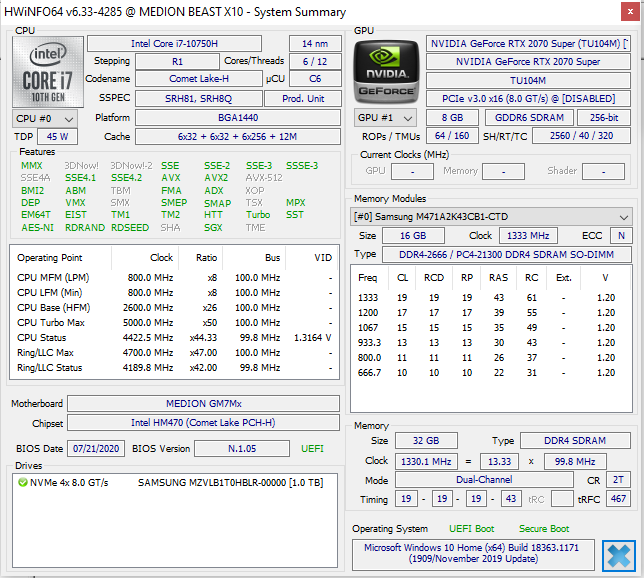
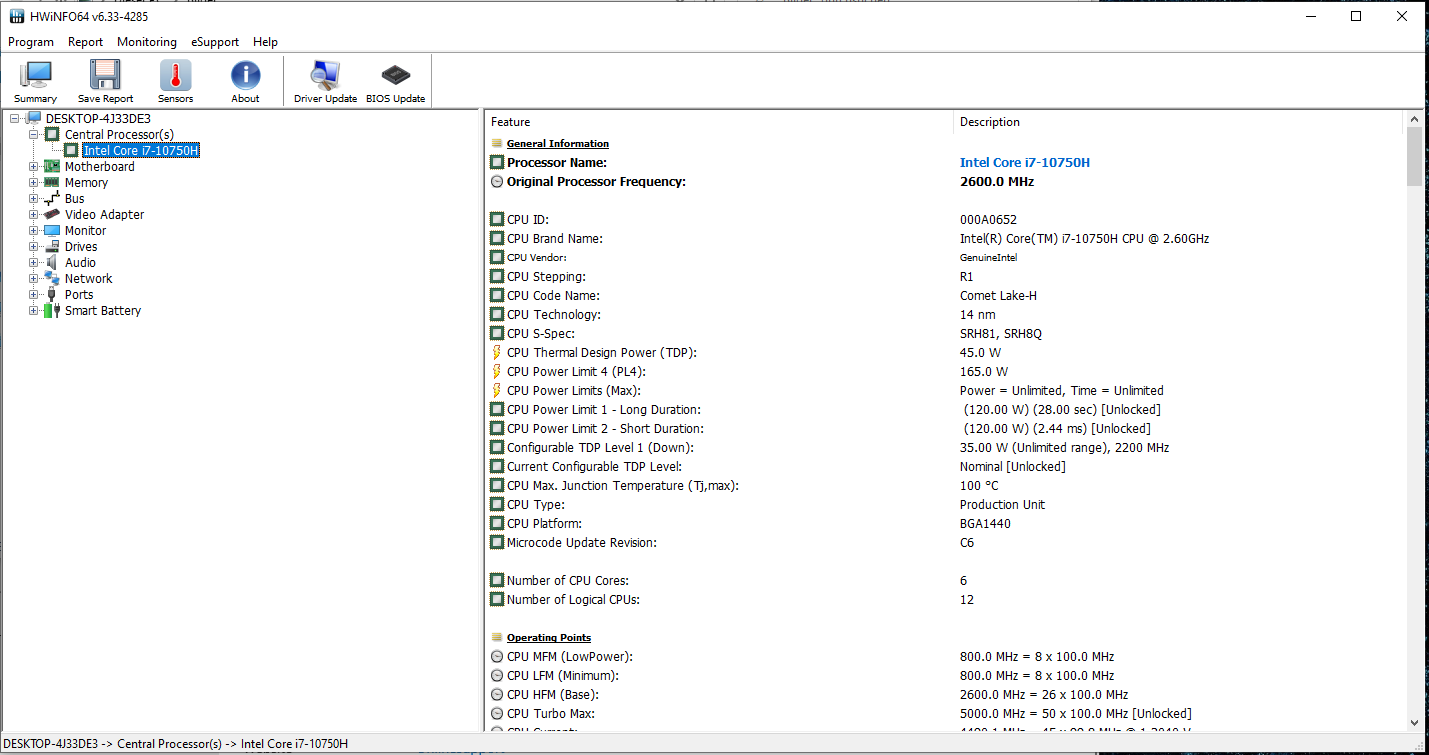
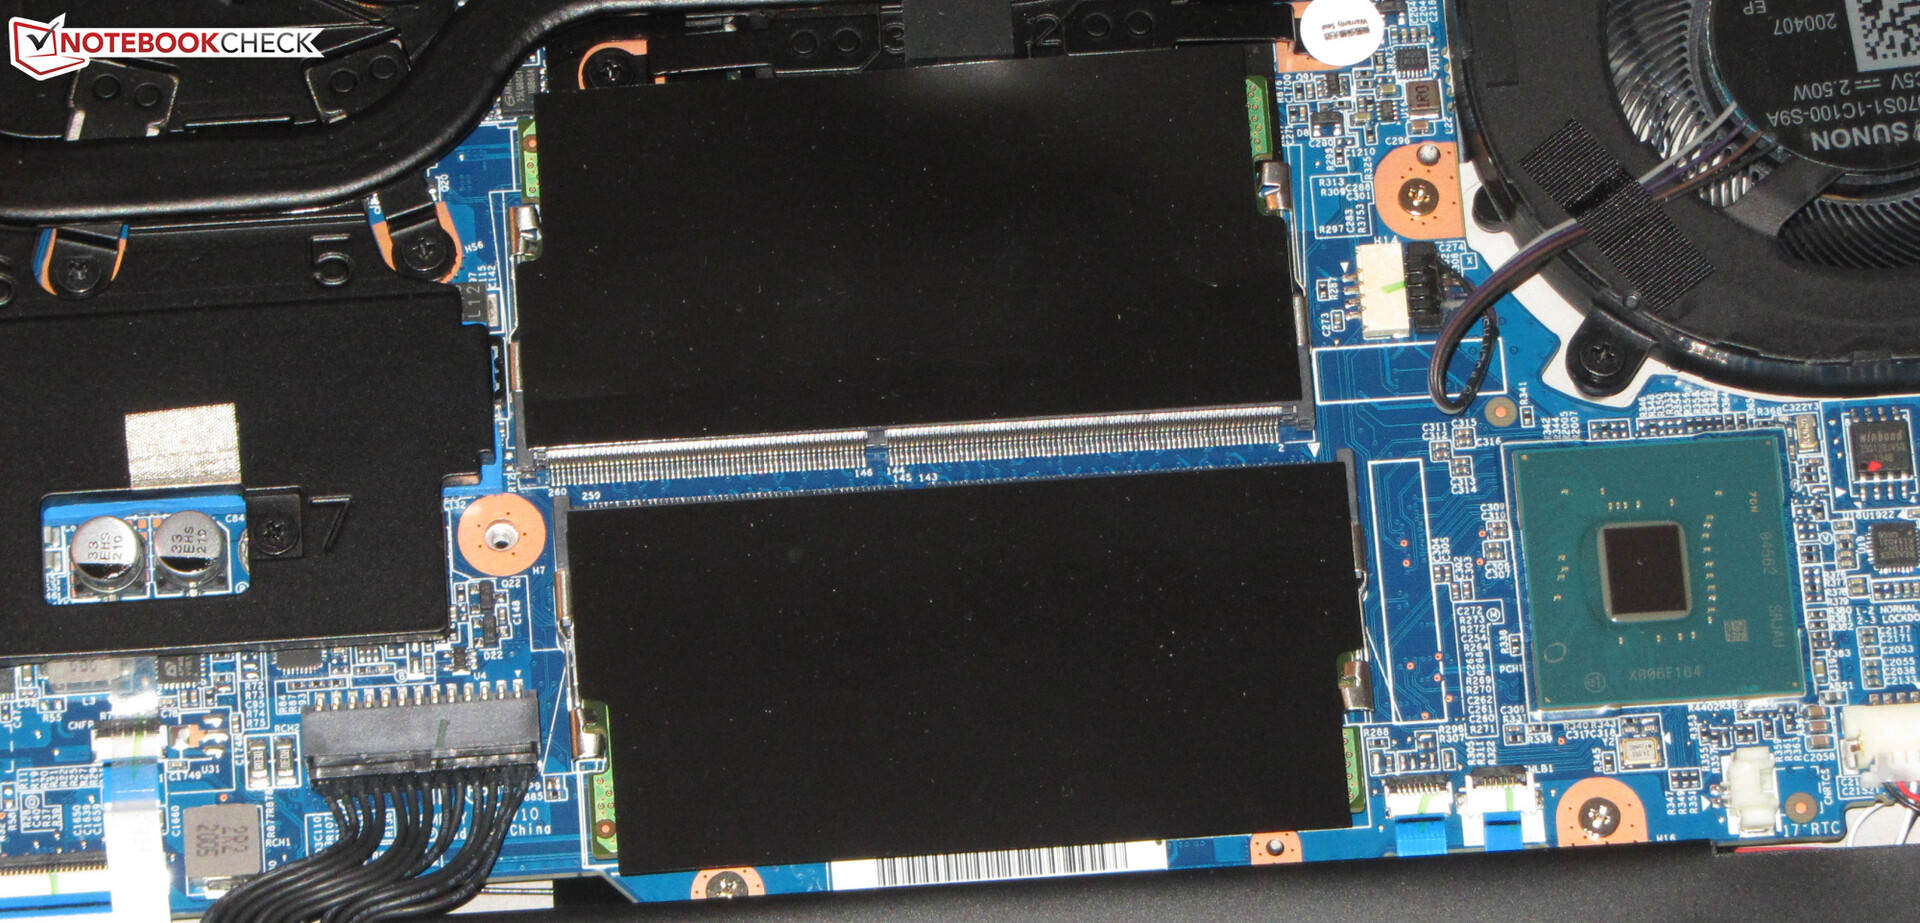
Medion's specifications regarding RAM are unclear. On the Medion website it says: "Max. supported RAM memory: 32 GB". It seems that this doesn't refer to the maximum possible amount of RAM but to the maximum size of the individual memory modules. We have successfully replaced one of the two 16 GB modules with a 32 GB module (see HWiNFO screenshot). As a result, the X10 should support up to 64 GB of RAM.
Communication
The WLAN chip (AX201) from Intel supports the 802.11a/b/g/n/ac/ax WLAN standards and offers Bluetooth 5 functionality. The transmission speeds determined under optimal conditions (no other WLAN devices nearby, short distance between laptop and server PC) are outstanding. A Gigabit controller from Realtek's well-known RTL8168/8111 family is responsible for wired network connections. It performs its tasks smoothly.
Webcam
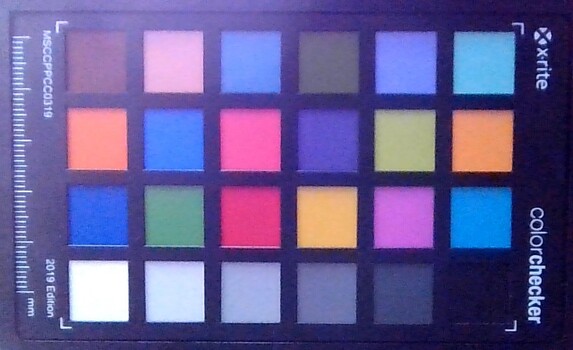
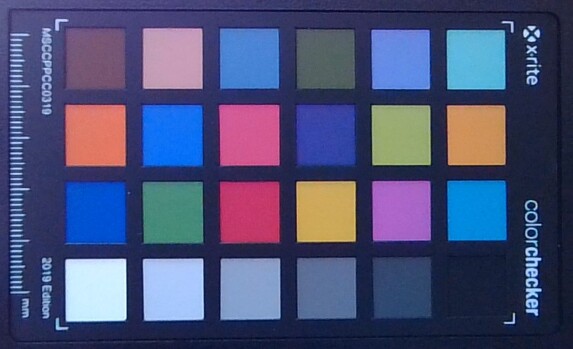
The webcam (0.9 MP; max. 1280x720 pixels) is located at the bottom of the display. It doesn't produce convincing images, since it lacks color accuracy. With a deviation of almost 20, the target (Delta E less than 3) is clearly missed.


Accessories
The laptop comes with the usual documents: A quick-start guide and warranty information.
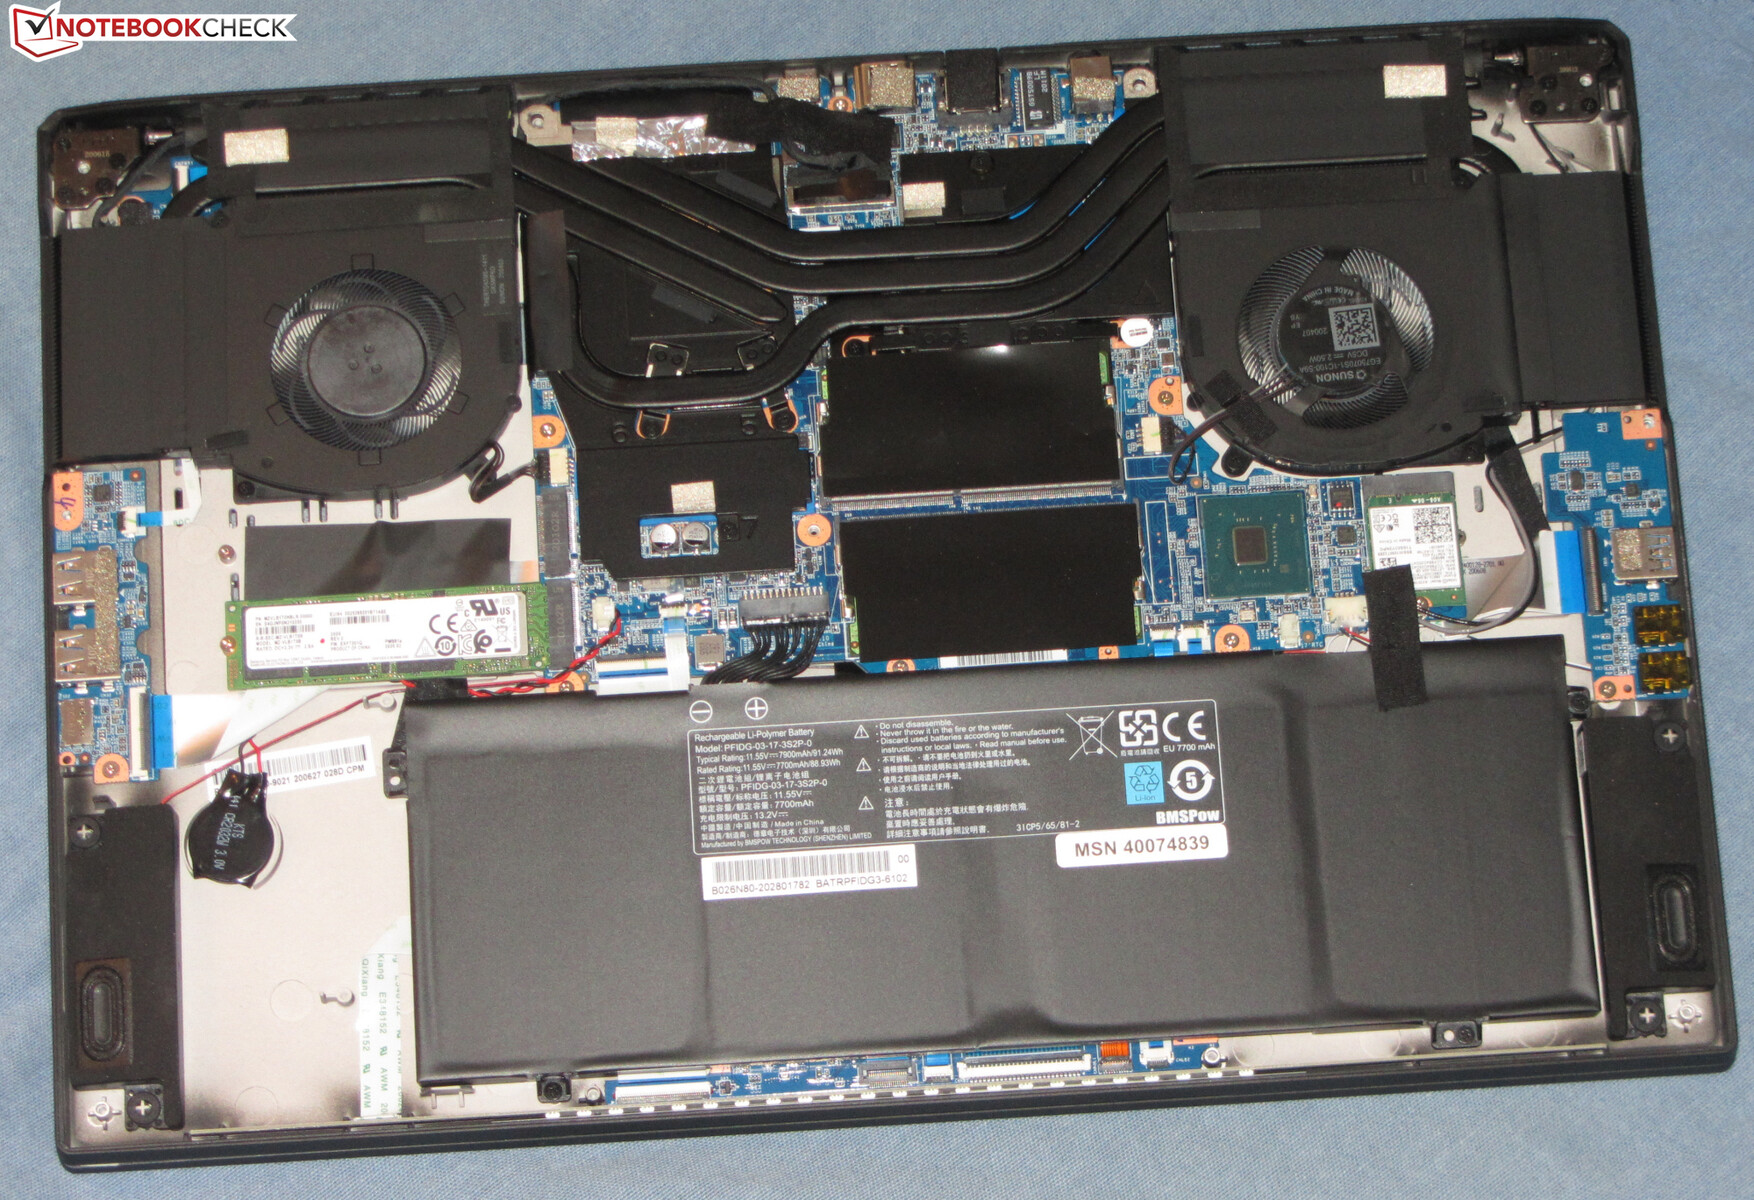
Maintenance
You can get to the inside of the laptop quite easily. After removing all screws on the underside of the device, the bottom cover can be detached. A grout finishing tool or a thin spatula can be used to loosen the clamps securing the bottom cover; it sits quite tightly in some places. Afterwards, you have access to the two memory slots (both occupied), the two M.2 2280 slots (one occupied), the WLAN module, the BIOS battery, and the rechargeable battery.
Warranty
Medion grants the Erazer a two-year warranty. Warranty extensions are not available.
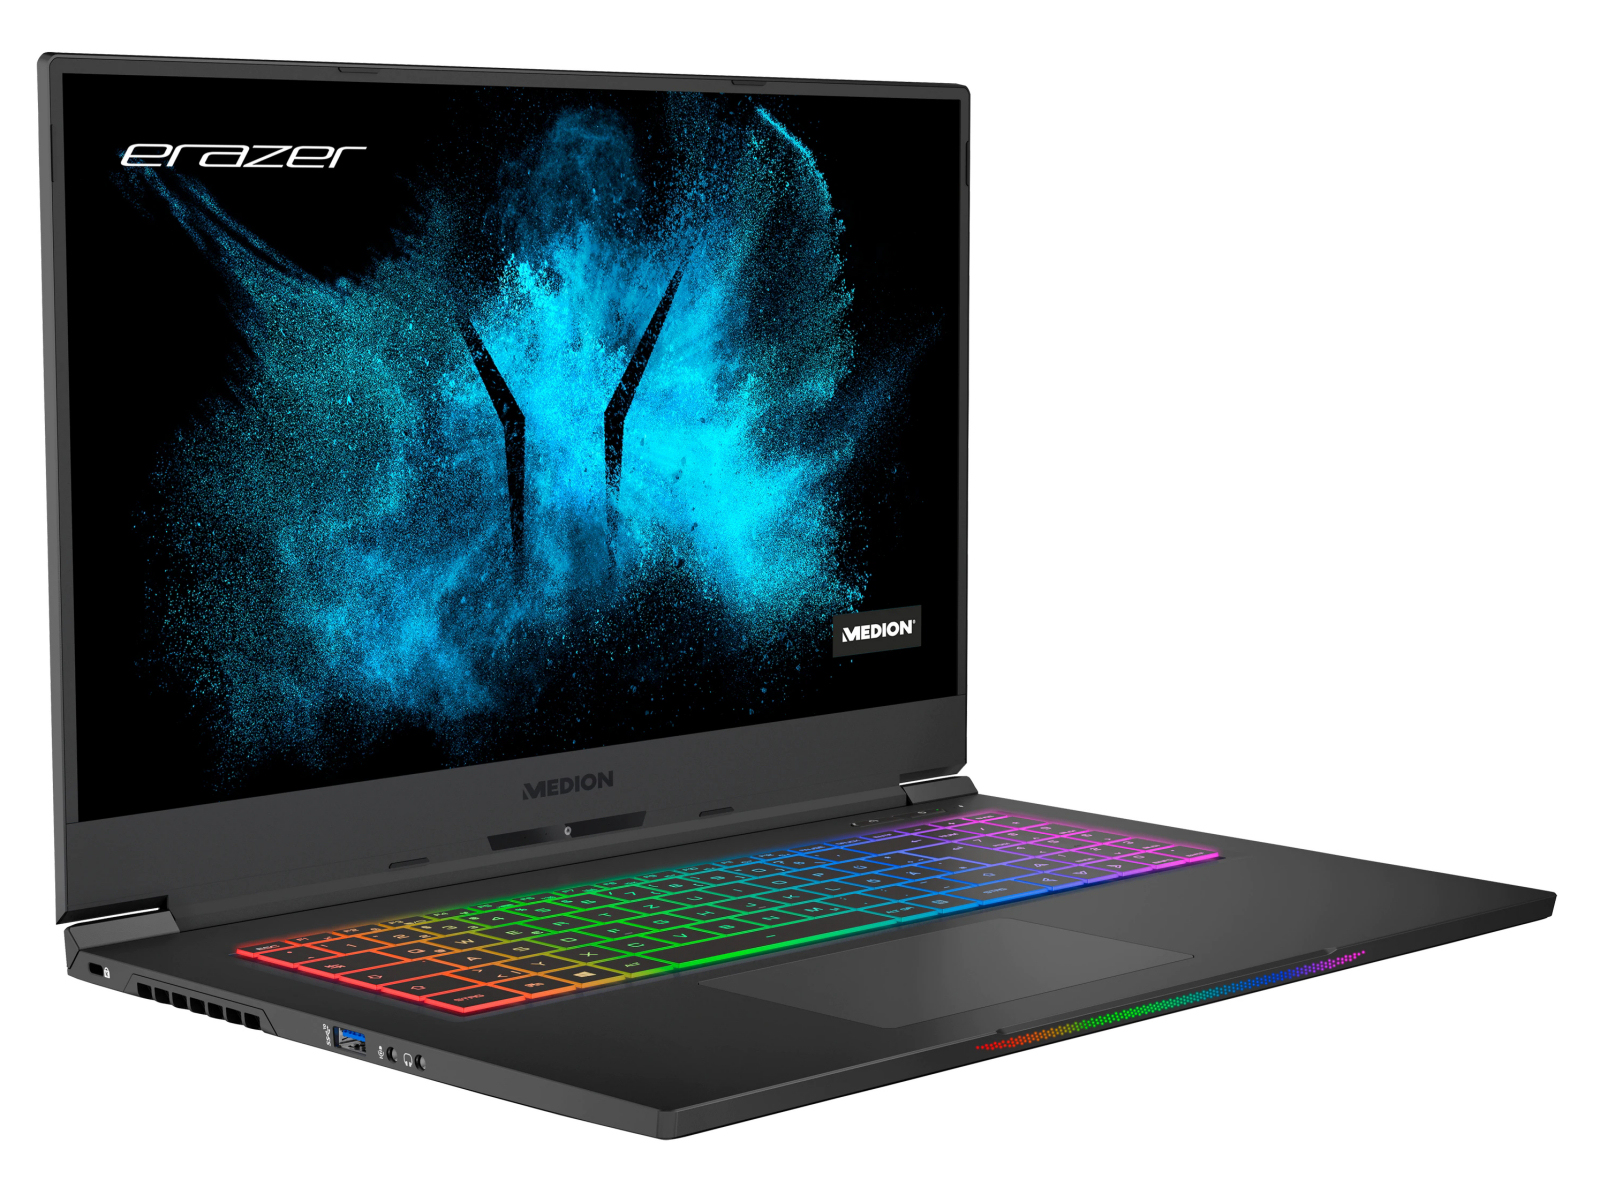
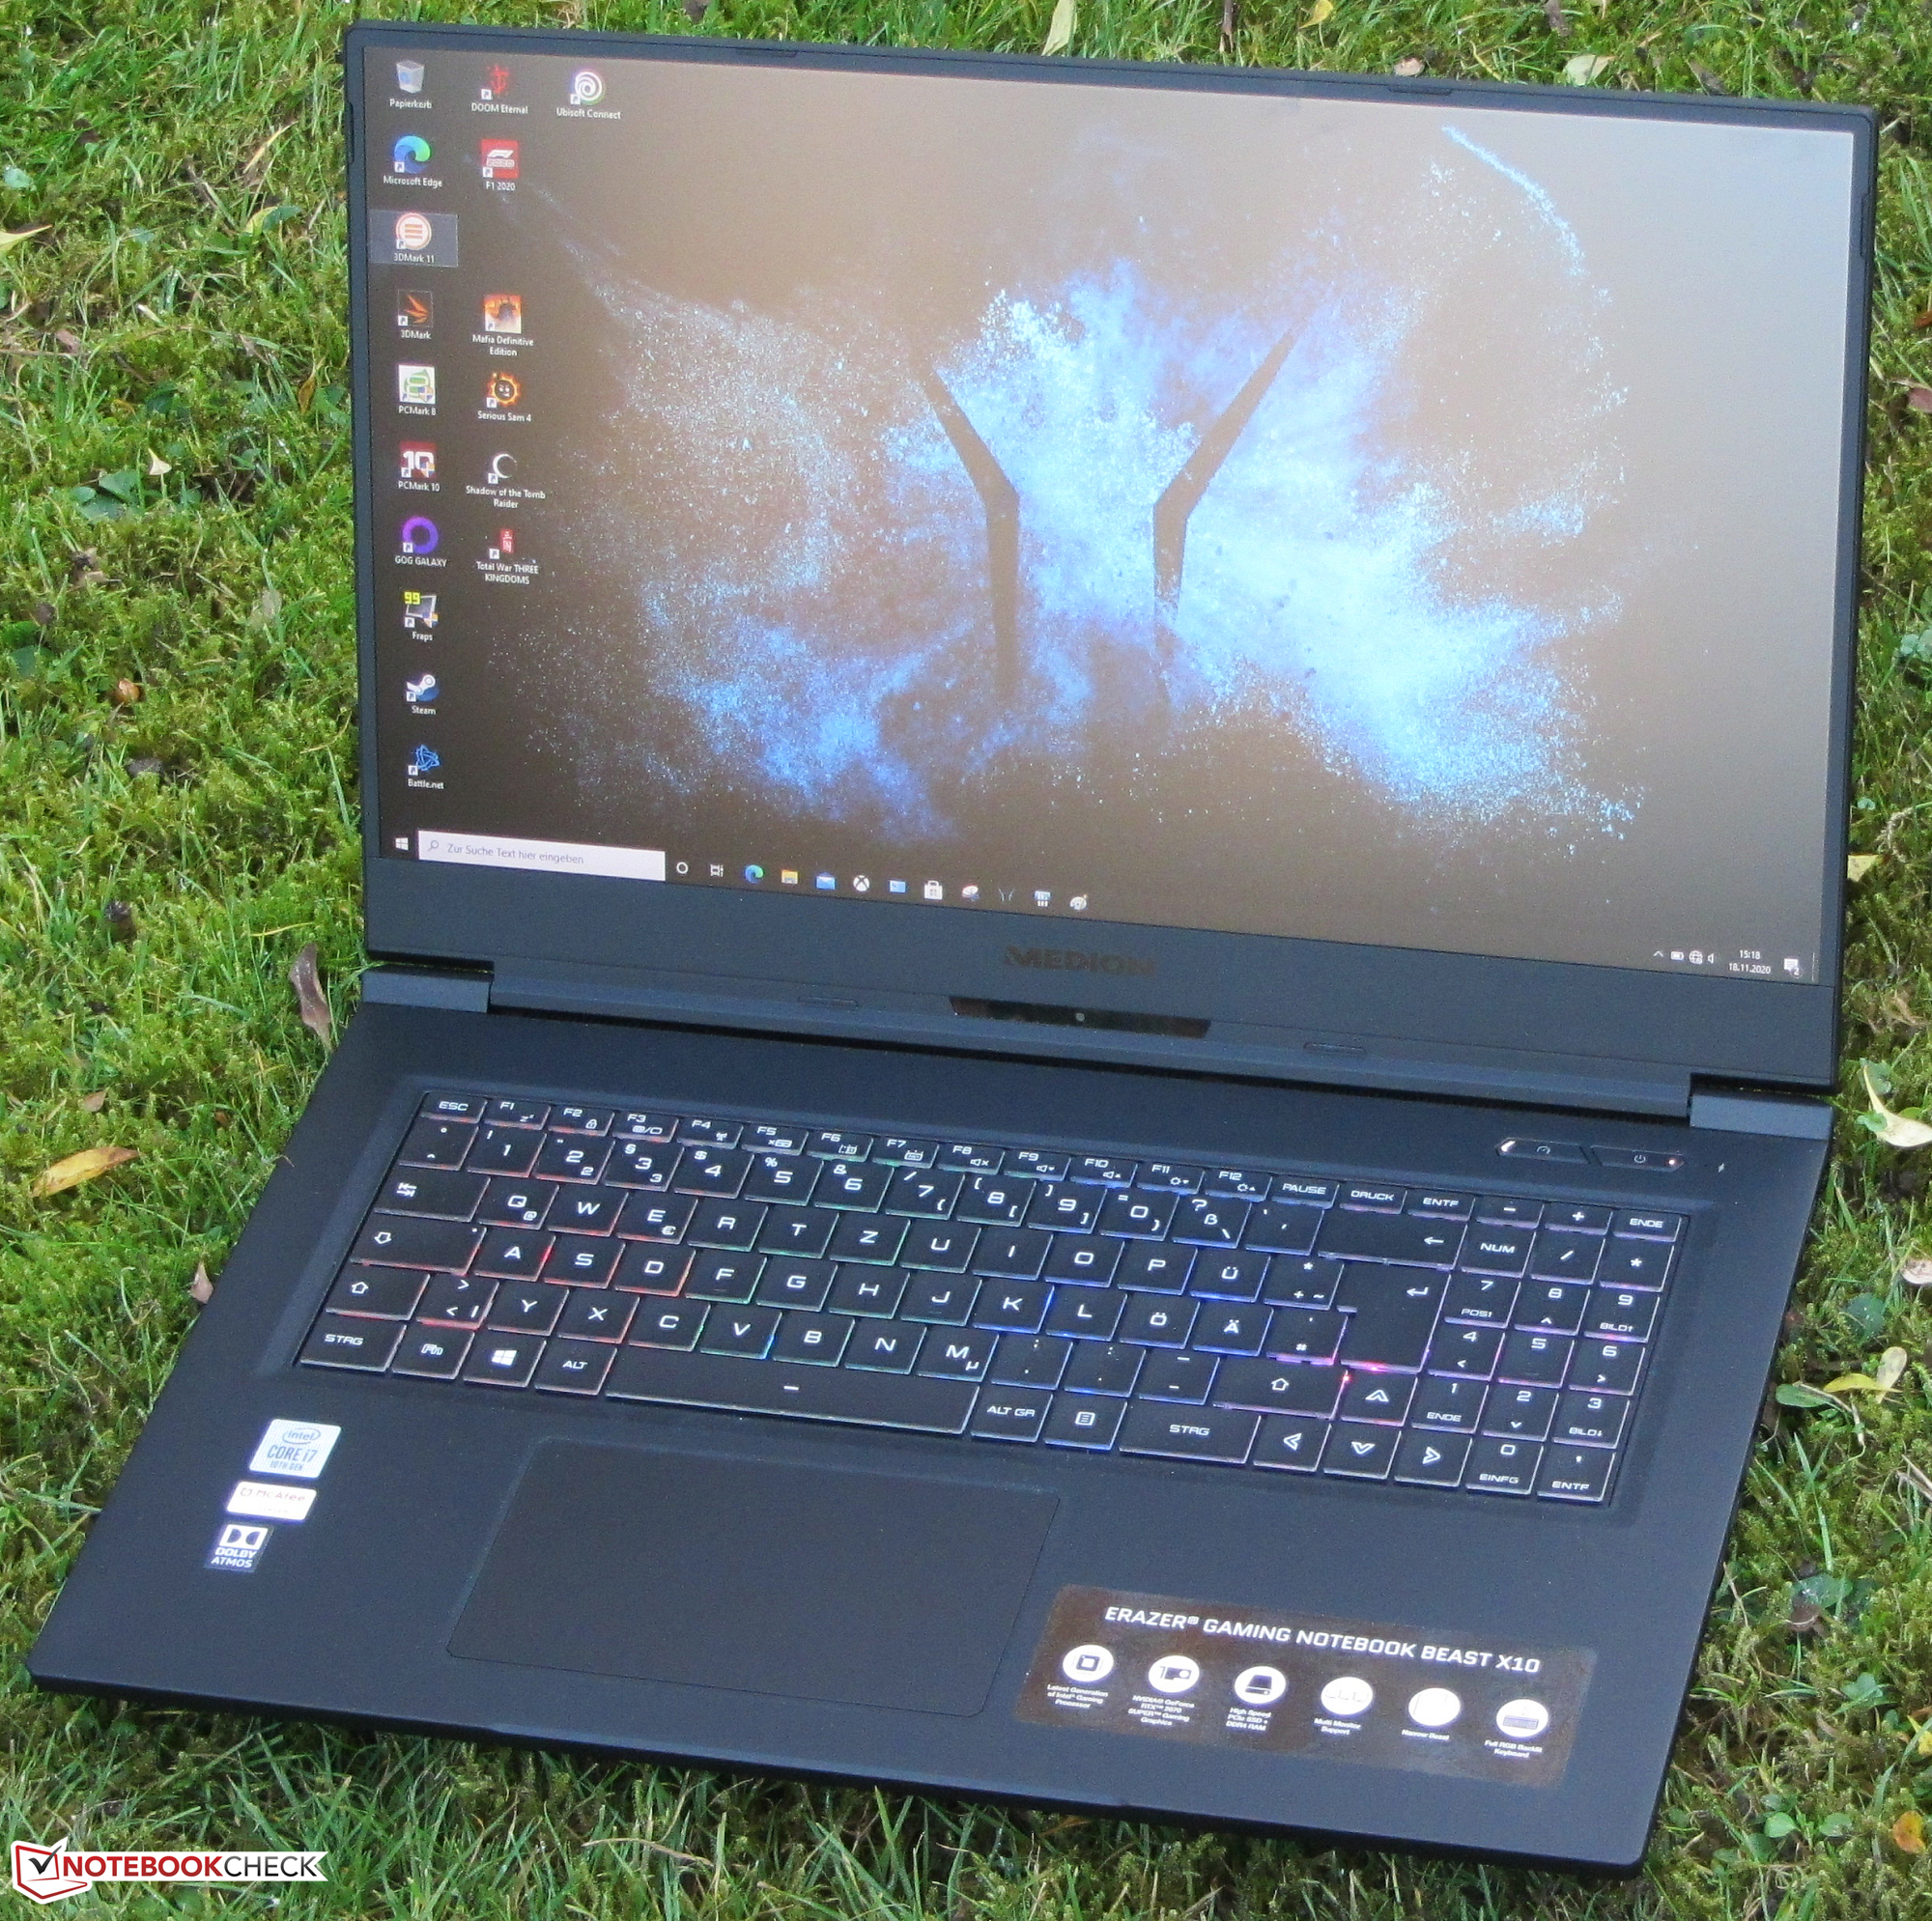
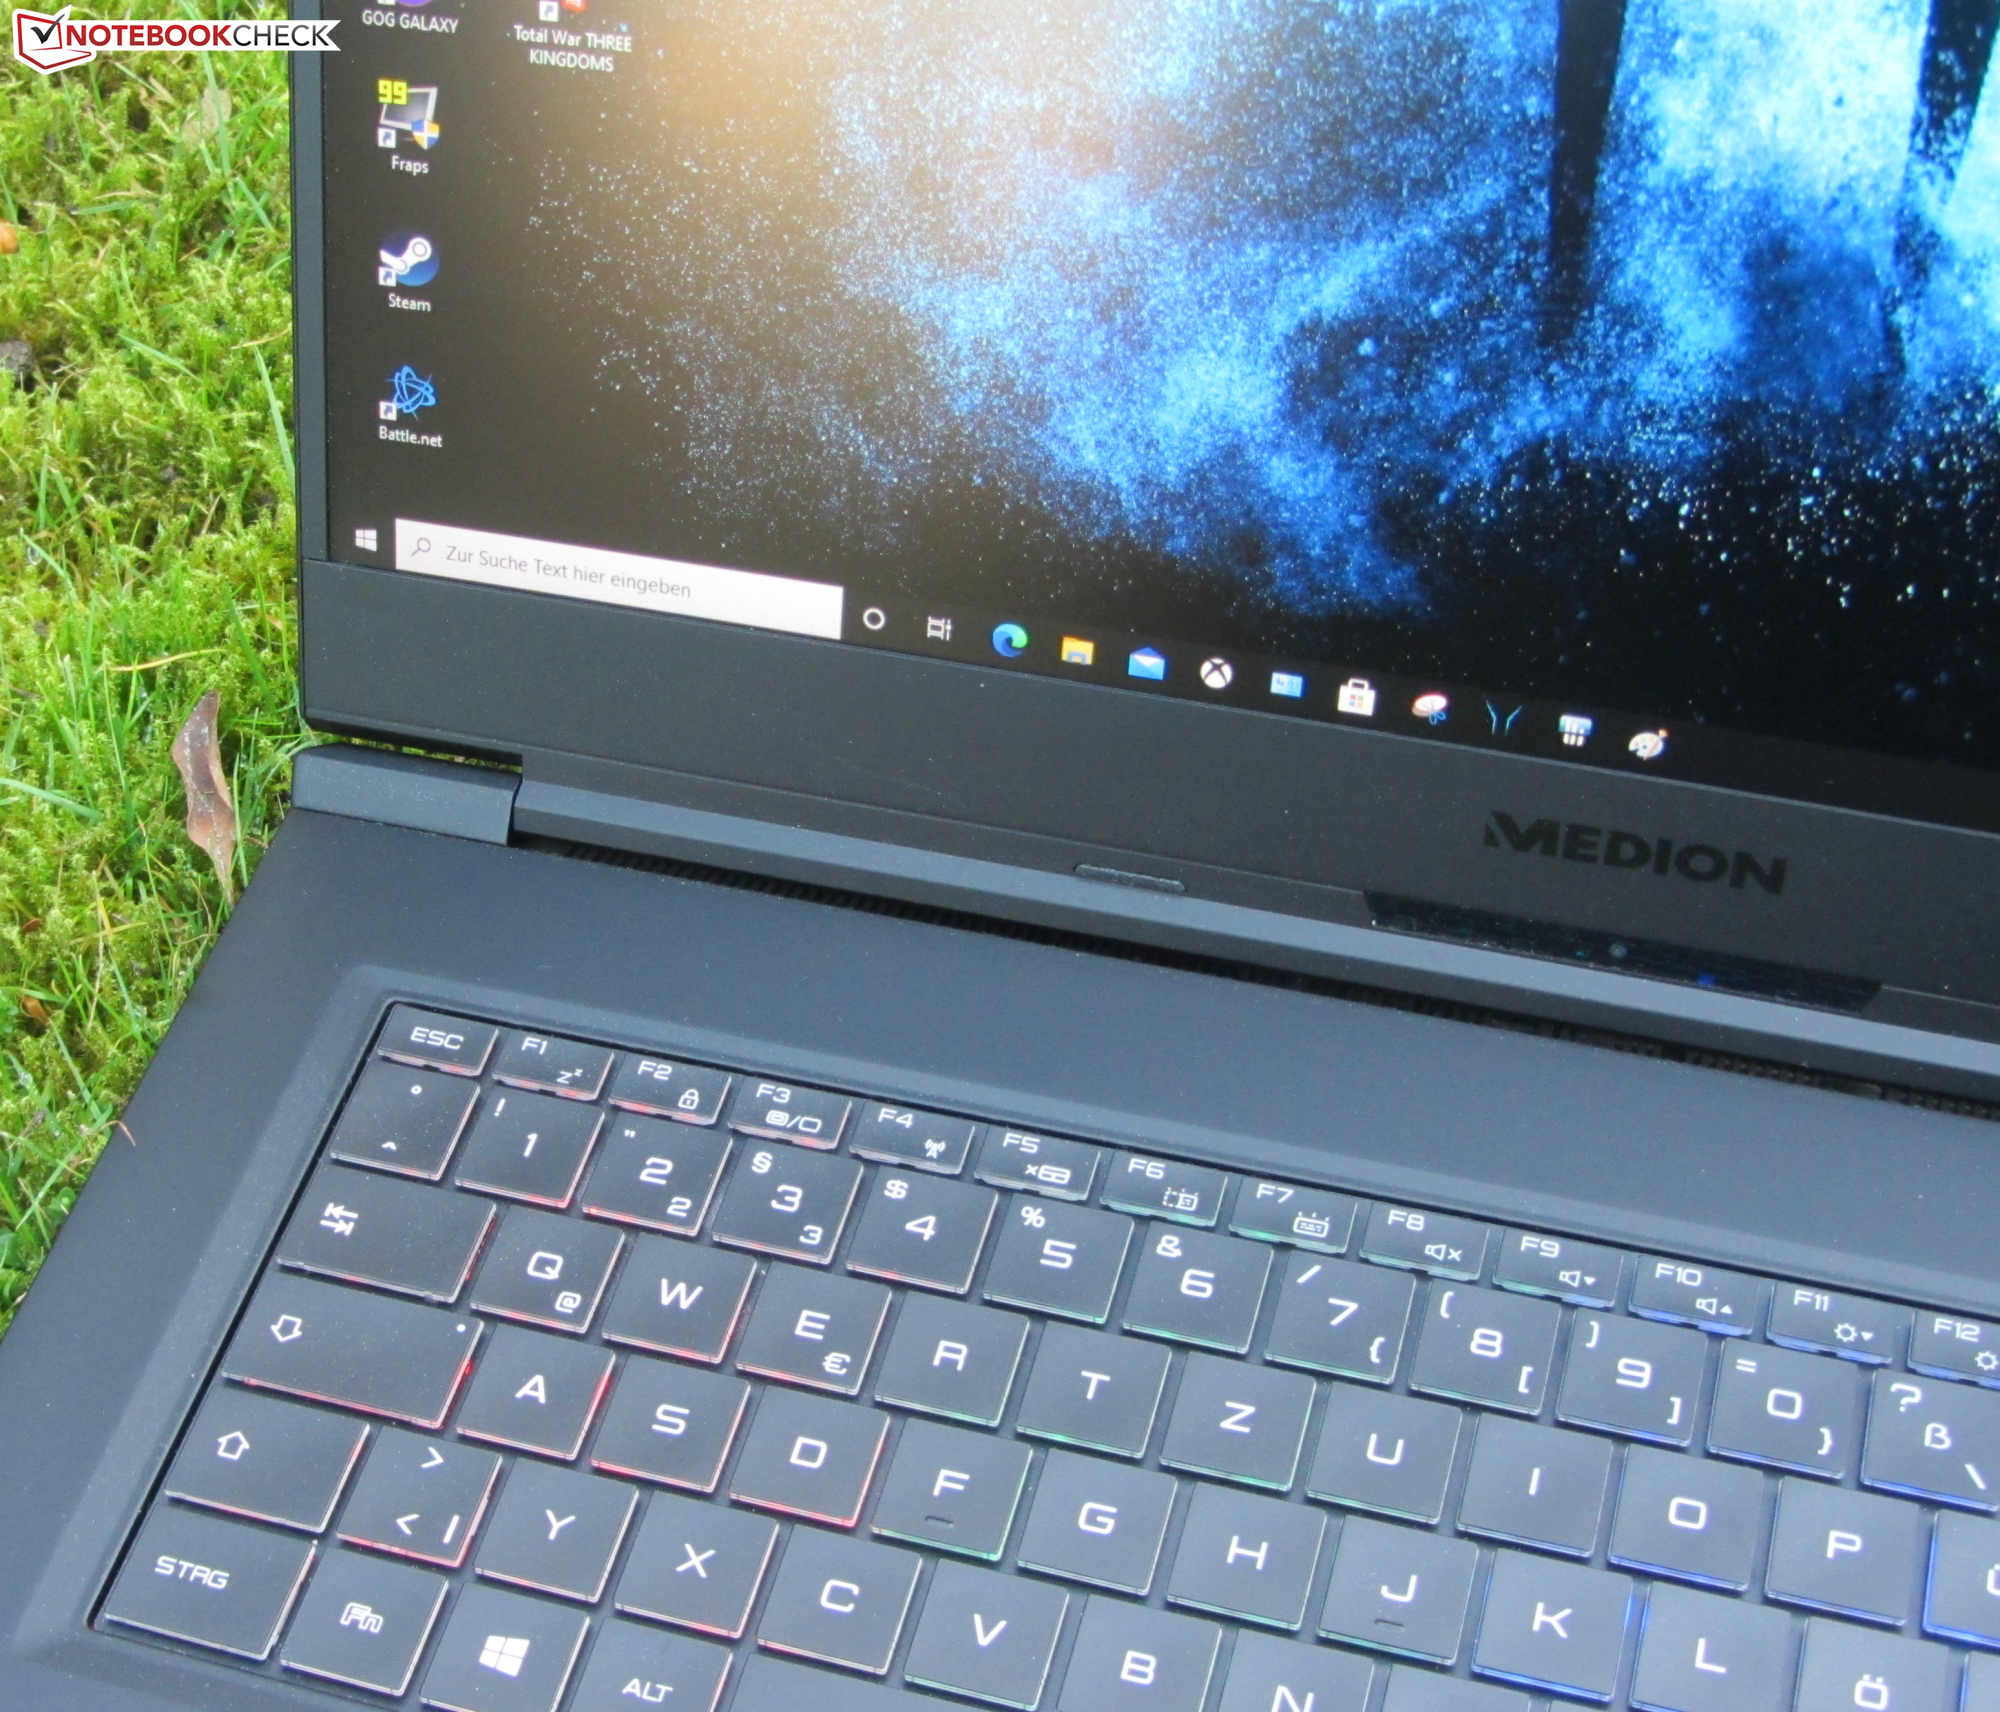
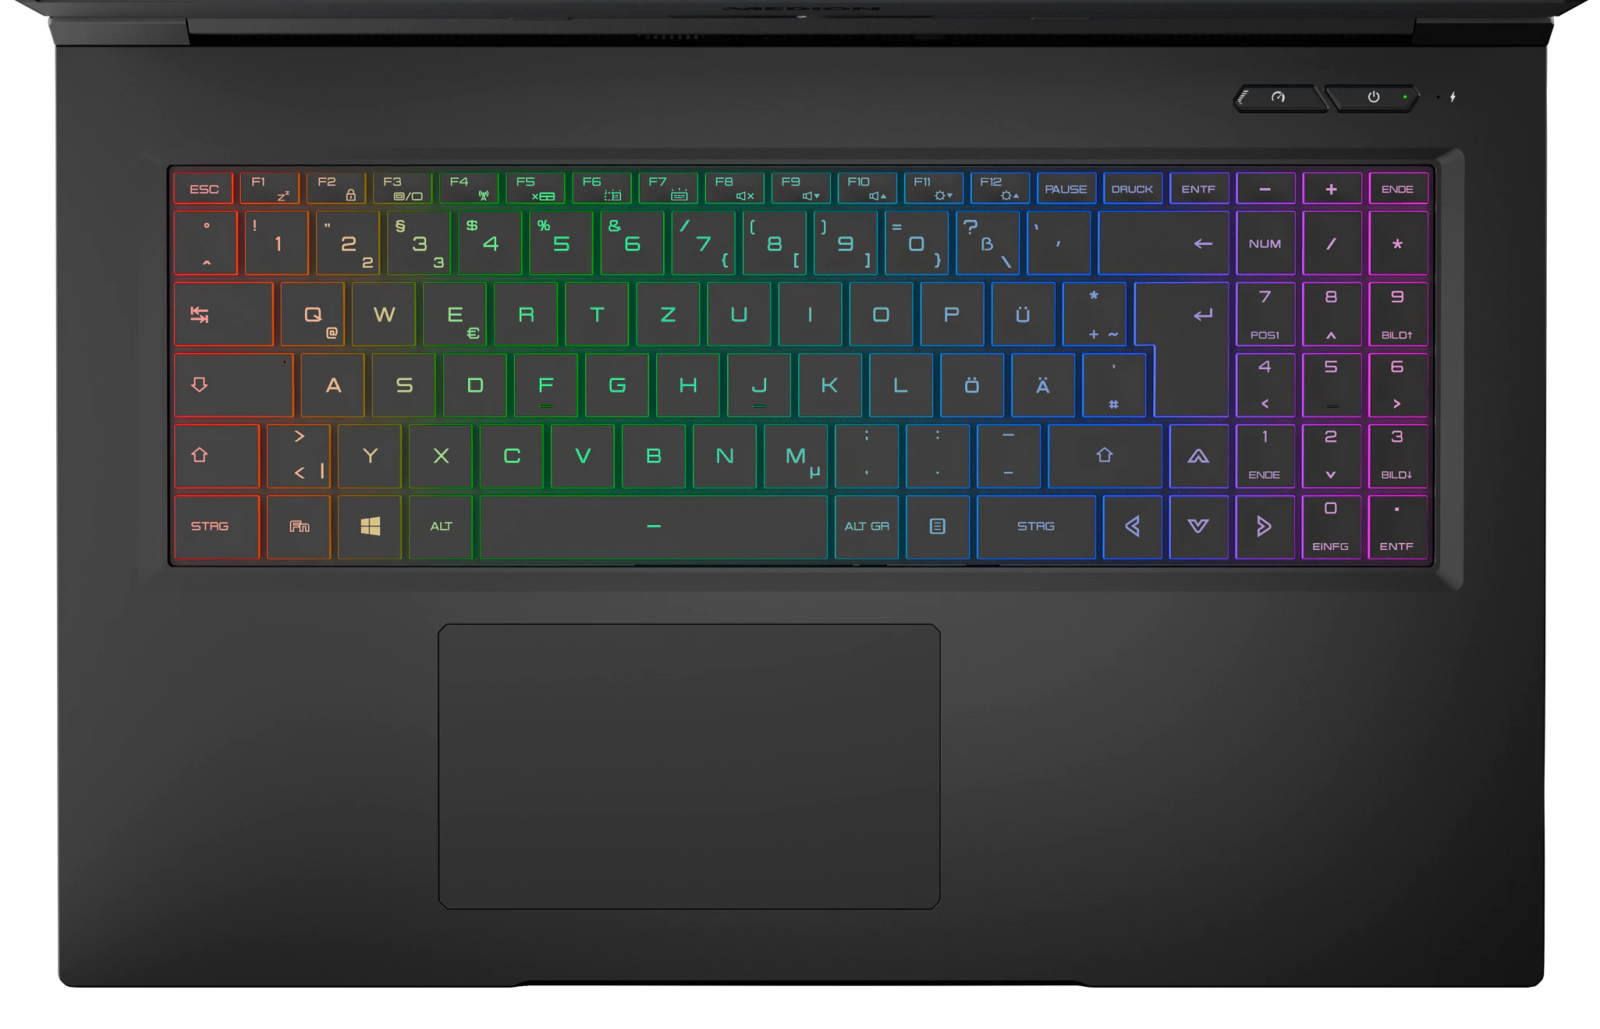
Input devices - Chiclet keyboard with RGB backlighting
Keyboard
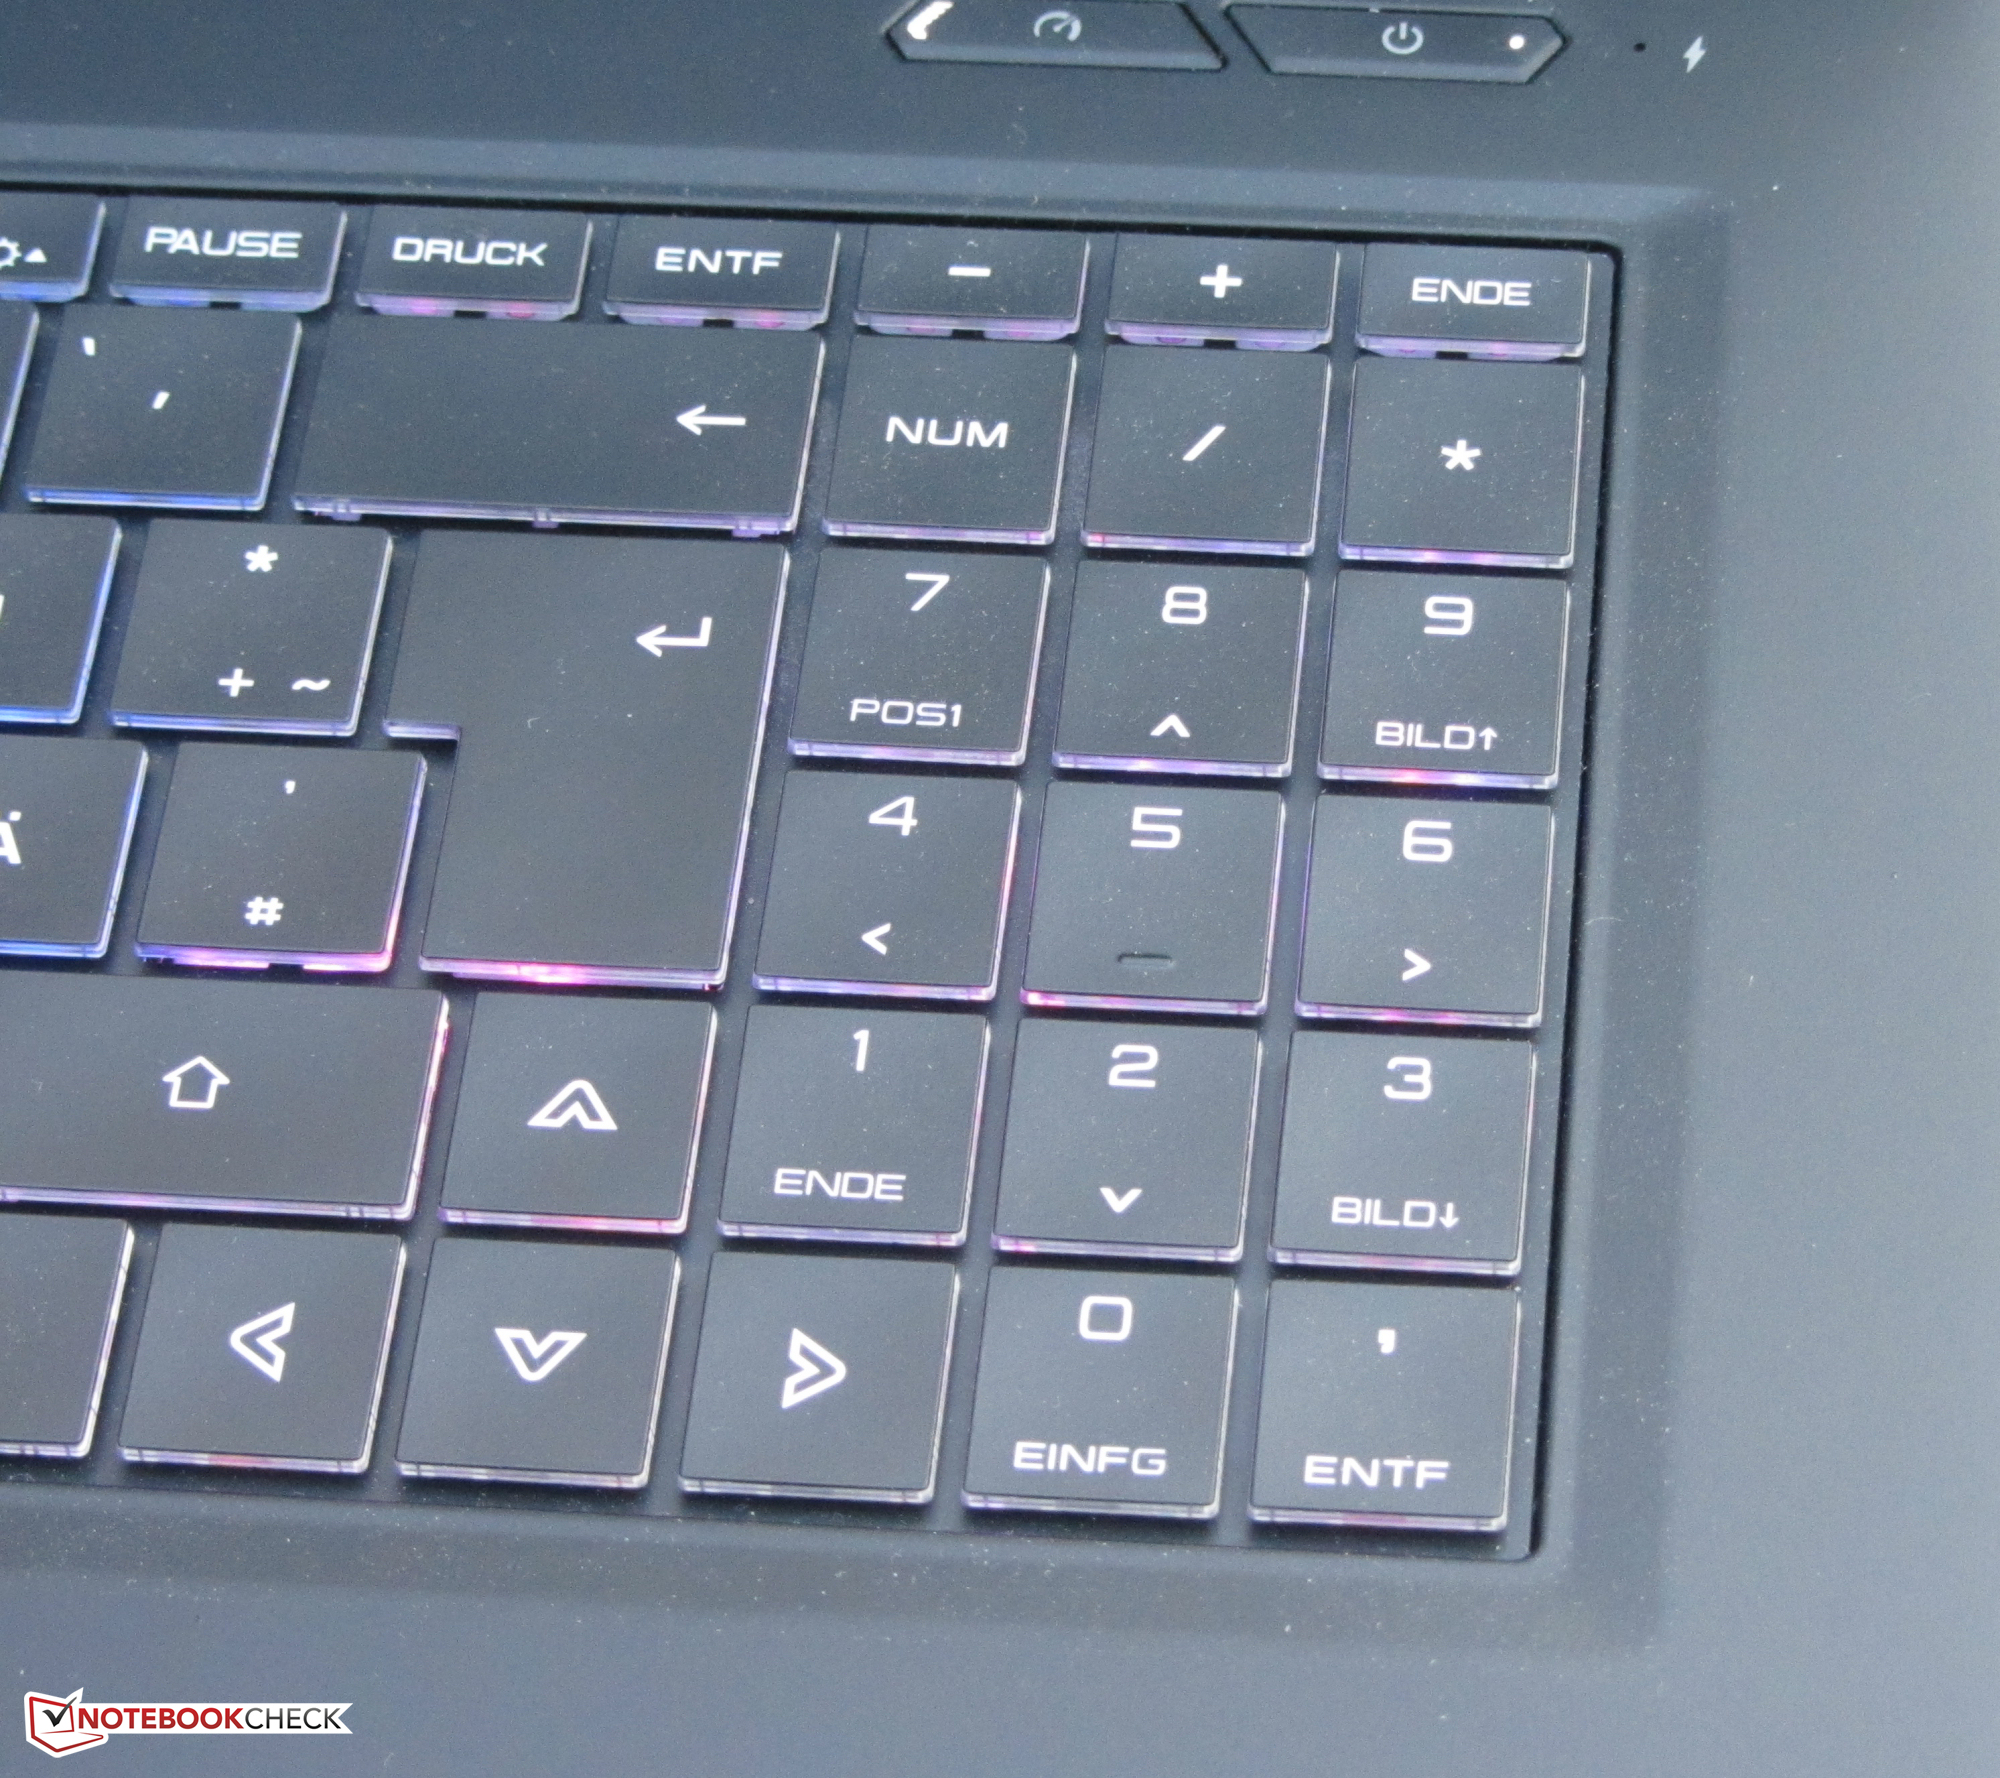
The X10 has a backlit chiclet keyboard on board; its concave keys offer a short travel and a clear pressure point. The keys sit quite close together (distance: Approx. 2 mm). The main keys are fairly large, measuring about 16 x 16 mm. Good: The keyboard doesn't yield during typing. All in all, Medion delivers a keyboard suitable for everyday use here.
Touchpad
The multi-touch capable ClickPad takes up an area of about 13.2 x 7.4 cm. The smooth surface doesn't hinder the fingers' ability to glide. The pad reacts precisely to input - even in the corners. It offers a short travel and a clear pressure point.
Display - 144 Hz IPS
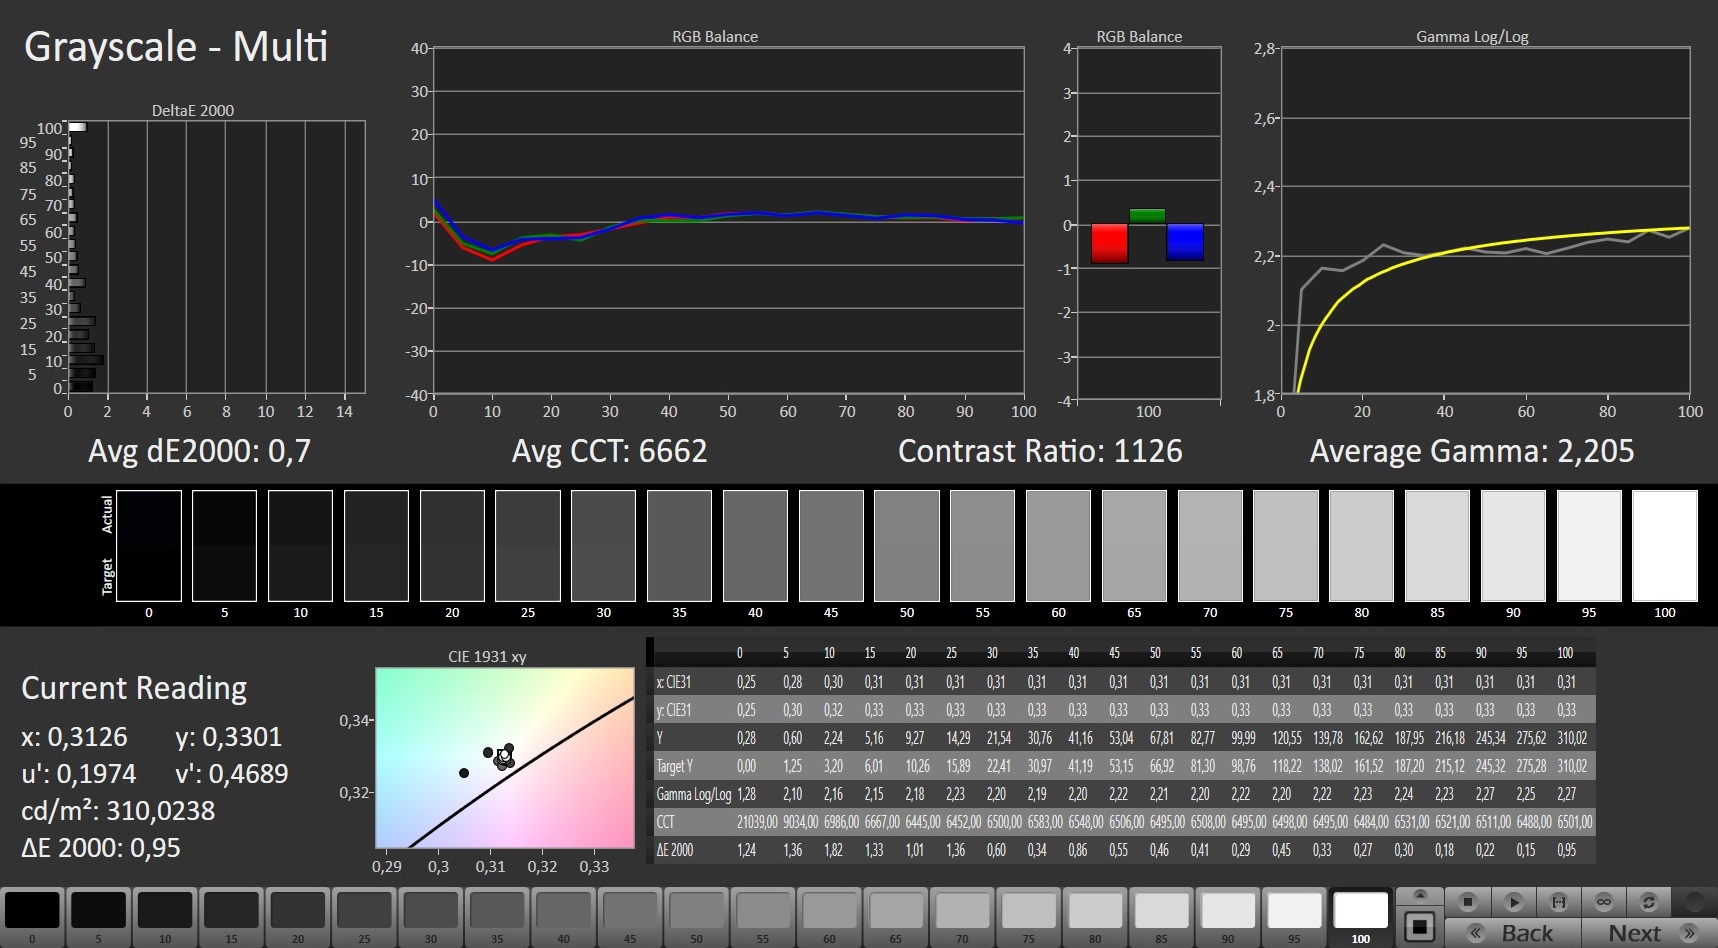
The matte 17.3-inch display of the Beast X10 has a native resolution of 1920x1080 pixels. Brightness (297.3 cd/m²) and contrast (1,159:1) are at a fairly good level. Positive: The display shows no PWM flickering. Moreover, the response times of the 144 Hz panel are in order.
| |||||||||||||||||||||||||
Brightness Distribution: 88 %
Center on Battery: 313 cd/m²
Contrast: 1159:1 (Black: 0.27 cd/m²)
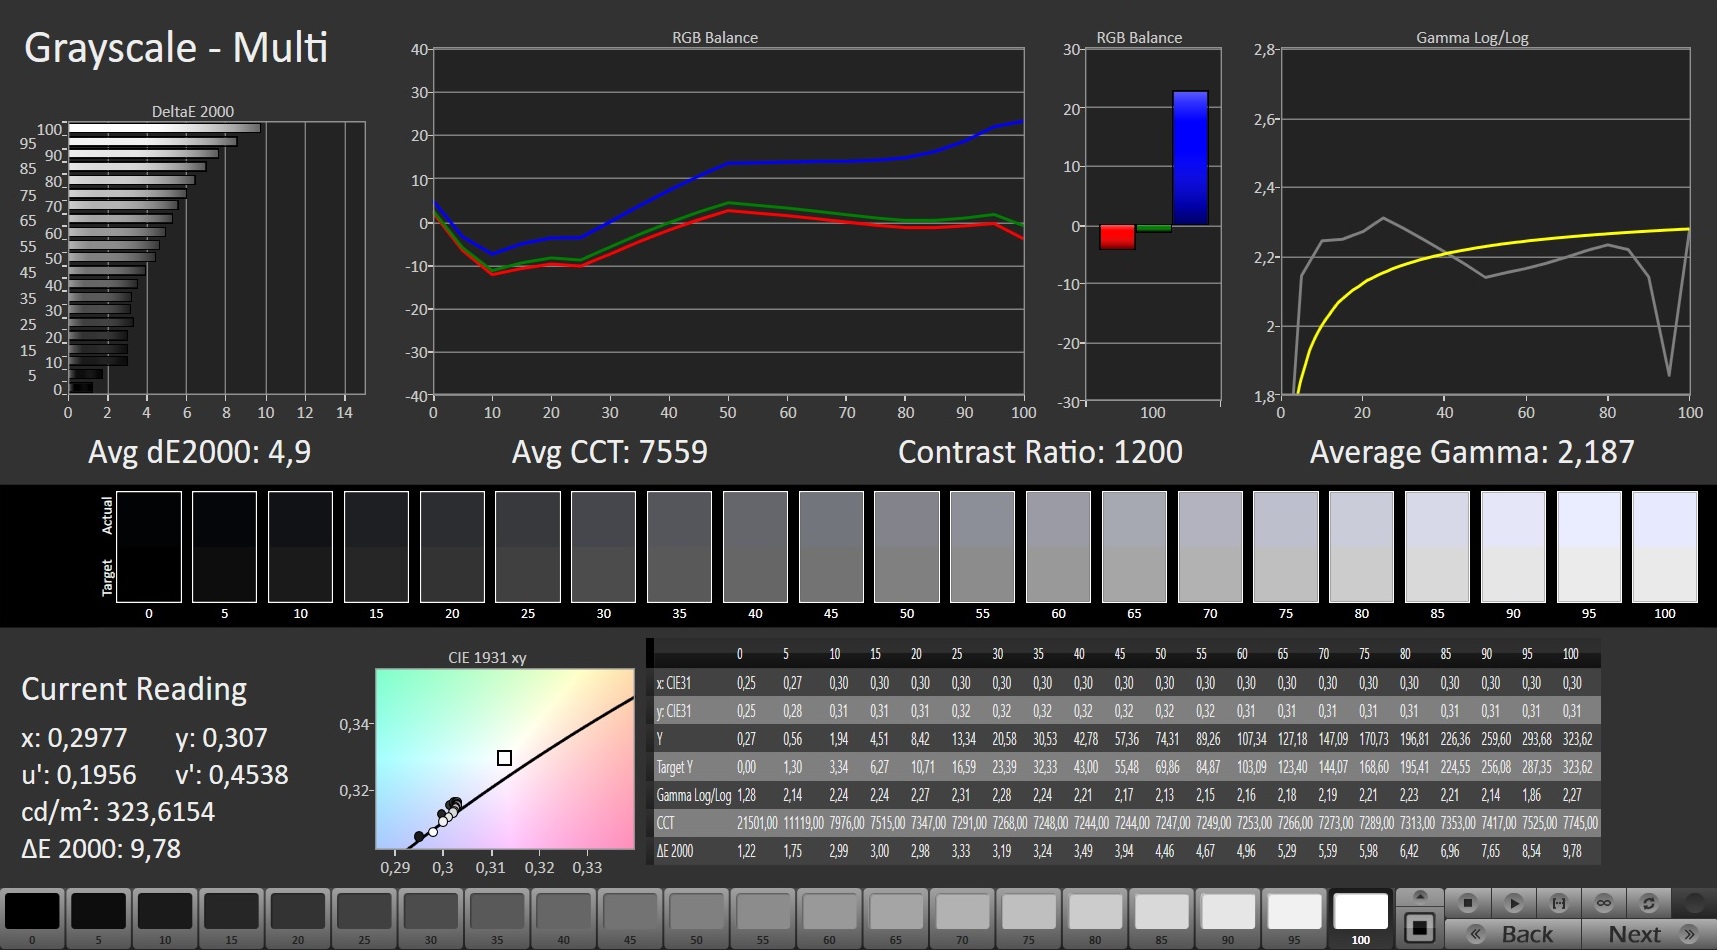
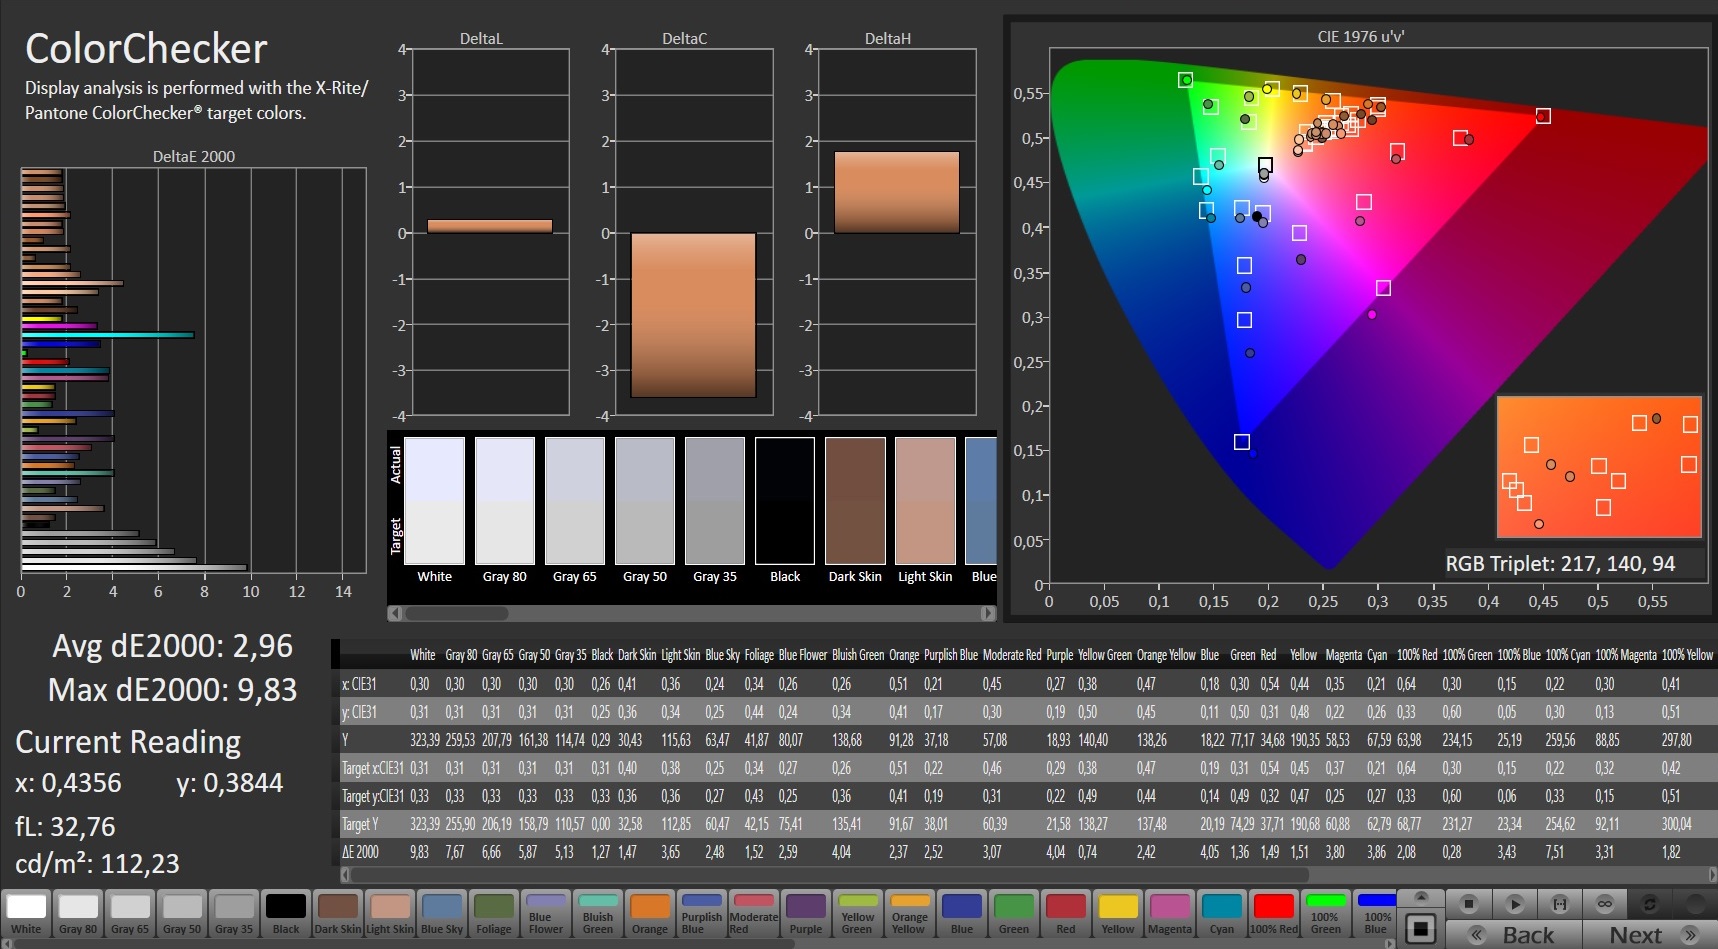
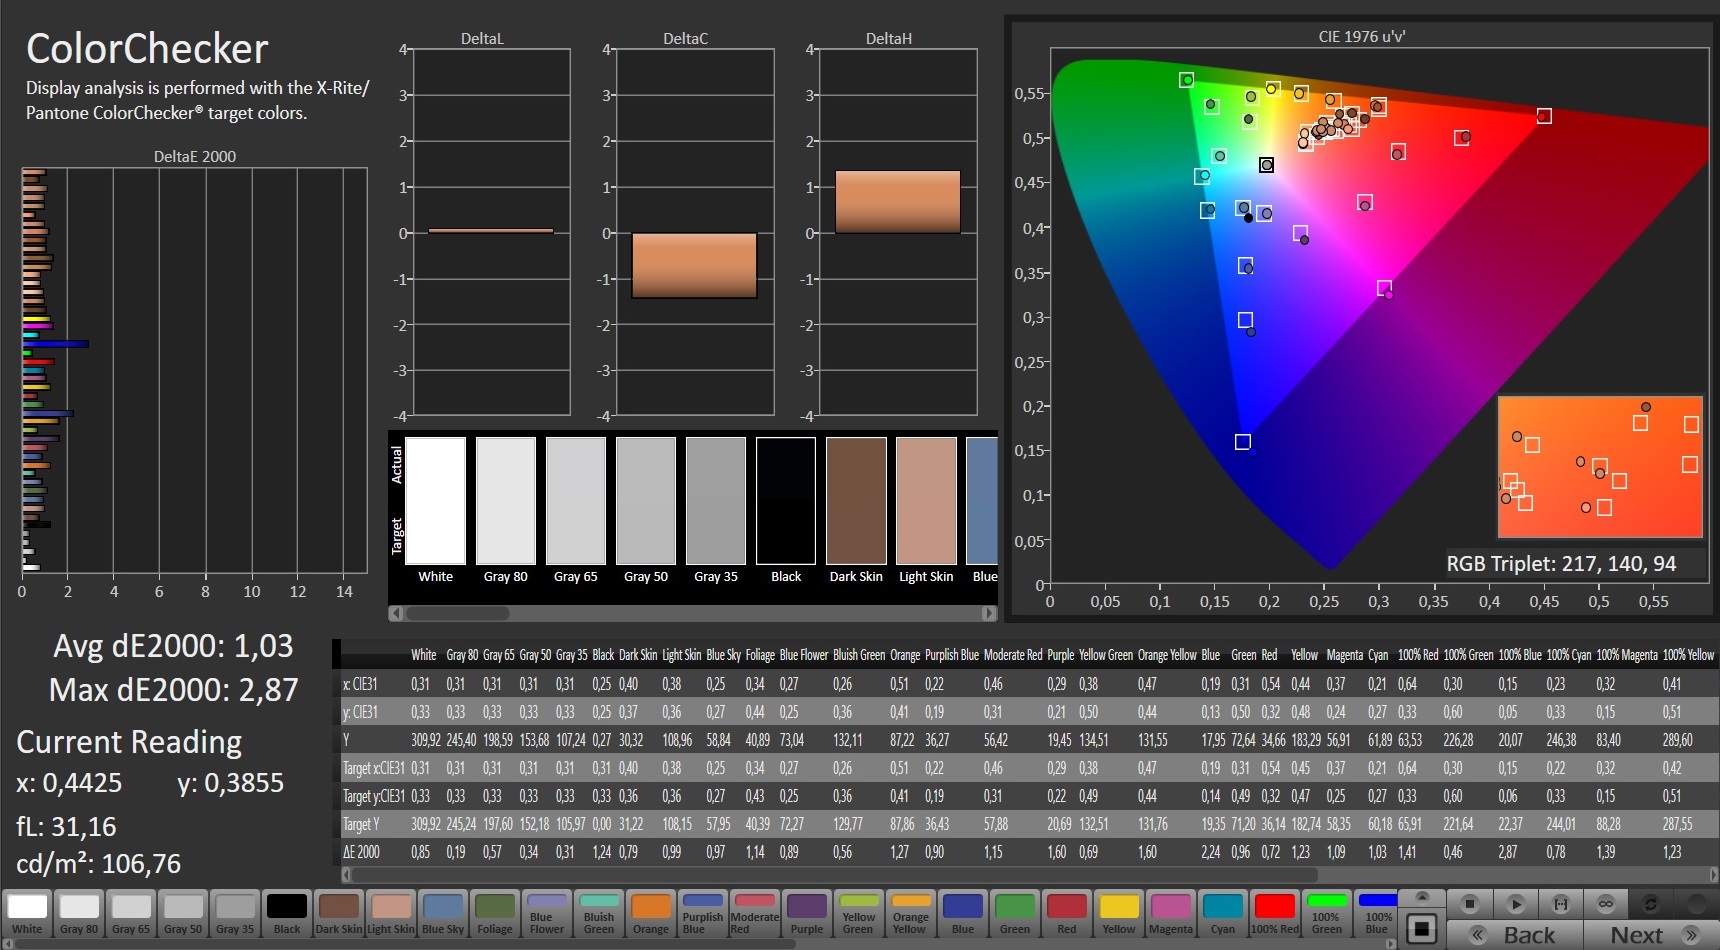
ΔE Color 2.96 | 0.5-29.43 Ø5, calibrated: 1.03
ΔE Greyscale 4.9 | 0.57-98 Ø5.3
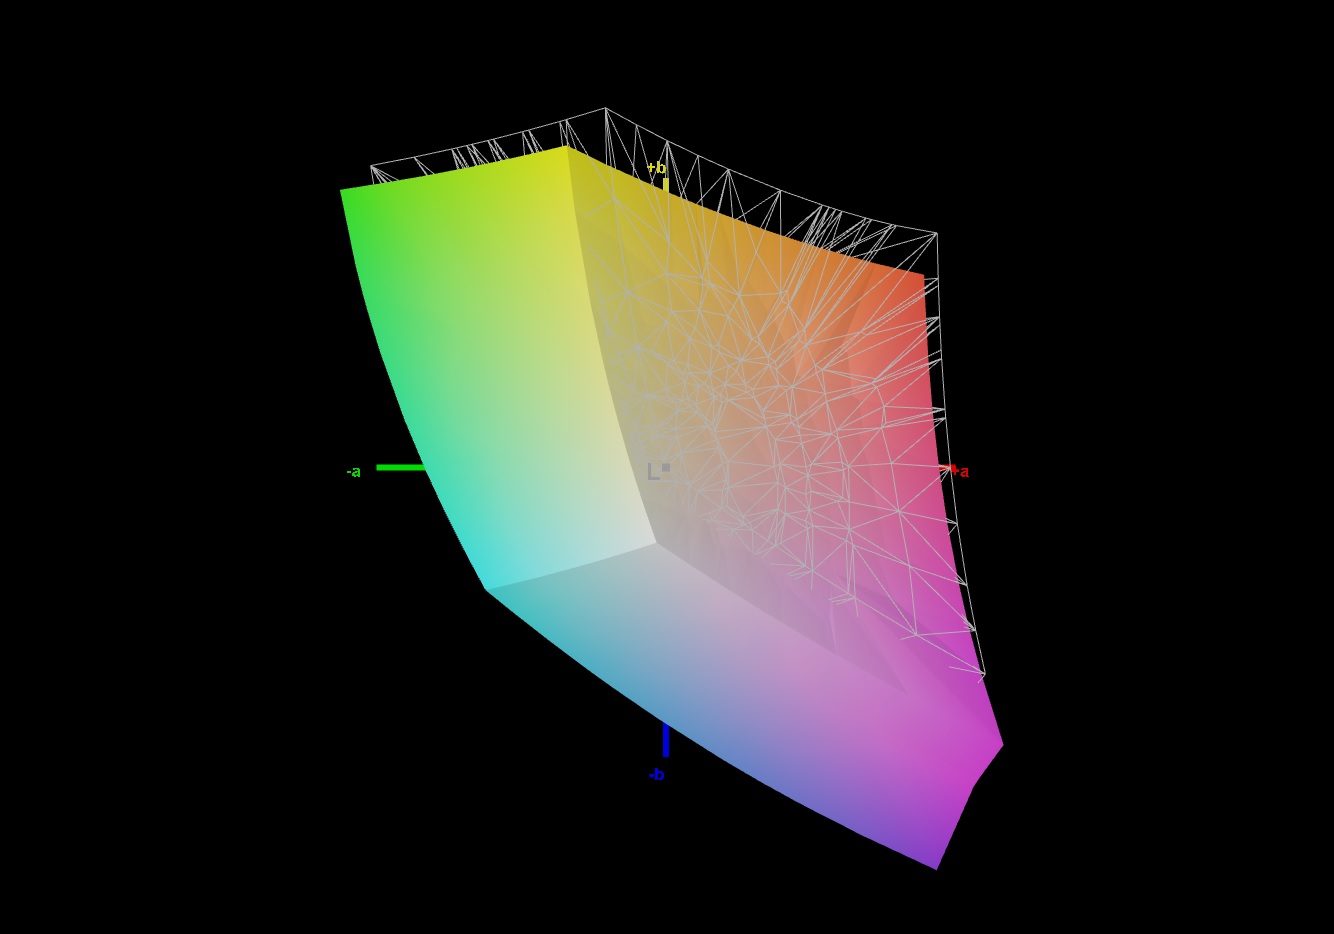
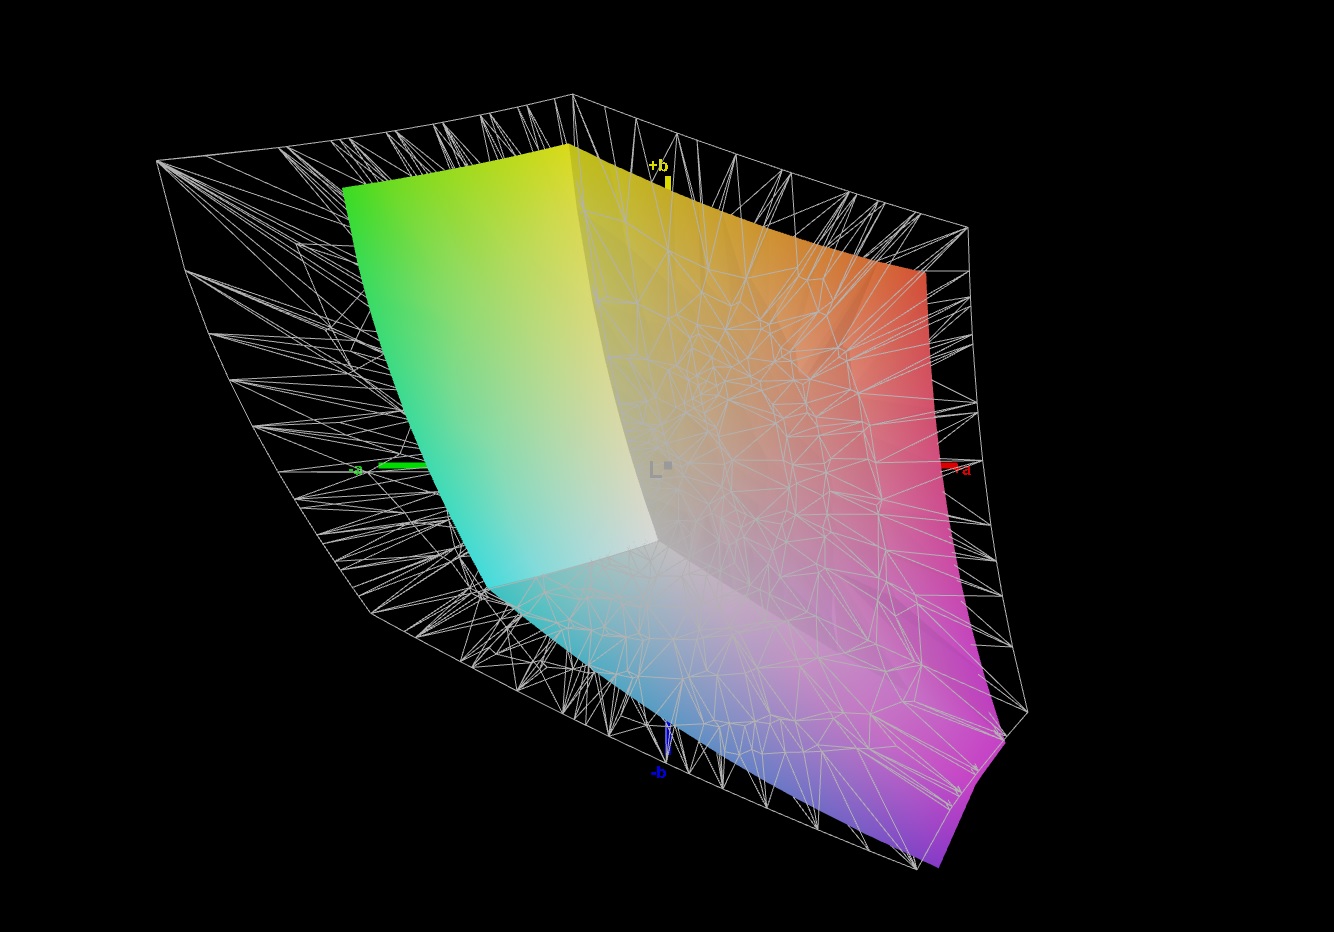
89% sRGB (Argyll 1.6.3 3D)
66% AdobeRGB 1998 (Argyll 1.6.3 3D)
65.6% AdobeRGB 1998 (Argyll 2.2.0 3D)
95.6% sRGB (Argyll 2.2.0 3D)
64.5% Display P3 (Argyll 2.2.0 3D)
Gamma: 2.187
| Medion Erazer Beast X10 MD61804 LG Phillips LP173WFG-SPB3, IPS, 1920x1080, 17.30 | SCHENKER XMG Neo 17 Comet Lake BOE HF NE173FHM-NZ1, IPS, 1920x1080, 17.30 | Asus Strix G17 G712LWS LG Philips LP173WFG-SPB3, IPS, 1920x1080, 17.30 | Acer Predator Helios 300 PH317-54-75G8 Chi Mei N173HCE-G33, IPS, 1920x1080, 17.30 | MSI GS75 10SF-609US Sharp LQ173M1JW05, IPS, 1920x1080, 17.30 | Razer Blade Pro 17 RTX 2070 Max-Q 300 Hz Sharp LQ173M1JW02, IPS, 1920x1080, 17.30 | |
|---|---|---|---|---|---|---|
| Display | 7% | 1% | -2% | 12% | 9% | |
| Display P3 Coverage | 64.5 | 69.4 8% | 65.2 1% | 62.6 -3% | 75.6 17% | 72.2 12% |
| sRGB Coverage | 95.6 | 99.2 4% | 96.8 1% | 94.3 -1% | 99.8 4% | 98.5 3% |
| AdobeRGB 1998 Coverage | 65.6 | 70.9 8% | 66.4 1% | 64.7 -1% | 75.1 14% | 73 11% |
| Response Times | 31% | -2% | -11% | 50% | 33% | |
| Response Time Grey 50% / Grey 80% * | 14.4 ? | 10.8 ? 25% | 14.4 ? -0% | 16.4 ? -14% | 5 ? 65% | 5.6 ? 61% |
| Response Time Black / White * | 10 ? | 6.4 ? 36% | 10.4 ? -4% | 10.8 ? -8% | 6.6 ? 34% | 9.6 ? 4% |
| PWM Frequency | 24510 ? | |||||
| Screen | 8% | 2% | 27% | 6% | -21% | |
| Brightness middle | 313 | 327 4% | 323 3% | 322 3% | 299.4 -4% | 328 5% |
| Brightness | 297 | 305 3% | 300 1% | 308 4% | 299 1% | 329 11% |
| Brightness Distribution | 88 | 87 -1% | 89 1% | 92 5% | 84 -5% | 78 -11% |
| Black Level * | 0.27 | 0.32 -19% | 0.31 -15% | 0.18 33% | 0.31 -15% | 0.35 -30% |
| Contrast | 1159 | 1022 -12% | 1042 -10% | 1789 54% | 966 -17% | 937 -19% |
| Colorchecker dE 2000 * | 2.96 | 2.16 27% | 3.01 -2% | 1.53 48% | 1.82 39% | 4.74 -60% |
| Colorchecker dE 2000 max. * | 9.83 | 6.14 38% | 7.65 22% | 3.14 68% | 3.91 60% | 8.99 9% |
| Colorchecker dE 2000 calibrated * | 1.03 | 0.89 14% | 1 3% | 0.74 28% | 1.59 -54% | 2.12 -106% |
| Greyscale dE 2000 * | 4.9 | 3.7 24% | 3.8 22% | 1.9 61% | 2.7 45% | 6.8 -39% |
| Gamma | 2.187 101% | 2.24 98% | 2.154 102% | 2.144 103% | 2.18 101% | 2.2 100% |
| CCT | 7559 86% | 6799 96% | 7507 87% | 6809 95% | 6837 95% | 6446 101% |
| Color Space (Percent of AdobeRGB 1998) | 66 | 71 8% | 66 0% | 65 -2% | 67.1 2% | 64.8 -2% |
| Color Space (Percent of sRGB) | 89 | 93 4% | 90 1% | 87 -2% | 99.8 12% | 98.6 11% |
| Total Average (Program / Settings) | 15% /
11% | 0% /
2% | 5% /
17% | 23% /
12% | 7% /
-9% |
* ... smaller is better
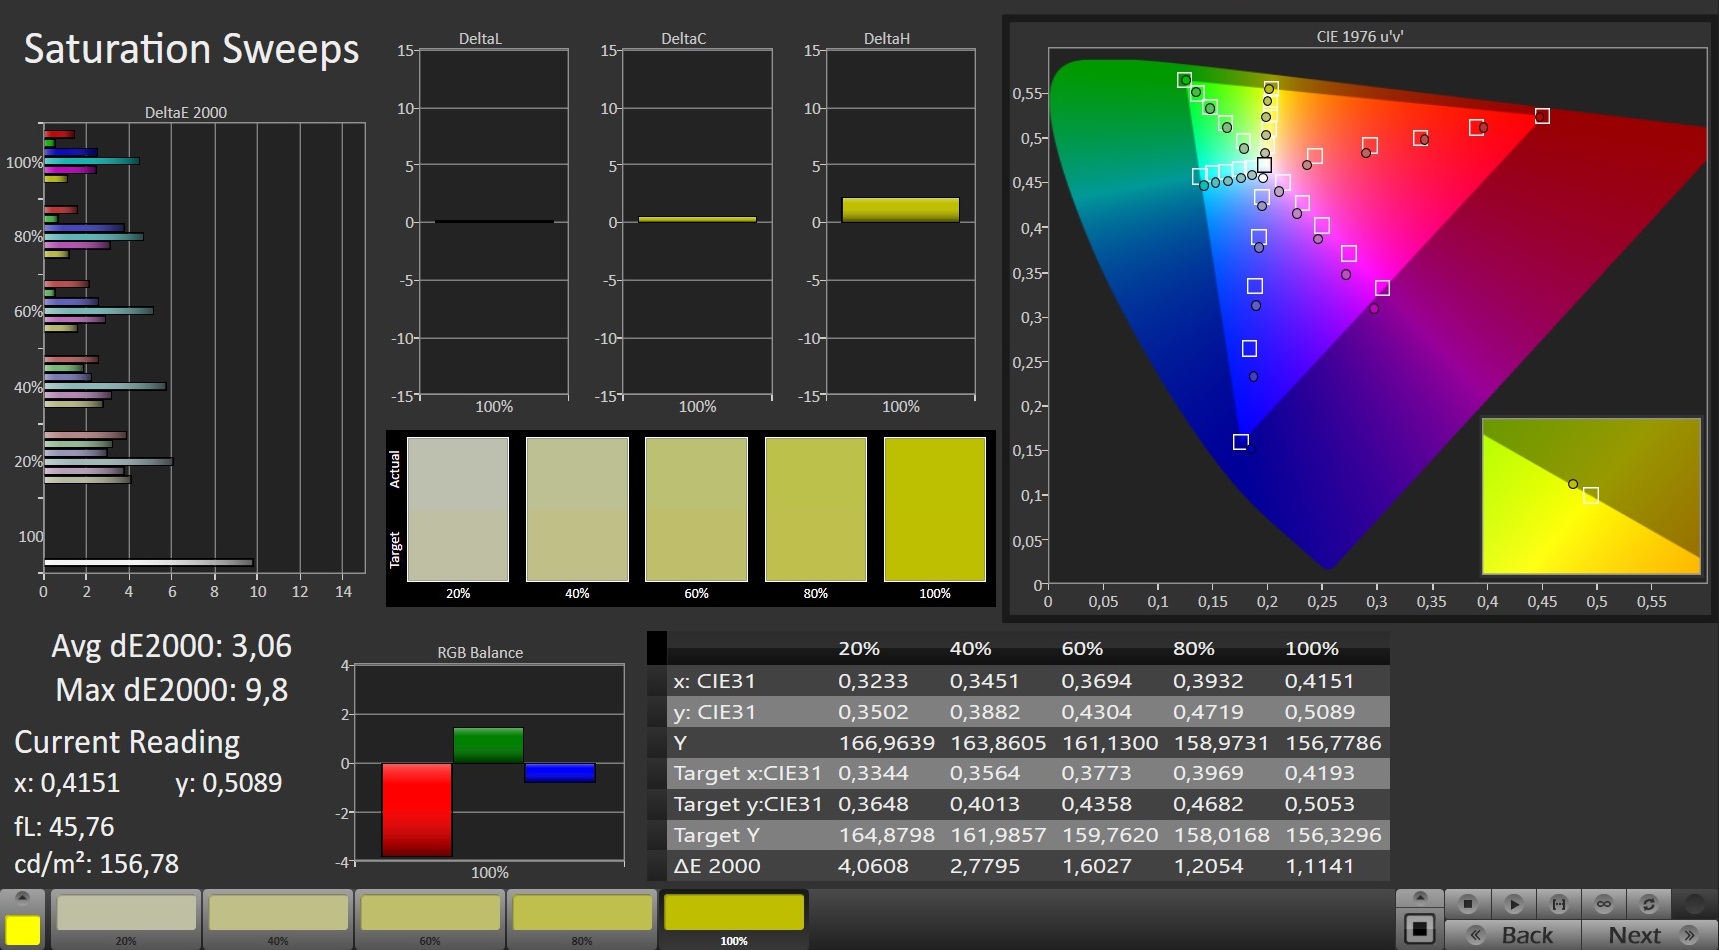
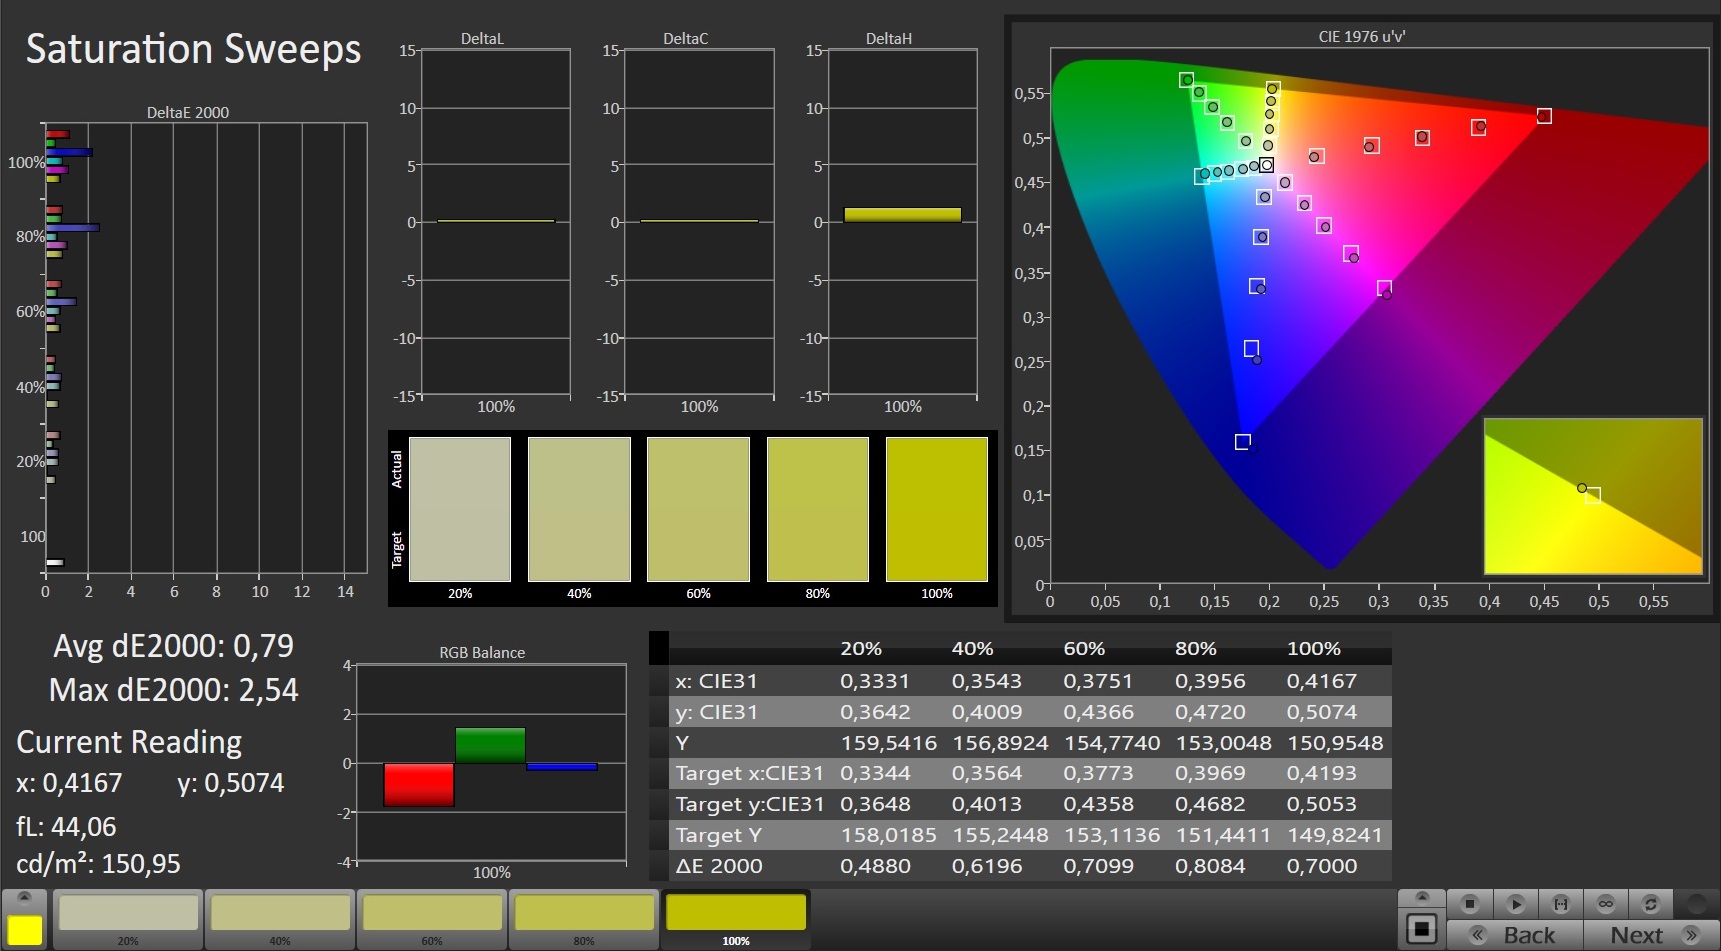
Already out of the box, the display shows a very decent color reproduction. With a Delta E 2000 color deviation of just under 3, the target (Delta E less than 3) is met. In addition, the display doesn't suffer from a blue tint. Calibration provides for improvements: In this way, the color deviation is reduced to 1.03, and the grayscales are displayed in a more balanced way. The AdobeRGB (66%) and sRGB (89%) color spaces aren't fully reproduced.
Display Response Times
| ↔ Response Time Black to White | ||
|---|---|---|
| 10 ms ... rise ↗ and fall ↘ combined | ↗ 5.2 ms rise | 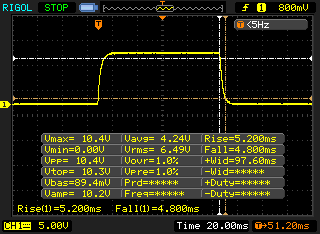 |
| ↘ 4.8 ms fall | ||
| The screen shows good response rates in our tests, but may be too slow for competitive gamers. In comparison, all tested devices range from 0.1 (minimum) to 240 (maximum) ms. » 22 % of all devices are better. This means that the measured response time is better than the average of all tested devices (21.5 ms). | ||
| ↔ Response Time 50% Grey to 80% Grey | ||
| 14.4 ms ... rise ↗ and fall ↘ combined | ↗ 7.6 ms rise | 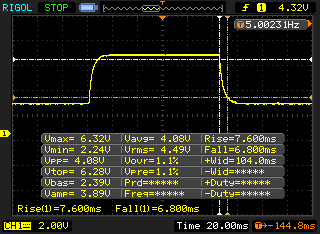 |
| ↘ 6.8 ms fall | ||
| The screen shows good response rates in our tests, but may be too slow for competitive gamers. In comparison, all tested devices range from 0.2 (minimum) to 636 (maximum) ms. » 23 % of all devices are better. This means that the measured response time is better than the average of all tested devices (33.7 ms). | ||
Screen Flickering / PWM (Pulse-Width Modulation)
| Screen flickering / PWM not detected | 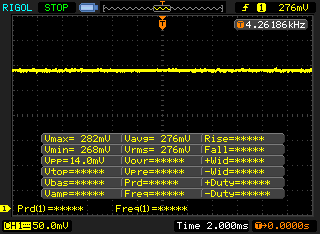 | ||
In comparison: 53 % of all tested devices do not use PWM to dim the display. If PWM was detected, an average of 17924 (minimum: 5 - maximum: 3846000) Hz was measured. | |||
The laptop is equipped with a viewing-angle stable IPS panel. Consequently, the screen can be read from any position. Outdoors, the display can be read when the sun isn't shining too brightly.

Performance - Sufficient for the coming years
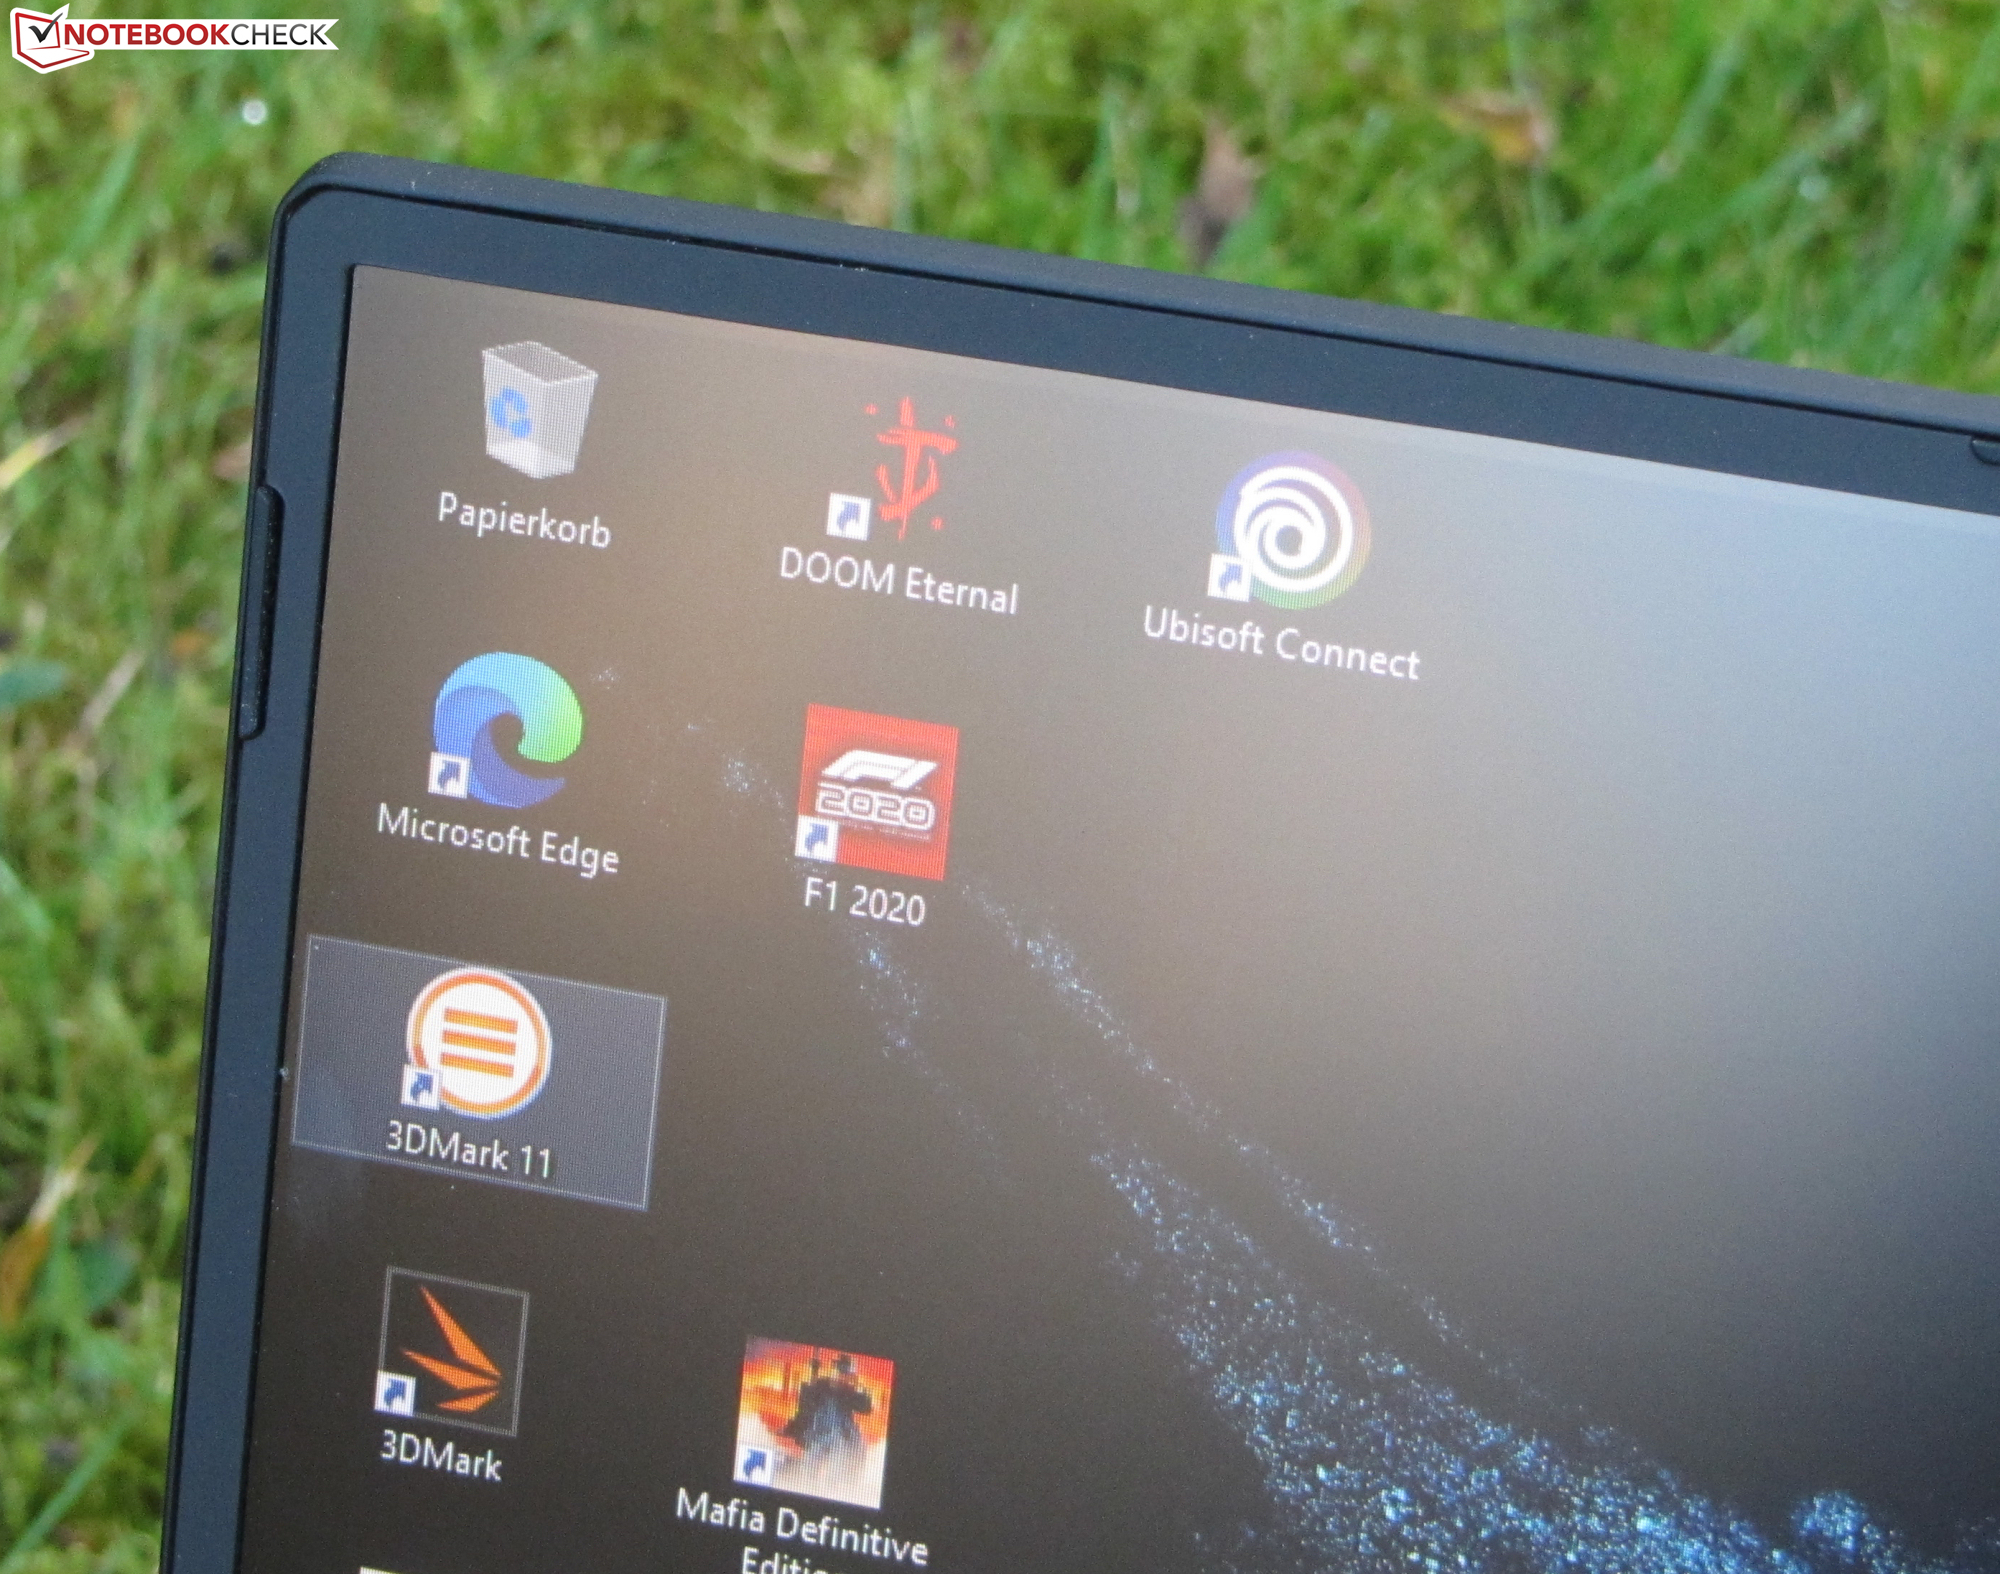
With the Erazer Beast X10, Medion has a 17.3-inch gaming laptop in its range that brings every modern game smoothly onto the screen. Our test device will set you back about 2,200 Euros (~$2,631). Other configurations are available.
Test conditions
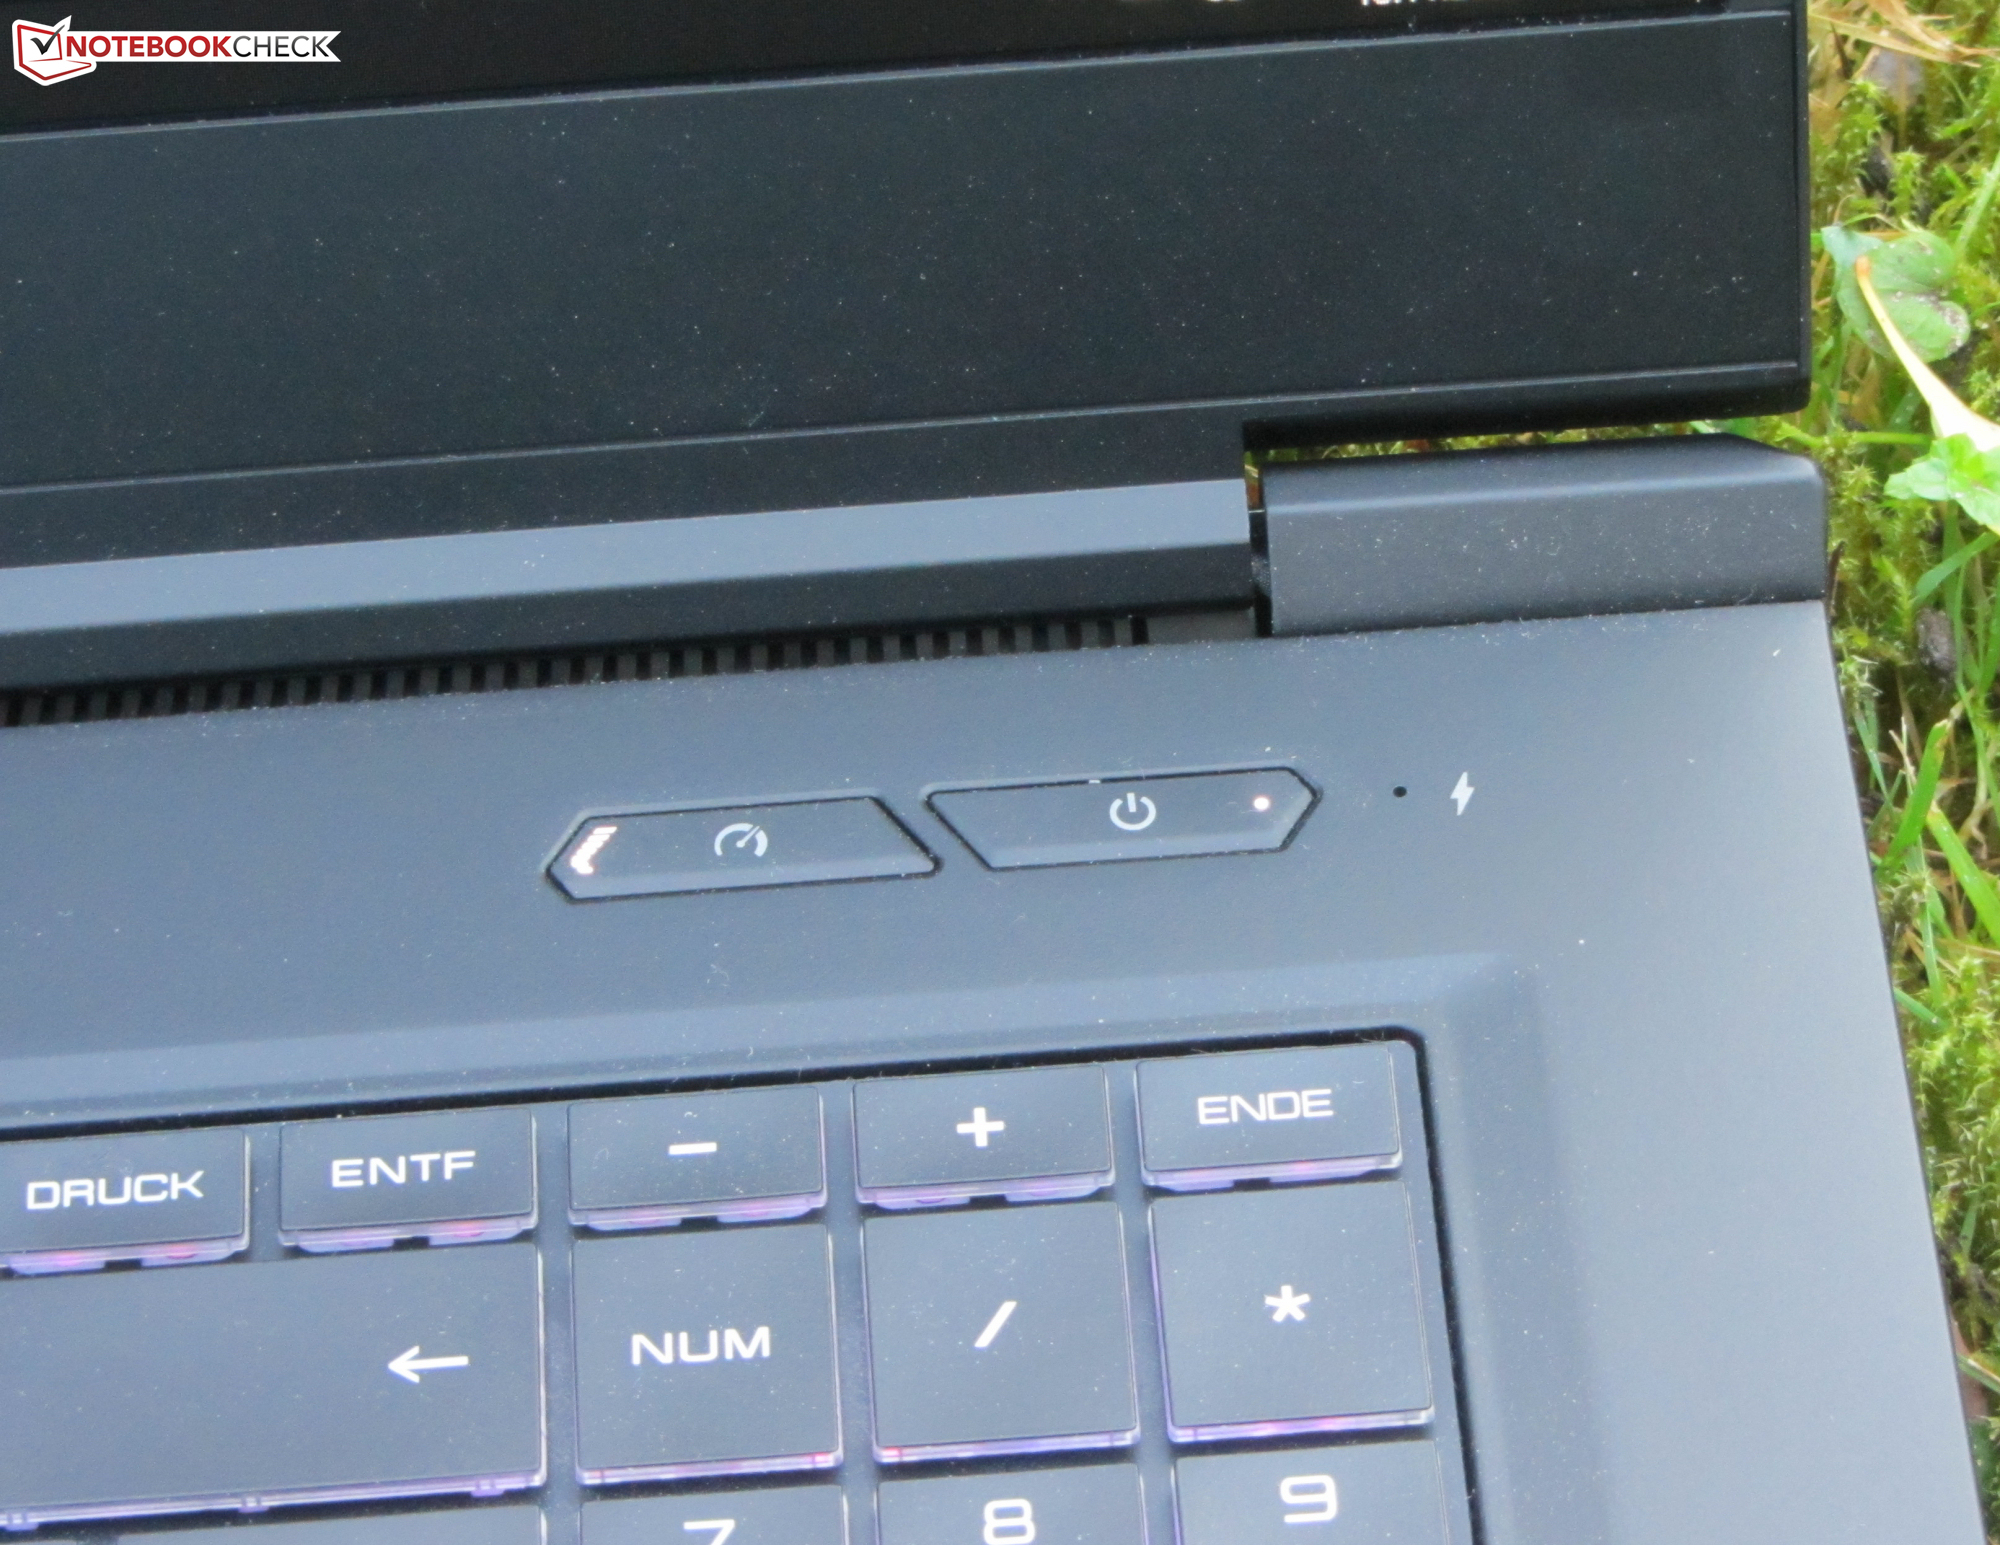
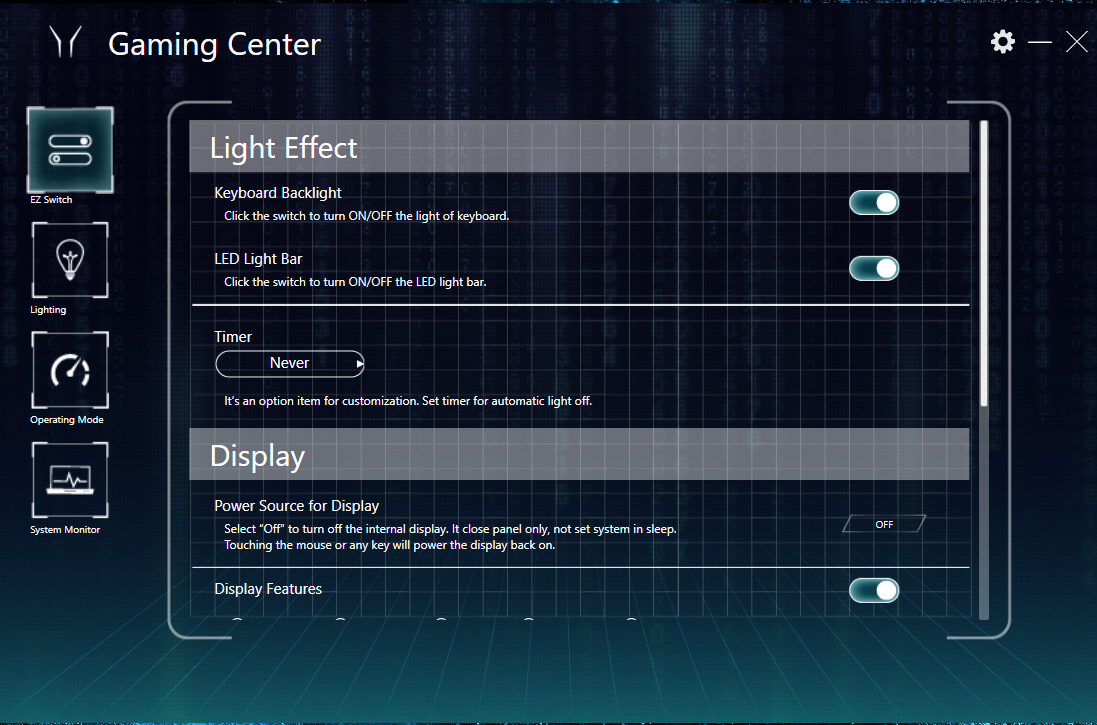
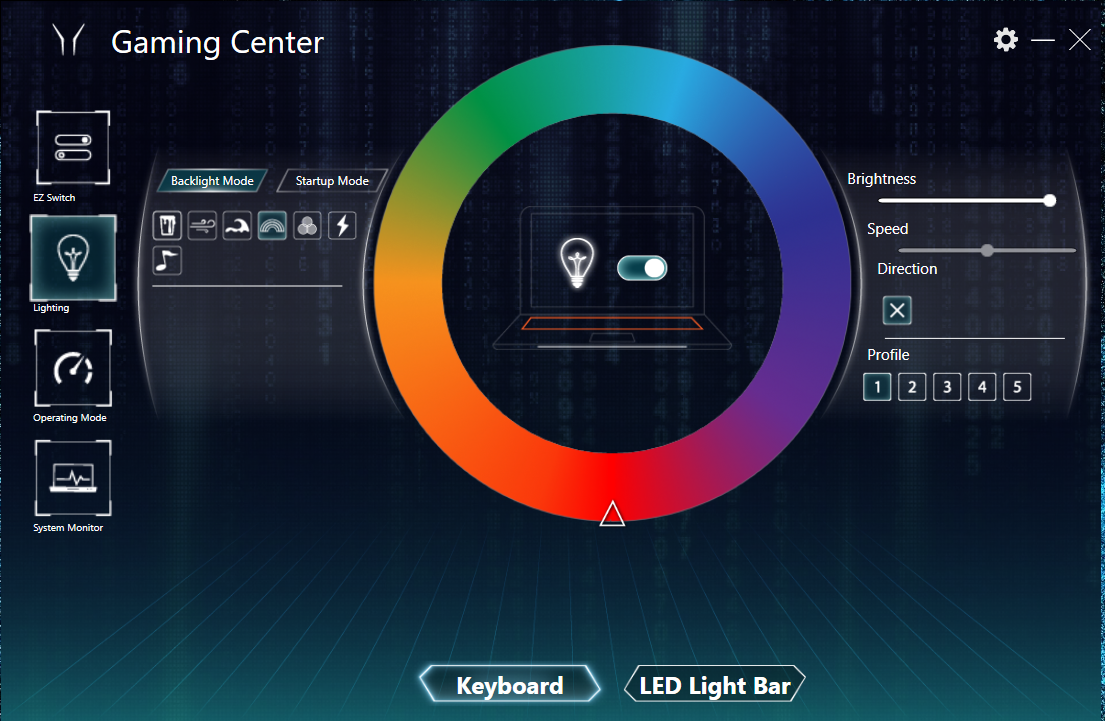
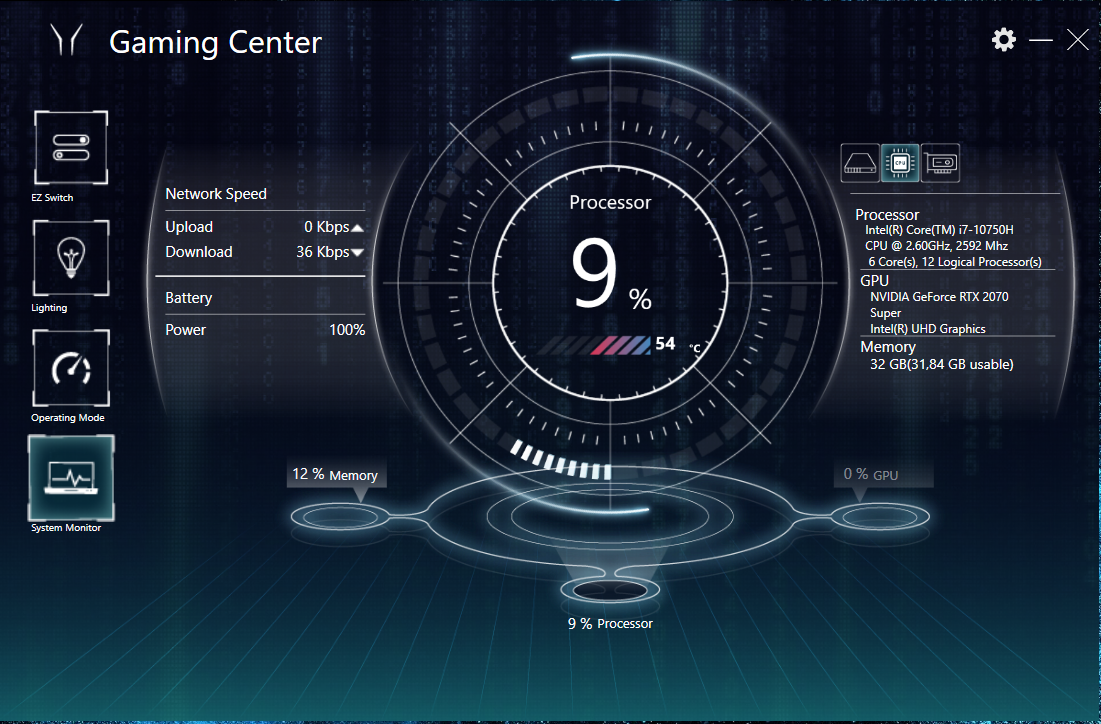
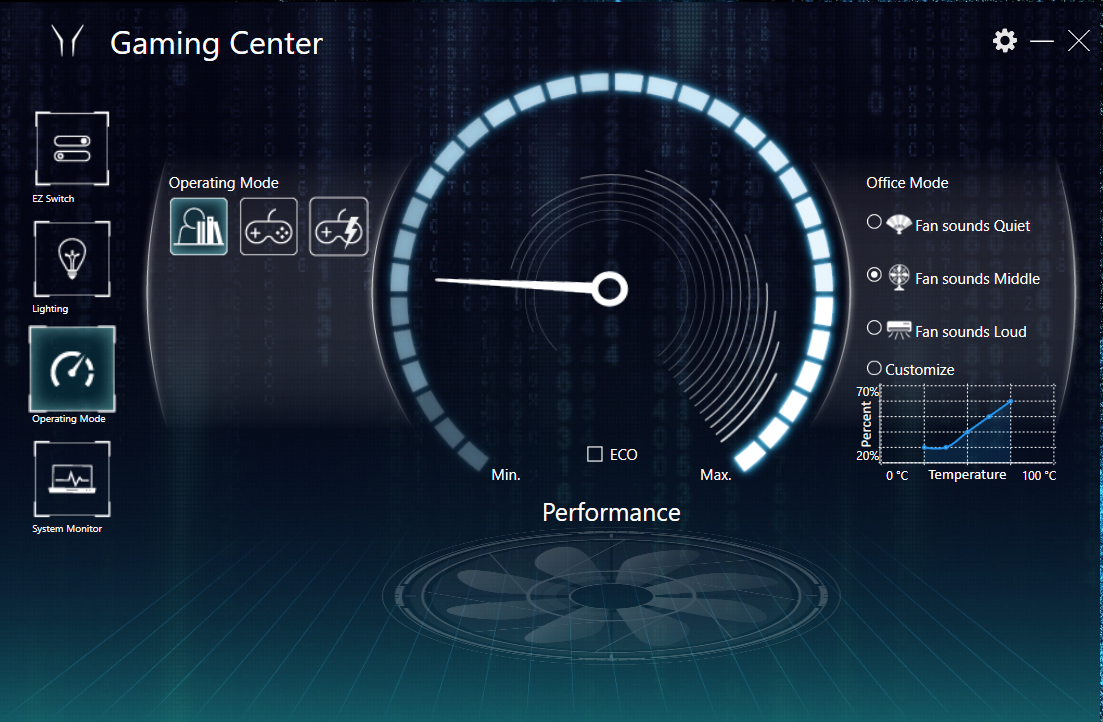
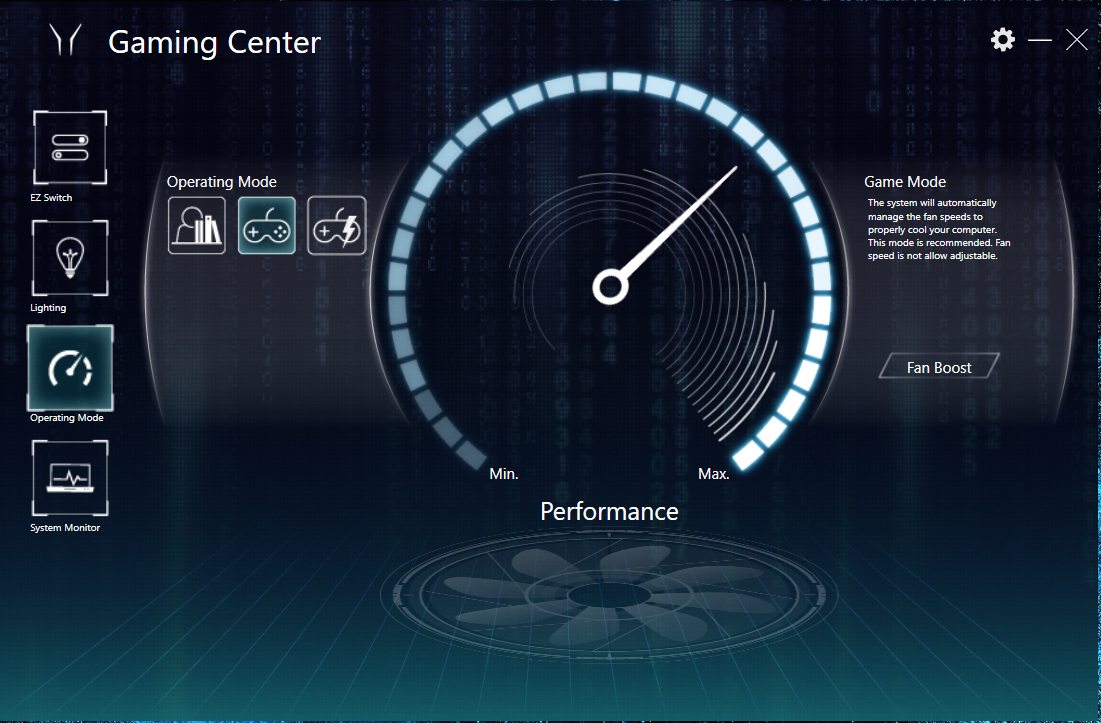
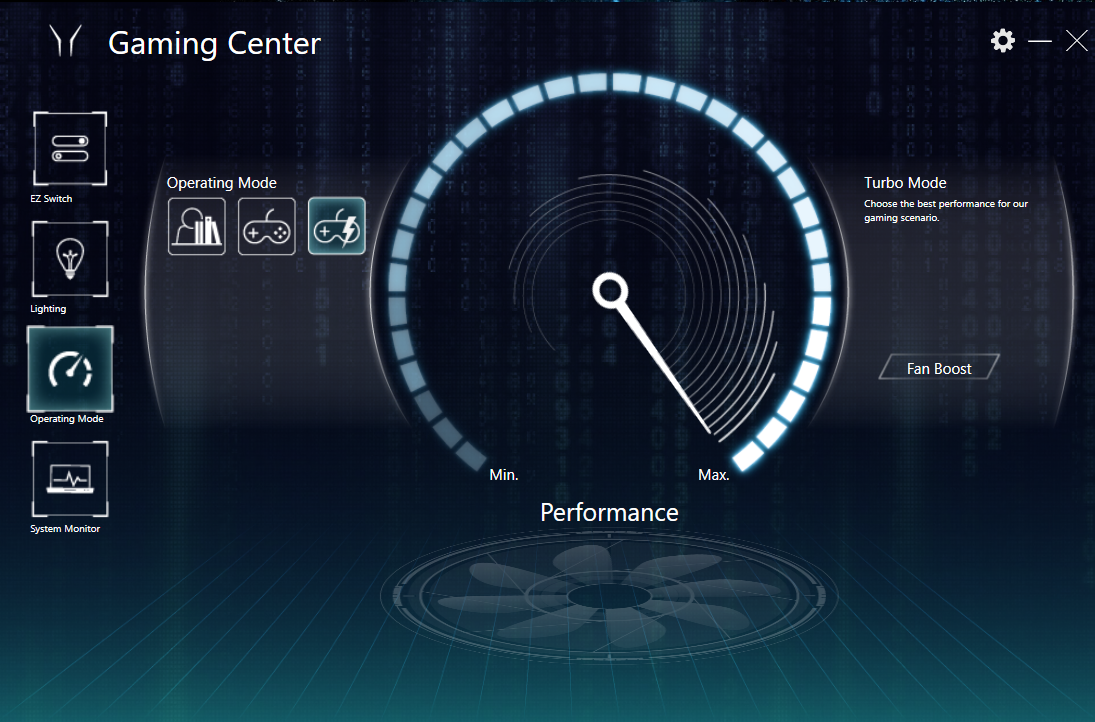
The preinstalled Gaming Center allows you to monitor the system status, adjust the keyboard backlight, and select a performance profile ("Office Mode", "Game Mode", "Turbo Mode"). We conducted our test under the "Game Mode" and with automatic fan control. The "Turbo Mode" doesn't increase performance compared to the "Game Mode". This might be different with other configuration variants of the X10. Next to the laptop's power button, there's another key that serves to quickly switch between profiles.
| Game Mode | Turbo Mode | Office Mode | Office Mode - Eco | |
|---|---|---|---|---|
| PL1 | 120 watts | 120 watts | 100 watts | 25 watts |
| PL2 | 120 watts | 120 watts | 100 watts | 25 watts |
For most users, the "Game Mode" and the "Office Mode", including the manually selectable "Eco" option, should be of interest, since this is a good choice for everyday use (office, Internet). The CPU then works at the same power level as conventional ULV processors. In other words: The computing power decreases, and the fans work much less frequently. Some of the comparison tables in this review contain benchmark results obtained under the "Office Mode (Eco)" profile.
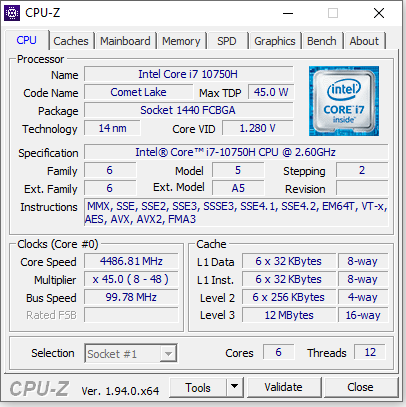
Processor
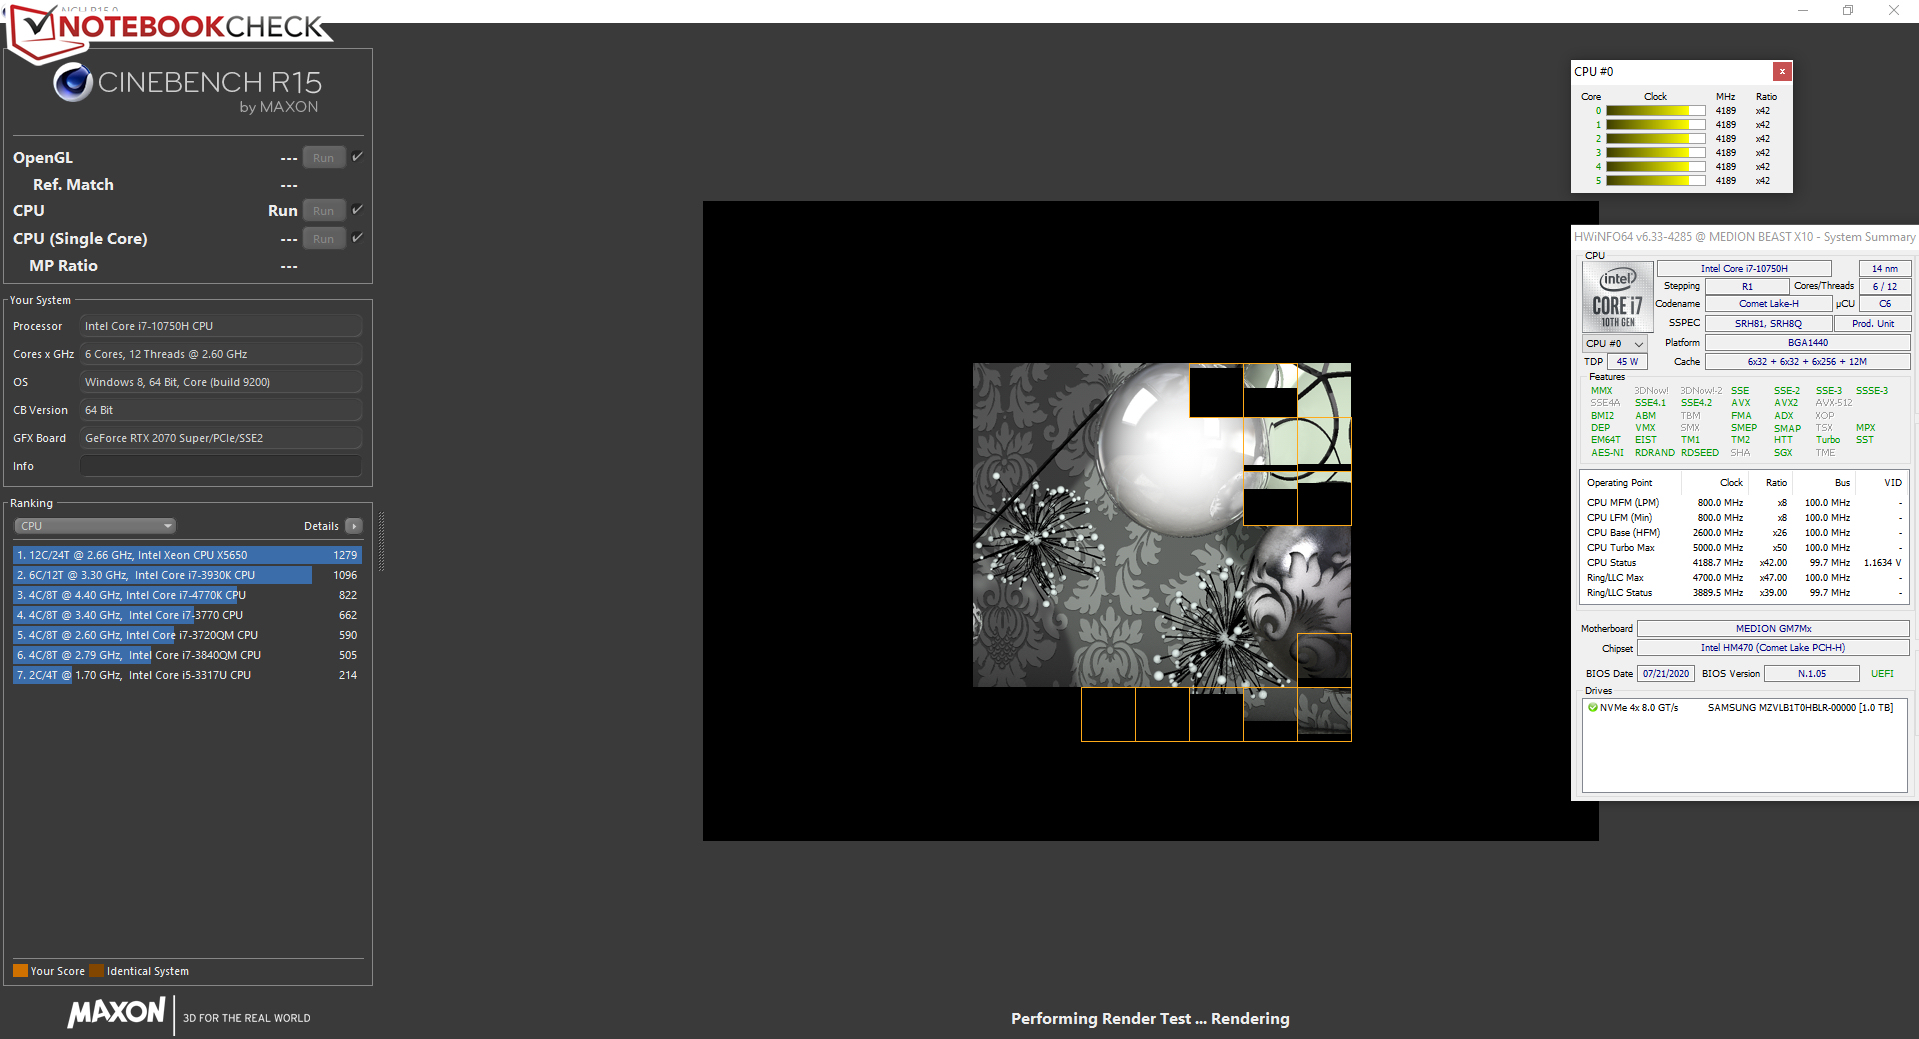
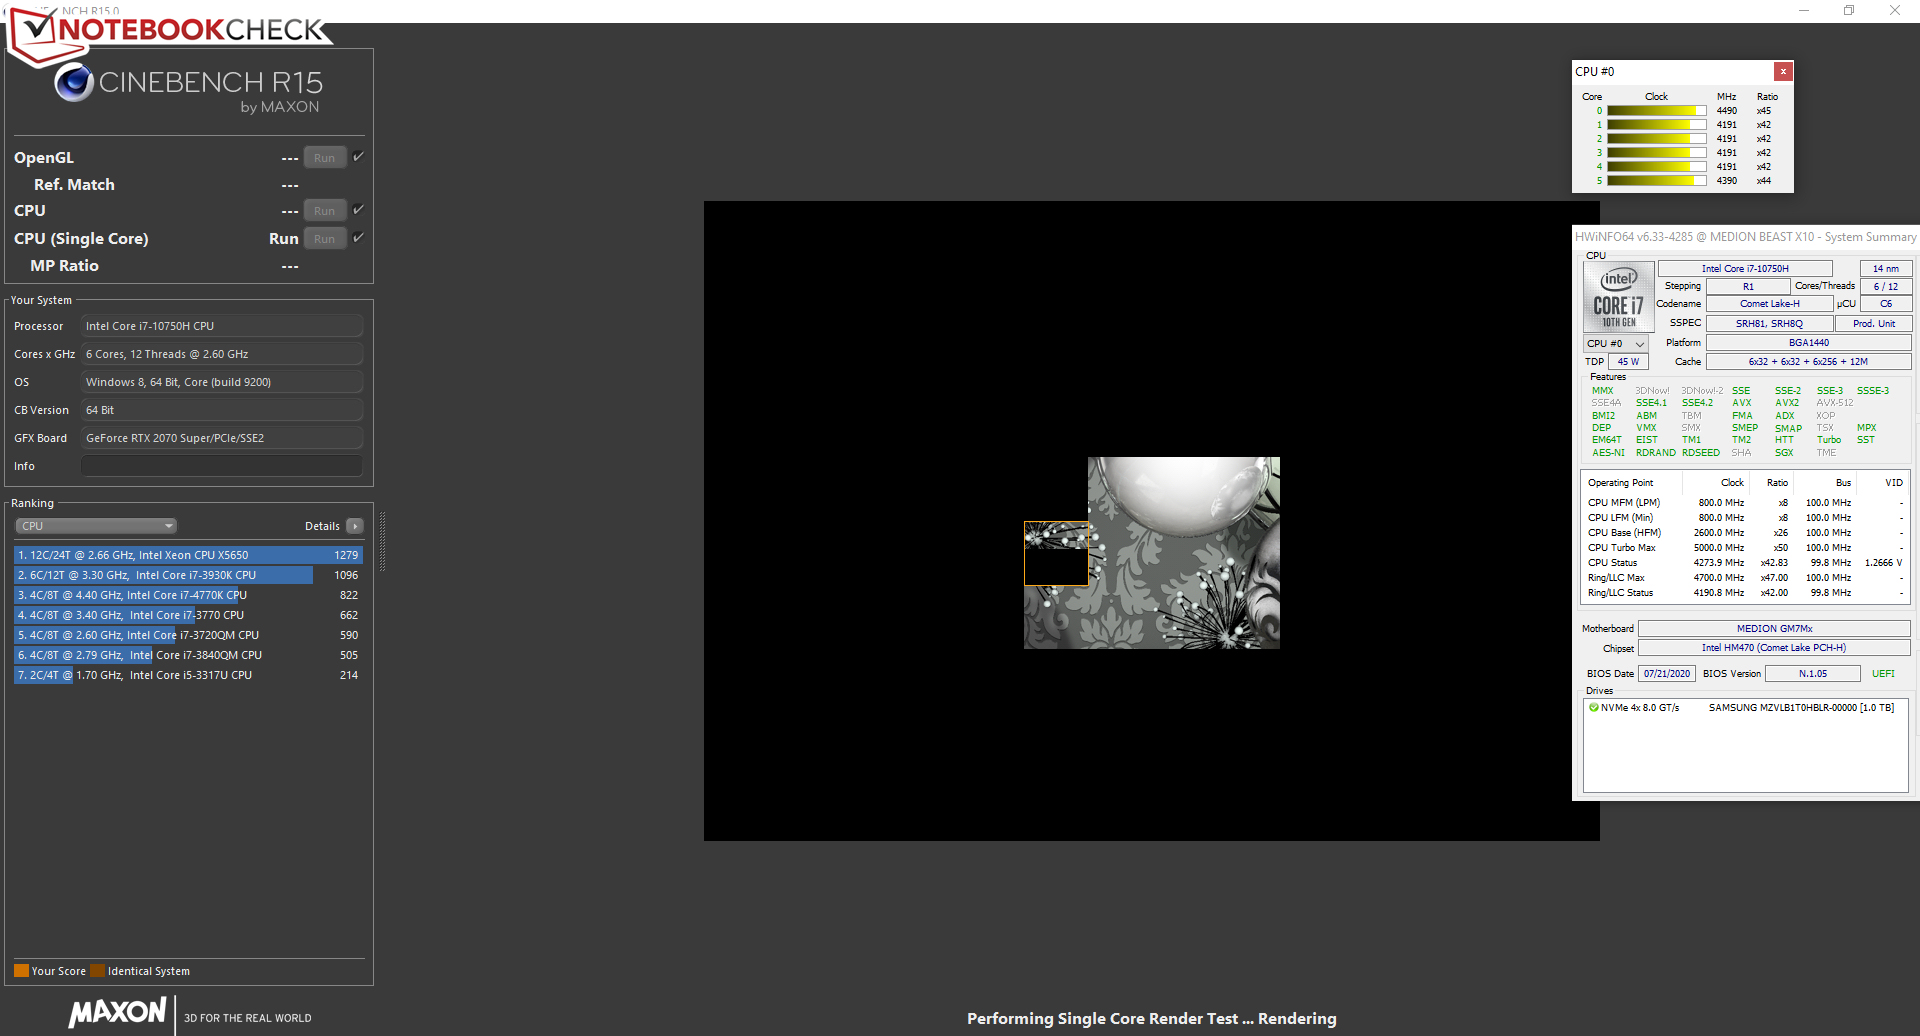
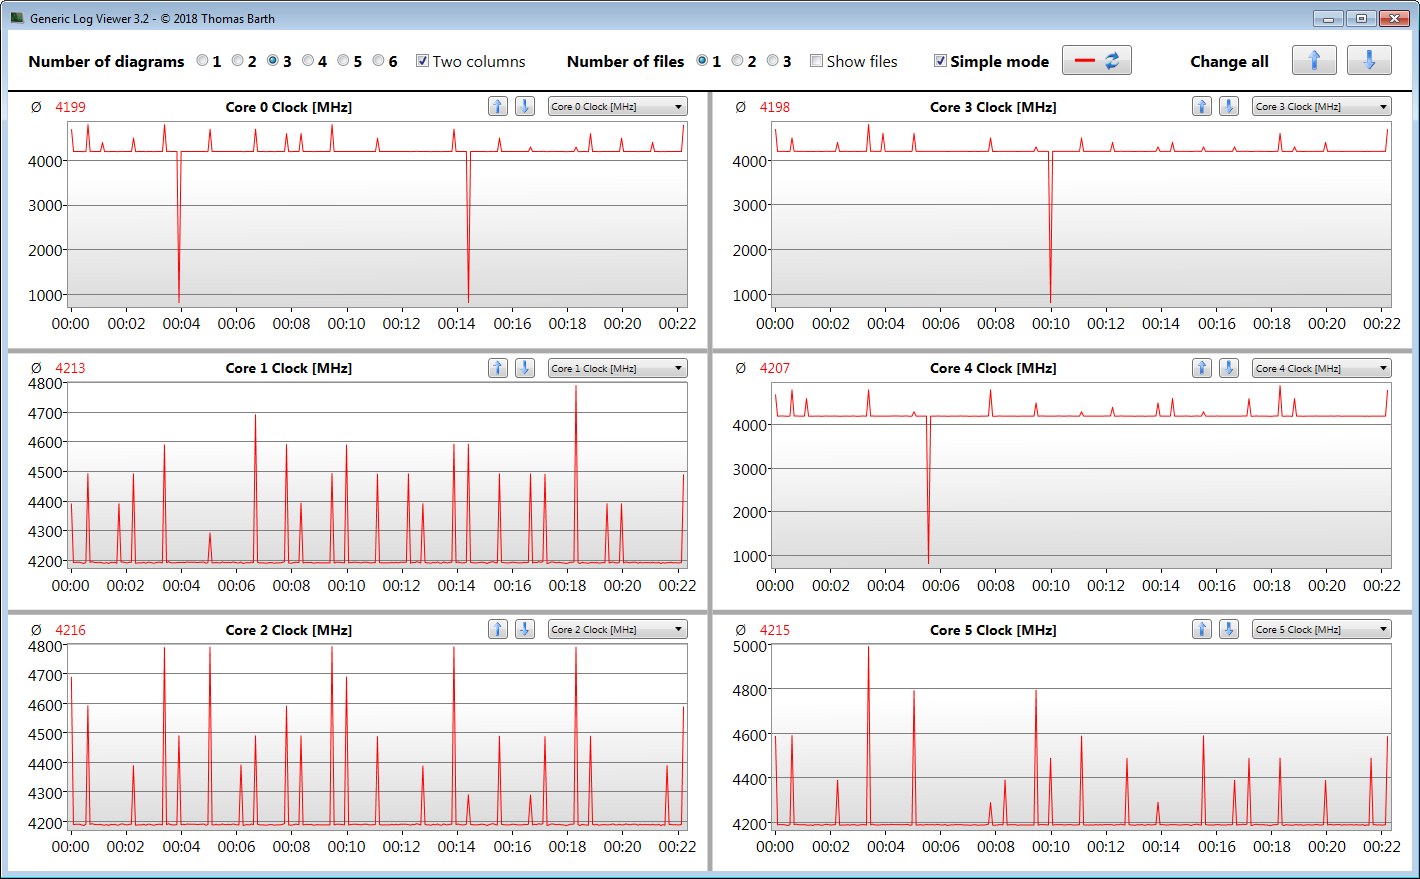
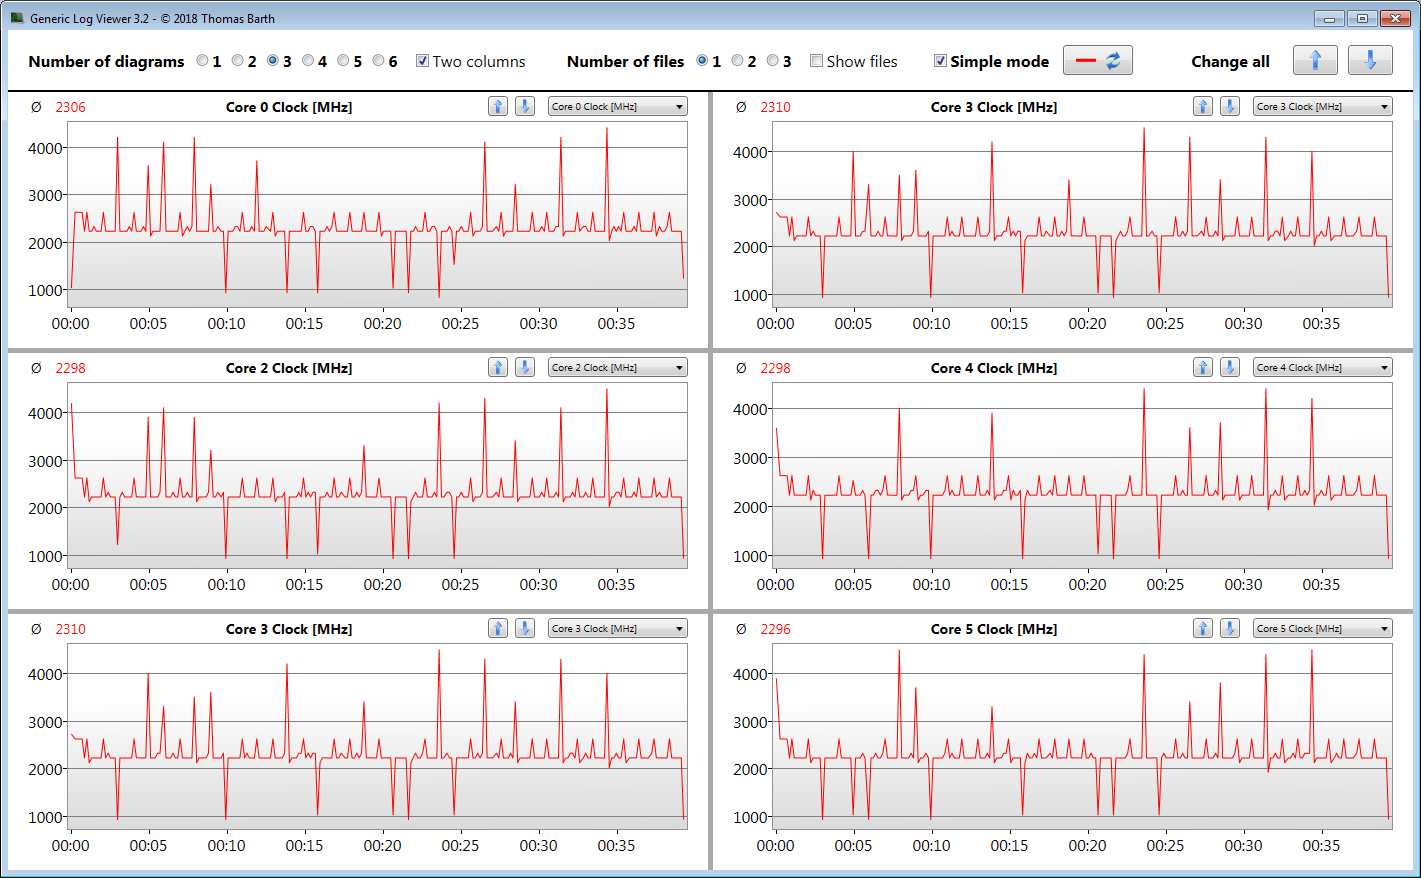
Medion equips the X10 with a Core i7-10750H hexa-core processor (Comet Lake). The CPU works at a base speed of 2.6 GHz. The clock rate can be increased to 4.3 GHz (six cores) or up to 5 GHz (one core) via Turbo. Hyper-Threading (two threads per core) is supported.
The CPU processes the multithread test of the Cinebench R15 benchmark at 4.2 GHz. The single-thread test is executed at 4.2 to 5 GHz. On battery power, the speeds are 2.2 to 2.5 GHz (multithread) and 2.2 to 2.7 GHz (single-thread), respectively.
| Cinebench R15 | |
| CPU Single 64Bit | |
| Average of class Gaming (79.2 - 318, n=230, last 2 years) | |
| SCHENKER XMG Neo 17 Comet Lake | |
| SCHENKER XMG Neo 17 Comet Lake (Overboost) | |
| Asus Strix G17 G712LWS | |
| Razer Blade Pro 17 RTX 2070 Max-Q 300 Hz | |
| MSI GS75 10SF-609US | |
| Average Intel Core i7-10750H (184 - 213, n=45) | |
| Medion Erazer Beast X10 MD61804 | |
| Acer Predator Helios 300 PH317-54-75G8 | |
| Medion Erazer Beast X10 MD61804 (Office Mode (Eco)) | |
| CPU Multi 64Bit | |
| Average of class Gaming (400 - 5663, n=231, last 2 years) | |
| SCHENKER XMG Neo 17 Comet Lake (Overboost) | |
| MSI GS75 10SF-609US | |
| Razer Blade Pro 17 RTX 2070 Max-Q 300 Hz | |
| SCHENKER XMG Neo 17 Comet Lake | |
| Medion Erazer Beast X10 MD61804 | |
| Asus Strix G17 G712LWS | |
| Acer Predator Helios 300 PH317-54-75G8 | |
| Average Intel Core i7-10750H (804 - 1418, n=50) | |
| Medion Erazer Beast X10 MD61804 (Office Mode (Eco)) | |
| Blender - v2.79 BMW27 CPU | |
| Medion Erazer Beast X10 MD61804 (Office Mode (Eco)) | |
| Average Intel Core i7-10750H (322 - 587, n=43) | |
| Acer Predator Helios 300 PH317-54-75G8 | |
| Asus Strix G17 G712LWS | |
| Razer Blade Pro 17 RTX 2070 Max-Q 300 Hz | |
| Medion Erazer Beast X10 MD61804 | |
| SCHENKER XMG Neo 17 Comet Lake | |
| MSI GS75 10SF-609US | |
| SCHENKER XMG Neo 17 Comet Lake (Overboost) | |
| Average of class Gaming (87 - 1259, n=225, last 2 years) | |
| 7-Zip 18.03 | |
| 7z b 4 -mmt1 | |
| Average of class Gaming (2685 - 7581, n=226, last 2 years) | |
| SCHENKER XMG Neo 17 Comet Lake | |
| SCHENKER XMG Neo 17 Comet Lake (Overboost) | |
| Razer Blade Pro 17 RTX 2070 Max-Q 300 Hz | |
| MSI GS75 10SF-609US | |
| Medion Erazer Beast X10 MD61804 | |
| Acer Predator Helios 300 PH317-54-75G8 | |
| Asus Strix G17 G712LWS | |
| Average Intel Core i7-10750H (4504 - 5470, n=43) | |
| Medion Erazer Beast X10 MD61804 (Office Mode (Eco)) | |
| 7z b 4 | |
| Average of class Gaming (11386 - 140932, n=226, last 2 years) | |
| SCHENKER XMG Neo 17 Comet Lake (Overboost) | |
| MSI GS75 10SF-609US | |
| SCHENKER XMG Neo 17 Comet Lake | |
| Medion Erazer Beast X10 MD61804 | |
| Asus Strix G17 G712LWS | |
| Average Intel Core i7-10750H (26040 - 37345, n=43) | |
| Razer Blade Pro 17 RTX 2070 Max-Q 300 Hz | |
| Acer Predator Helios 300 PH317-54-75G8 | |
| Medion Erazer Beast X10 MD61804 (Office Mode (Eco)) | |
| Cinebench R20 | |
| CPU (Single Core) | |
| Average of class Gaming (169 - 855, n=227, last 2 years) | |
| SCHENKER XMG Neo 17 Comet Lake | |
| SCHENKER XMG Neo 17 Comet Lake (Overboost) | |
| Asus Strix G17 G712LWS | |
| Razer Blade Pro 17 RTX 2070 Max-Q 300 Hz | |
| MSI GS75 10SF-609US | |
| Average Intel Core i7-10750H (431 - 504, n=43) | |
| Acer Predator Helios 300 PH317-54-75G8 | |
| CPU (Multi Core) | |
| Average of class Gaming (930 - 13769, n=227, last 2 years) | |
| SCHENKER XMG Neo 17 Comet Lake (Overboost) | |
| MSI GS75 10SF-609US | |
| Razer Blade Pro 17 RTX 2070 Max-Q 300 Hz | |
| SCHENKER XMG Neo 17 Comet Lake | |
| Asus Strix G17 G712LWS | |
| Acer Predator Helios 300 PH317-54-75G8 | |
| Average Intel Core i7-10750H (1749 - 3325, n=43) | |
| HWBOT x265 Benchmark v2.2 - 4k Preset | |
| Average of class Gaming (3 - 37.6, n=229, last 2 years) | |
| SCHENKER XMG Neo 17 Comet Lake (Overboost) | |
| MSI GS75 10SF-609US | |
| SCHENKER XMG Neo 17 Comet Lake | |
| Medion Erazer Beast X10 MD61804 | |
| Asus Strix G17 G712LWS | |
| Acer Predator Helios 300 PH317-54-75G8 | |
| Average Intel Core i7-10750H (5.54 - 11.6, n=43) | |
| Medion Erazer Beast X10 MD61804 (Office Mode (Eco)) | |
| LibreOffice - 20 Documents To PDF | |
| Razer Blade Pro 17 RTX 2070 Max-Q 300 Hz | |
| Asus Strix G17 G712LWS | |
| Acer Predator Helios 300 PH317-54-75G8 | |
| Average Intel Core i7-10750H (43.1 - 99.2, n=43) | |
| SCHENKER XMG Neo 17 Comet Lake | |
| Medion Erazer Beast X10 MD61804 (Office Mode (Eco)) | |
| MSI GS75 10SF-609US | |
| Average of class Gaming (32.8 - 332, n=223, last 2 years) | |
| Medion Erazer Beast X10 MD61804 | |
| SCHENKER XMG Neo 17 Comet Lake (Overboost) | |
| R Benchmark 2.5 - Overall mean | |
| Acer Predator Helios 300 PH317-54-75G8 | |
| Medion Erazer Beast X10 MD61804 (Office Mode (Eco)) | |
| Average Intel Core i7-10750H (0.578 - 0.708, n=42) | |
| Asus Strix G17 G712LWS | |
| Medion Erazer Beast X10 MD61804 | |
| MSI GS75 10SF-609US | |
| SCHENKER XMG Neo 17 Comet Lake (Overboost) | |
| SCHENKER XMG Neo 17 Comet Lake | |
| Average of class Gaming (0.3609 - 4.47, n=226, last 2 years) | |
* ... smaller is better
System performance
The system runs well and smoothly. We didn't encounter any problems. Owners of the Beast X10 won't lack system performance - and this is true for the coming years as well. The hardware cuts a fine figure in all common application areas. This is also confirmed by the results in the PCMark benchmarks.
| PCMark 8 Home Score Accelerated v2 | 4350 points | |
| PCMark 8 Creative Score Accelerated v2 | 4277 points | |
| PCMark 8 Work Score Accelerated v2 | 5792 points | |
| PCMark 10 Score | 5581 points | |
Help | ||
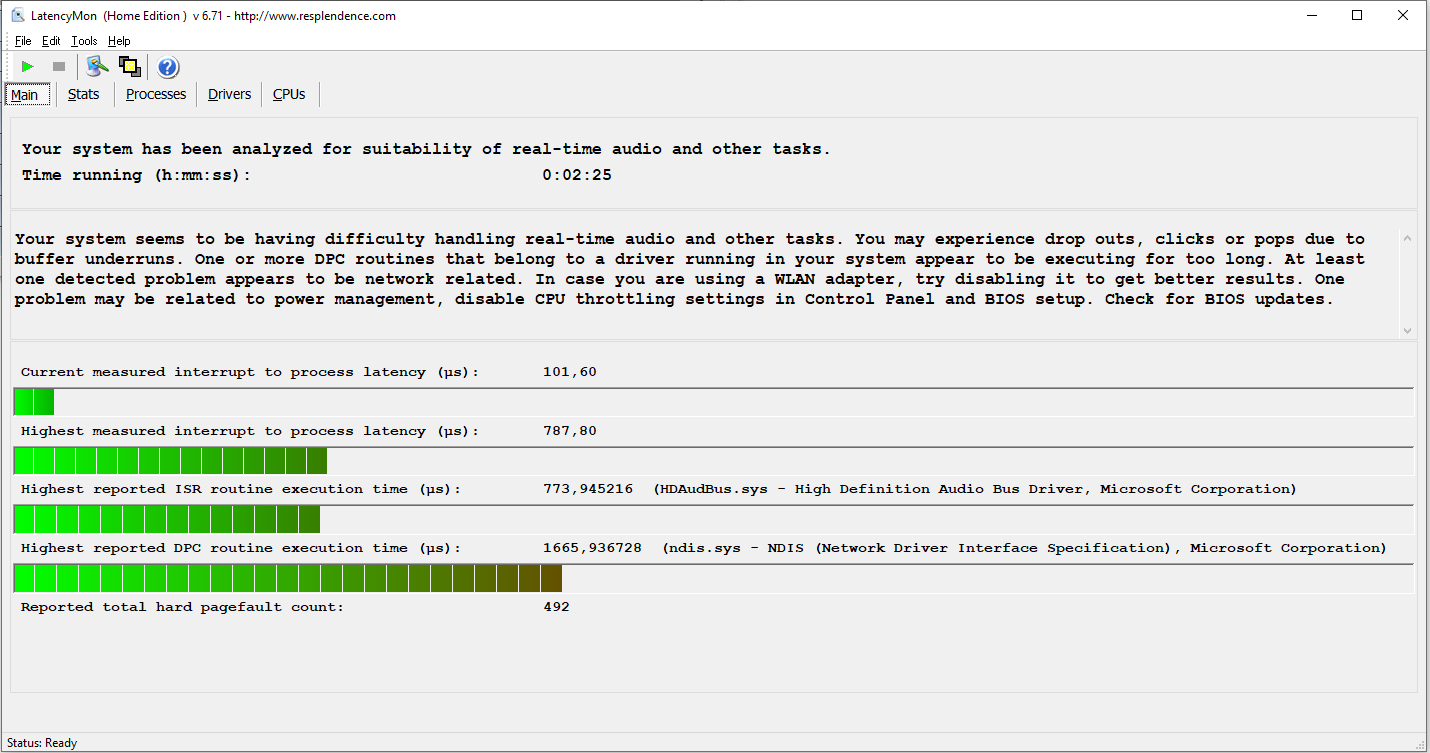
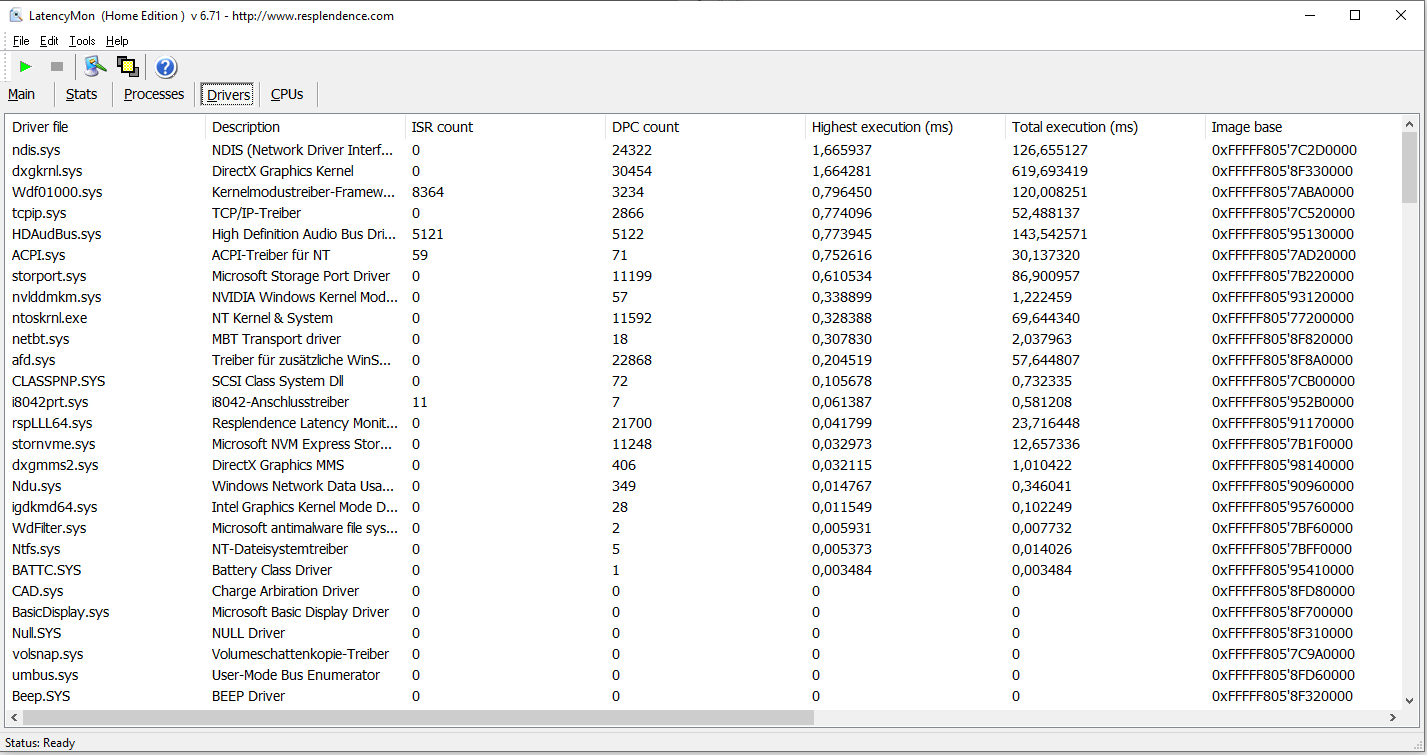
DPC latencies
In our standardized latency monitor test (web surfing, 4K video playback, high-load Prime95), we could observe issues with the DPC latencies. The system doesn't seem to be suitable for real-time video and audio-editing.
| DPC Latencies / LatencyMon - interrupt to process latency (max), Web, Youtube, Prime95 | |
| Asus Strix G17 G712LWS | |
| Razer Blade Pro 17 RTX 2070 Max-Q 300 Hz | |
| Medion Erazer Beast X10 MD61804 | |
| Acer Predator Helios 300 PH317-54-75G8 | |
| SCHENKER XMG Neo 17 Comet Lake | |
| MSI GS75 10SF-609US | |
* ... smaller is better
Storage
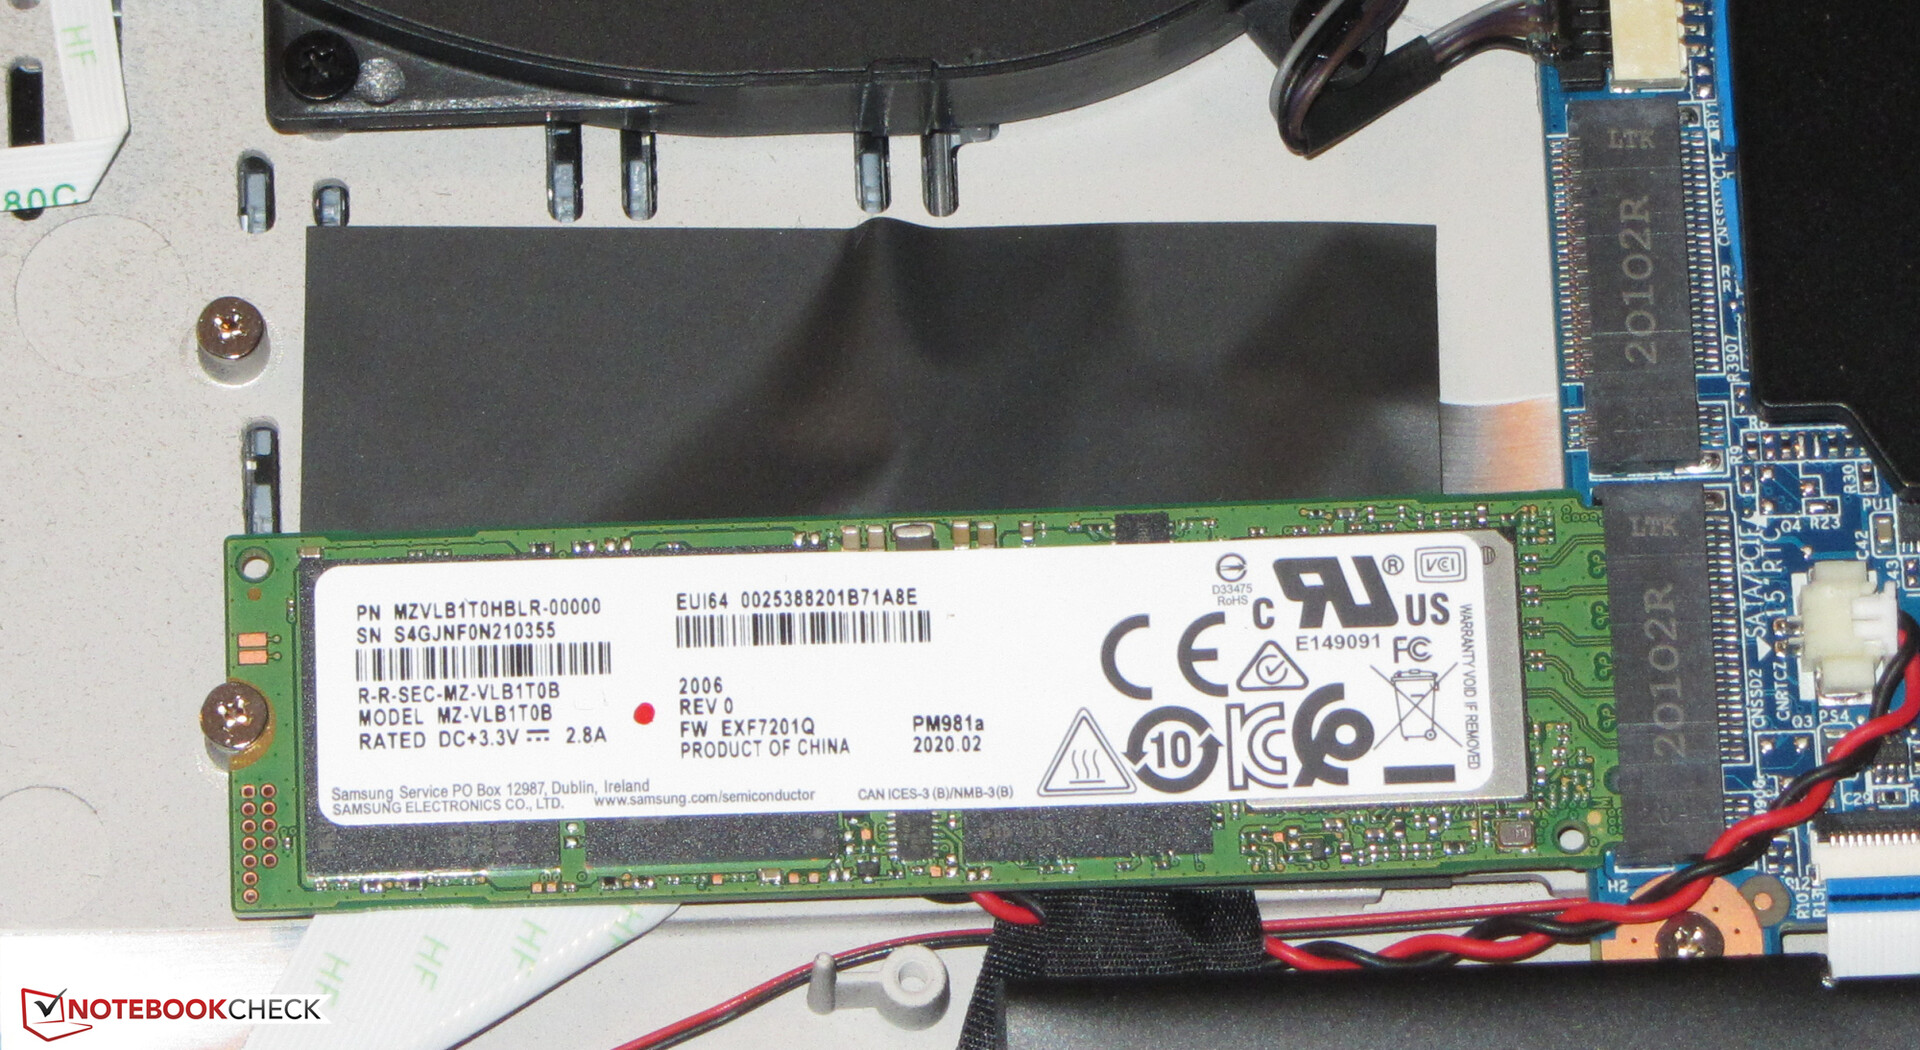
The system drive is an NVMe SSD (M.2 2280) from Samsung. It provides 1 TB of storage space and delivers very good transfer rates. The laptop still has room for a second NVMe SSD.

| Medion Erazer Beast X10 MD61804 Samsung PM981a MZVLB1T0HBLR | SCHENKER XMG Neo 17 Comet Lake Samsung SSD 970 EVO Plus 1TB | Asus Strix G17 G712LWS Intel SSD 660p 1TB SSDPEKNW010T8 | Acer Predator Helios 300 PH317-54-75G8 WDC PC SN730 SDBQNTY-1T00 | MSI GS75 10SF-609US WDC PC SN730 SDBPNTY-512G | Razer Blade Pro 17 RTX 2070 Max-Q 300 Hz Lite-On CA5-8D512 | Average Samsung PM981a MZVLB1T0HBLR | |
|---|---|---|---|---|---|---|---|
| CrystalDiskMark 5.2 / 6 | 35% | 0% | 24% | 32% | 21% | 18% | |
| Write 4K | 151 | 158.6 5% | 141.1 -7% | 141.9 -6% | 177.9 18% | 119 -21% | 139.7 ? -7% |
| Read 4K | 49.29 | 53.6 9% | 60.9 24% | 48.75 -1% | 47.42 -4% | 51.9 5% | 49.9 ? 1% |
| Write Seq | 1109 | 2671 141% | 1681 52% | 2734 147% | 2707 144% | 2258 104% | 2036 ? 84% |
| Read Seq | 1049 | 2130 103% | 1602 53% | 1921 83% | 2369 126% | 2283 118% | 2014 ? 92% |
| Write 4K Q32T1 | 494.4 | 525 6% | 406.6 -18% | 422.6 -15% | 427.8 -13% | 491 -1% | 461 ? -7% |
| Read 4K Q32T1 | 569 | 609 7% | 470.2 -17% | 509 -11% | 543 -5% | 540 -5% | 499 ? -12% |
| Write Seq Q32T1 | 3017 | 3308 10% | 1759 -42% | 3055 1% | 2703 -10% | 2253 -25% | 2903 ? -4% |
| Read Seq Q32T1 | 3542 | 3557 0% | 1932 -45% | 3257 -8% | 3387 -4% | 3172 -10% | 3479 ? -2% |
| AS SSD | 5% | -46% | -6% | -39% | -82% | -10% | |
| Seq Read | 2470 | 2882 17% | 1778 -28% | 2828 14% | 2327 -6% | 2019 -18% | 2553 ? 3% |
| Seq Write | 2473 | 2764 12% | 1478 -40% | 2677 8% | 2479 0% | 1314 -47% | 2084 ? -16% |
| 4K Read | 50.2 | 55.9 11% | 49.76 -1% | 39.94 -20% | 45.46 -9% | 46.61 -7% | 53.1 ? 6% |
| 4K Write | 124.4 | 129.4 4% | 117.9 -5% | 100.9 -19% | 157.4 27% | 90.2 -27% | 131.2 ? 5% |
| 4K-64 Read | 1711 | 1793 5% | 591 -65% | 1562 -9% | 1050 -39% | 665 -61% | 1477 ? -14% |
| 4K-64 Write | 1848 | 2140 16% | 875 -53% | 1867 1% | 938 -49% | 813 -56% | 1805 ? -2% |
| Access Time Read * | 0.039 | 0.054 -38% | 0.082 -110% | 0.076 -95% | 0.058 -49% | 0.04983 ? -28% | |
| Access Time Write * | 0.029 | 0.03 -3% | 0.041 -41% | 0.037 -28% | 0.071 -145% | 0.167 -476% | 0.04222 ? -46% |
| Score Read | 2008 | 2137 6% | 818 -59% | 1885 -6% | 1328 -34% | 913 -55% | 1786 ? -11% |
| Score Write | 2220 | 2546 15% | 1140 -49% | 2236 1% | 1343 -40% | 1034 -53% | 2144 ? -3% |
| Score Total | 5257 | 5774 10% | 2377 -55% | 5076 -3% | 3366 -36% | 2392 -54% | 4826 ? -8% |
| Total Average (Program / Settings) | 20% /
18% | -23% /
-27% | 9% /
7% | -4% /
-9% | -31% /
-39% | 4% /
2% |
* ... smaller is better
Continuous load read: DiskSpd Read Loop, Queue Depth 8
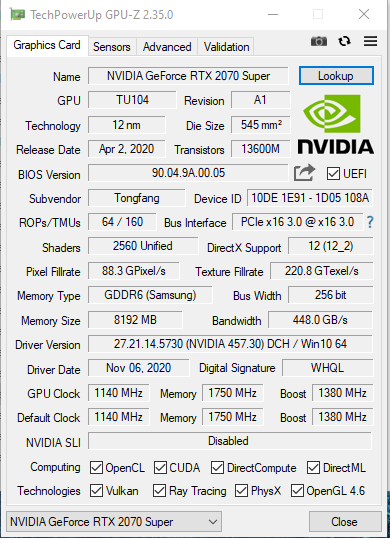
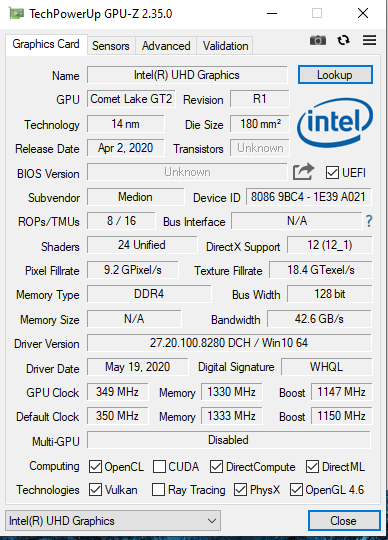
Graphics card
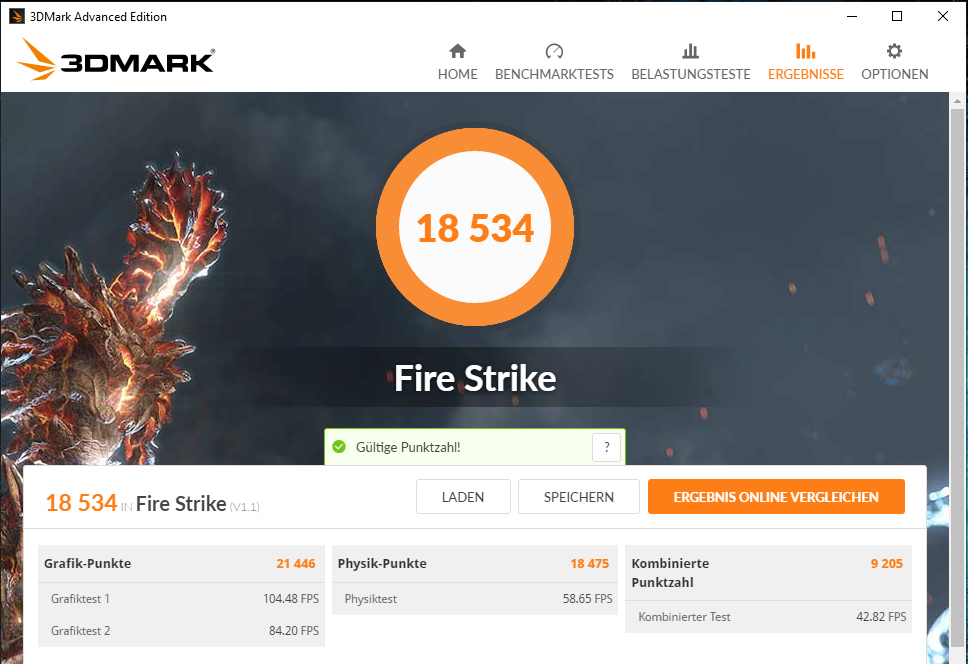
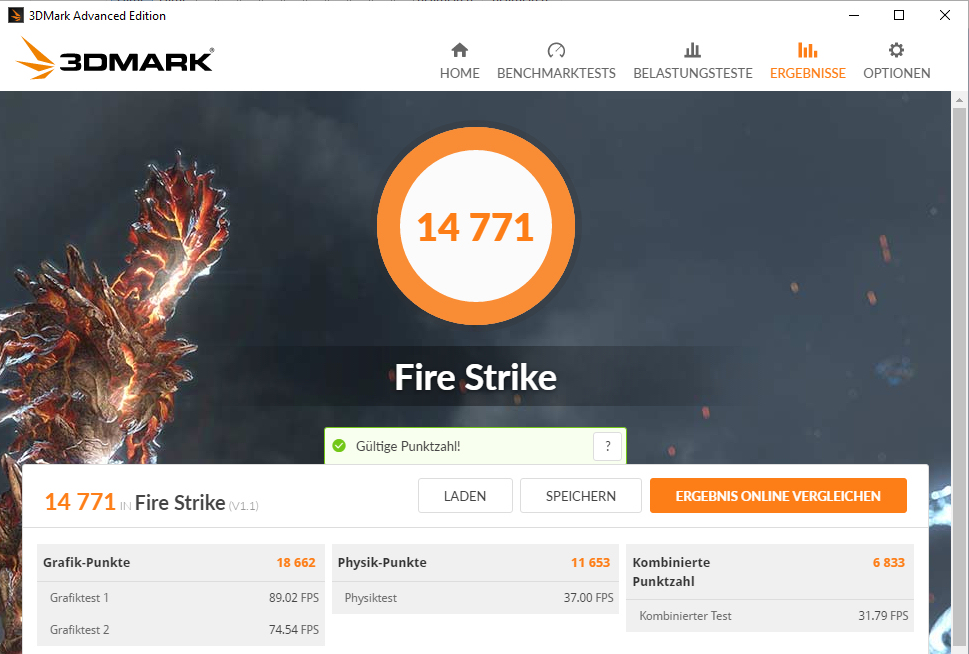
The GeForce RTX 2070 Super Max Q graphics core (Turing) is part of the GPU upper class. It's accompanied by fast GDDR6 memory (8,192 MB). The 3DMark results are at a normal level for the GPU used here. "Turbo Mode" doesn't increase graphics performance. The UHD Graphics 630 GPU integrated into the processor is active, and the laptop works with Nvidia's Optimus graphics-switching solution.
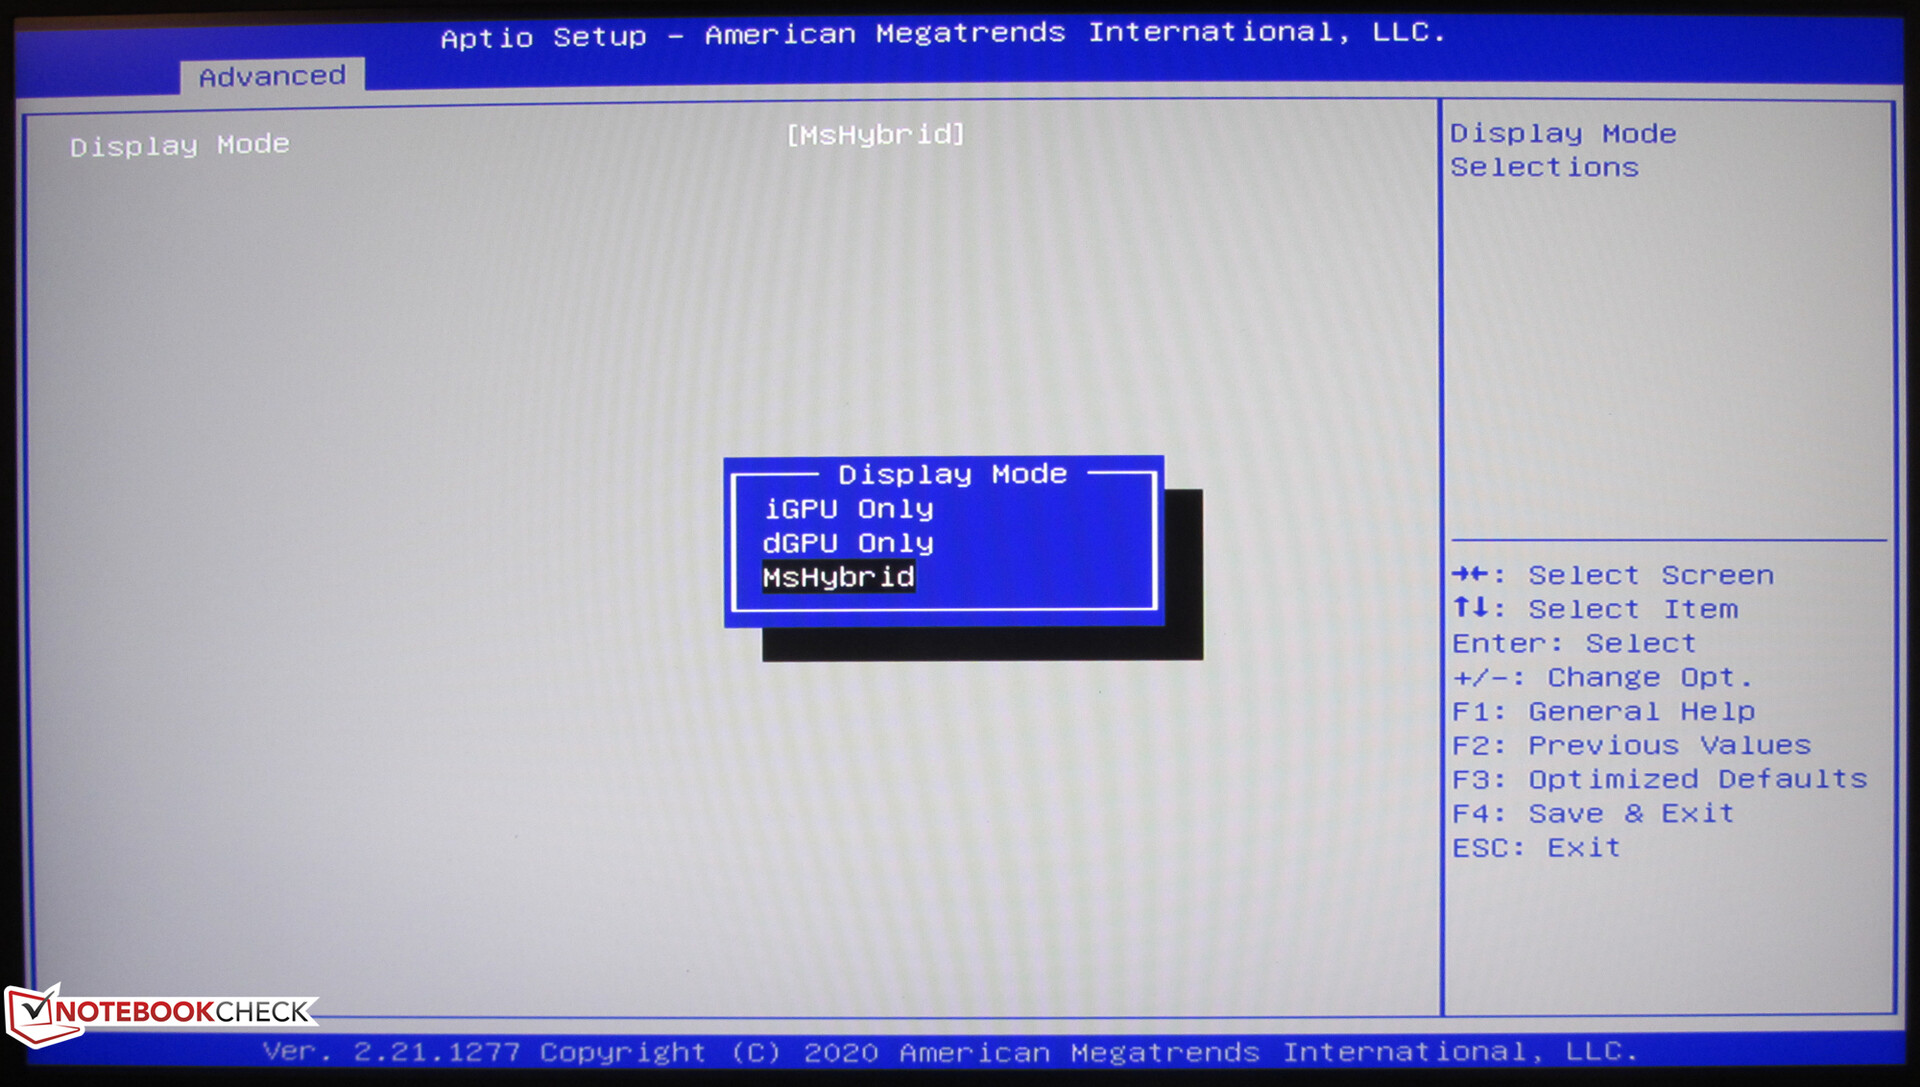
It's not mandatory to use Optimus. The laptop's BIOS offers three options: "MSHybrid" (= Optimus), "iGPU Only" (= UHD Graphics 630), "dGPU Only" (= 2070 Super). It's possible to connect the display directly to the GeForce GPU.


| 3DMark 11 Performance | 21735 points | |
| 3DMark Cloud Gate Standard Score | 40152 points | |
| 3DMark Fire Strike Score | 18534 points | |
| 3DMark Time Spy Score | 7736 points | |
Help | ||
Gaming performance
The Beast brings all the latest games at Full HD resolution and maximum quality settings smoothly onto the screen. Higher resolutions can also be supported by connecting an appropriate monitor - but you may have to make some compromises in terms of quality settings. "Turbo Mode" doesn't lead to an increase in frame rates.
| Watch Dogs Legion - 1920x1080 Ultra Preset (DX12) | |
| Average of class Gaming (18 - 127, n=14, last 2 years) | |
| SCHENKER XMG Neo 17 Comet Lake | |
| Medion Erazer Beast X10 MD61804 | |
| Average NVIDIA GeForce RTX 2070 Super Max-Q () | |
| Dirt 5 - 1920x1080 Ultra High Preset | |
| Average of class Gaming (54 - 110.5, n=6, last 2 years) | |
| Medion Erazer Beast X10 MD61804 | |
| Average NVIDIA GeForce RTX 2070 Super Max-Q () | |
| SCHENKER XMG Neo 17 Comet Lake | |
In order to verify whether the frame rates remain largely constant over a prolonged period of time, we let the game The Witcher 3 run for about 60 minutes at Full HD resolution and maximum quality settings. The character is not moved. A drop in frame rates wasn't found.
| low | med. | high | ultra | |
| The Witcher 3 (2015) | 326.3 | 254.1 | 163.1 | 92.5 |
| Total War: Three Kingdoms (2019) | 260.9 | 141.2 | 97.5 | 68.7 |
| Doom Eternal (2020) | 229.6 | 164.1 | 149.4 | 146.4 |
| Horizon Zero Dawn (2020) | 145 | 120 | 107 | 93 |
| Serious Sam 4 (2020) | 127 | 87.7 | 81.9 | 67.7 |
| Watch Dogs Legion (2020) | 100 | 96 | 84 | 59 |
| Dirt 5 (2020) | 160 | 95.6 | 78.2 | 65.1 |
| Assassin´s Creed Valhalla (2020) | 118 | 81 | 70 | 60 |
| Call of Duty Black Ops Cold War (2020) | 163.7 | 93.6 | 86.2 | 77.4 |
| Yakuza Like a Dragon (2020) | 135.7 | 102.6 | 101.6 | 86.1 |
Emissions - Medion laptop can run quietly
Noise emissions
In idle usage, the fans often stand still and there is silence. Otherwise, they operate at low speeds and produce a bearable noise level. That's all over under load. We register maximum sound pressure levels of 55 dB(A) (stress test) and 53 dB(A) (The Witcher 3 test), respectively. The use of a headset is recommended.
The laptop's noise development can be significantly reduced by using the "Office Mode" including the "Eco" option. The reduced CPU performance results in the fans needing to work less frequently.
The inside of the laptop emits an electronic whining/crackling sound that can be heard occasionally, for which the SSD is responsible. It occurs, for example, when performing the DiskLoop benchmark. We didn't encounter it in everyday operation.
Noise Level
| Idle |
| 26 / 29 / 35 dB(A) |
| Load |
| 52 / 55 dB(A) |
 | ||
30 dB silent 40 dB(A) audible 50 dB(A) loud |
||
min: | ||
| Medion Erazer Beast X10 MD61804 i7-10750H, GeForce RTX 2070 Super Max-Q | SCHENKER XMG Neo 17 Comet Lake i7-10875H, GeForce RTX 2070 Super Mobile | Asus Strix G17 G712LWS i7-10750H, GeForce RTX 2070 Super Mobile | Acer Predator Helios 300 PH317-54-75G8 i7-10750H, GeForce RTX 2060 Mobile | MSI GS75 10SF-609US i7-10875H, GeForce RTX 2070 Max-Q | Razer Blade Pro 17 RTX 2070 Max-Q 300 Hz i7-10875H, GeForce RTX 2070 Max-Q | Average NVIDIA GeForce RTX 2070 Super Max-Q | Average of class Gaming | |
|---|---|---|---|---|---|---|---|---|
| Noise | 3% | -5% | 3% | -4% | 2% | -5% | 7% | |
| off / environment * | 25 | 25 -0% | 25 -0% | 24 4% | 26.2 -5% | 28.2 -13% | 27.9 ? -12% | 24.1 ? 4% |
| Idle Minimum * | 26 | 26 -0% | 32 -23% | 25 4% | 31.2 -20% | 28.2 -8% | 30.8 ? -18% | 25.6 ? 2% |
| Idle Average * | 29 | 30 -3% | 34 -17% | 30 -3% | 31.4 -8% | 28.2 3% | 32.1 ? -11% | 27.4 ? 6% |
| Idle Maximum * | 35 | 33 6% | 37 -6% | 37 -6% | 34 3% | 30.5 13% | 35.8 ? -2% | 30.8 ? 12% |
| Load Average * | 52 | 50 4% | 51 2% | 48 8% | 49.5 5% | 42.2 19% | 47.5 ? 9% | 43 ? 17% |
| Witcher 3 ultra * | 53 | 50 6% | 50 6% | 50 6% | 50.6 5% | 53 -0% | ||
| Load Maximum * | 55 | 52 5% | 53 4% | 52 5% | 60.7 -10% | 55.5 -1% | 52.3 ? 5% | 53.4 ? 3% |
* ... smaller is better
Temperature
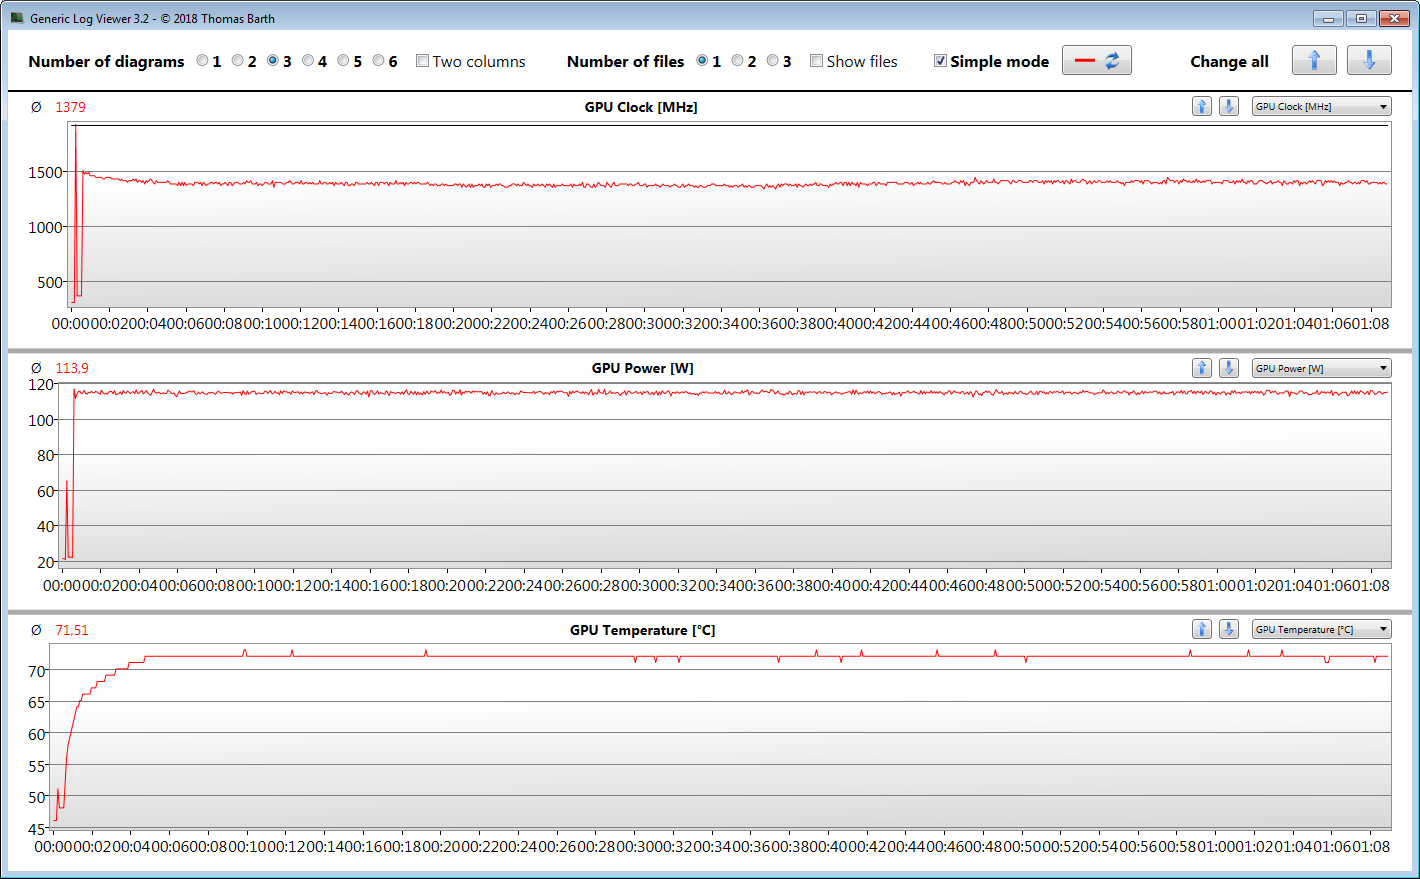
Our stress test (Prime95 and FurMark run for at least an hour) is run by the CPU and GPU at 2.4 to 2.5 GHz and 1,440 MHz, respectively. The stress test represents an extreme scenario that doesn't occur in everyday life. With this test we check if the system remains stable even under full load.
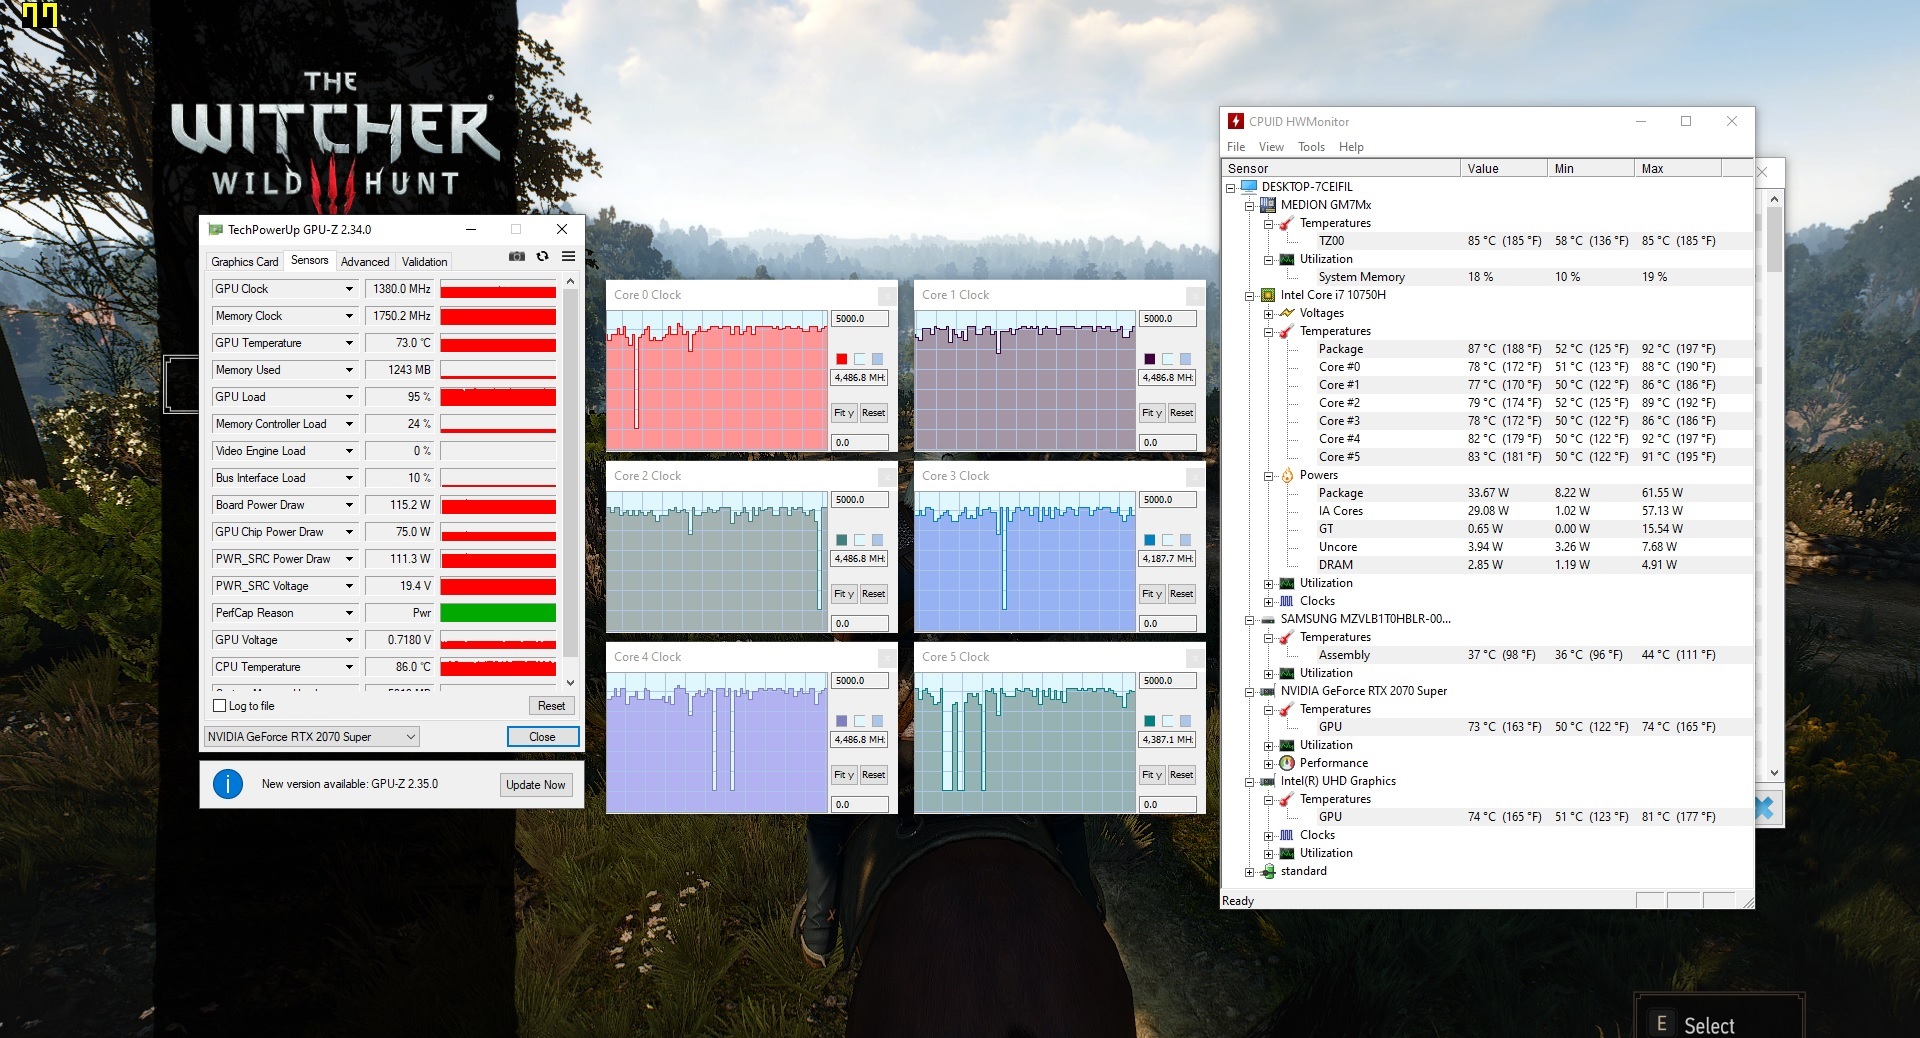
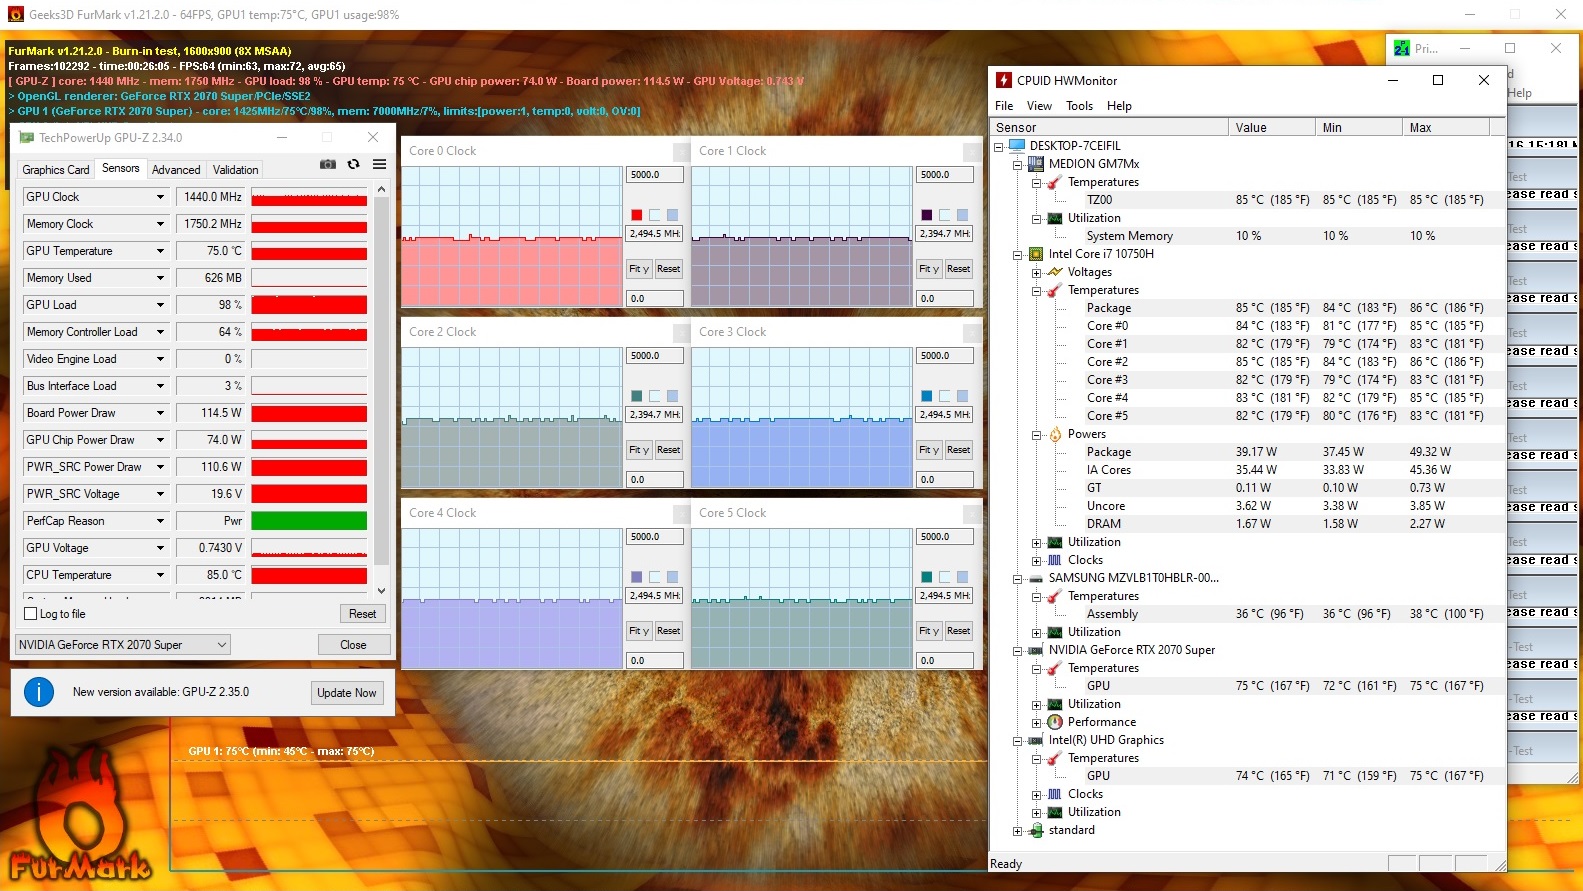
During the stress test, we register temperatures above 50 °C (~122 °F) at several measuring points. The temperature rise during our The Witcher 3 test is at about the same level. As a result, the device shouldn't be placed on the lap. In everyday use, however, the temperatures are in the green range.
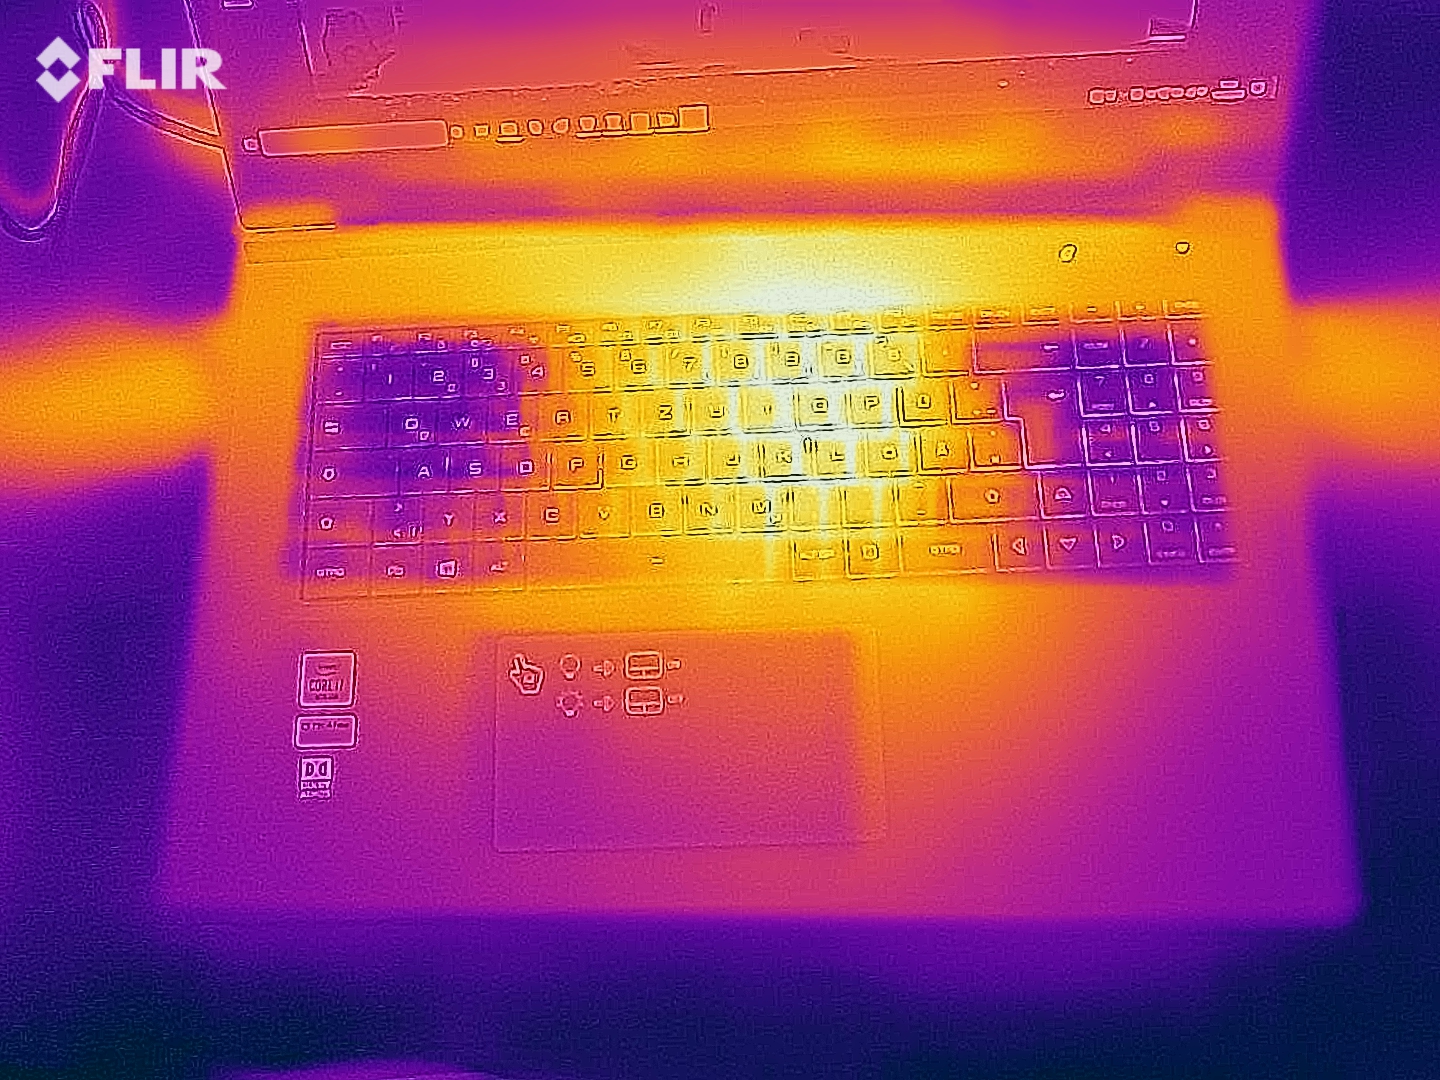
(-) The maximum temperature on the upper side is 51 °C / 124 F, compared to the average of 40.4 °C / 105 F, ranging from 21.2 to 68.8 °C for the class Gaming.
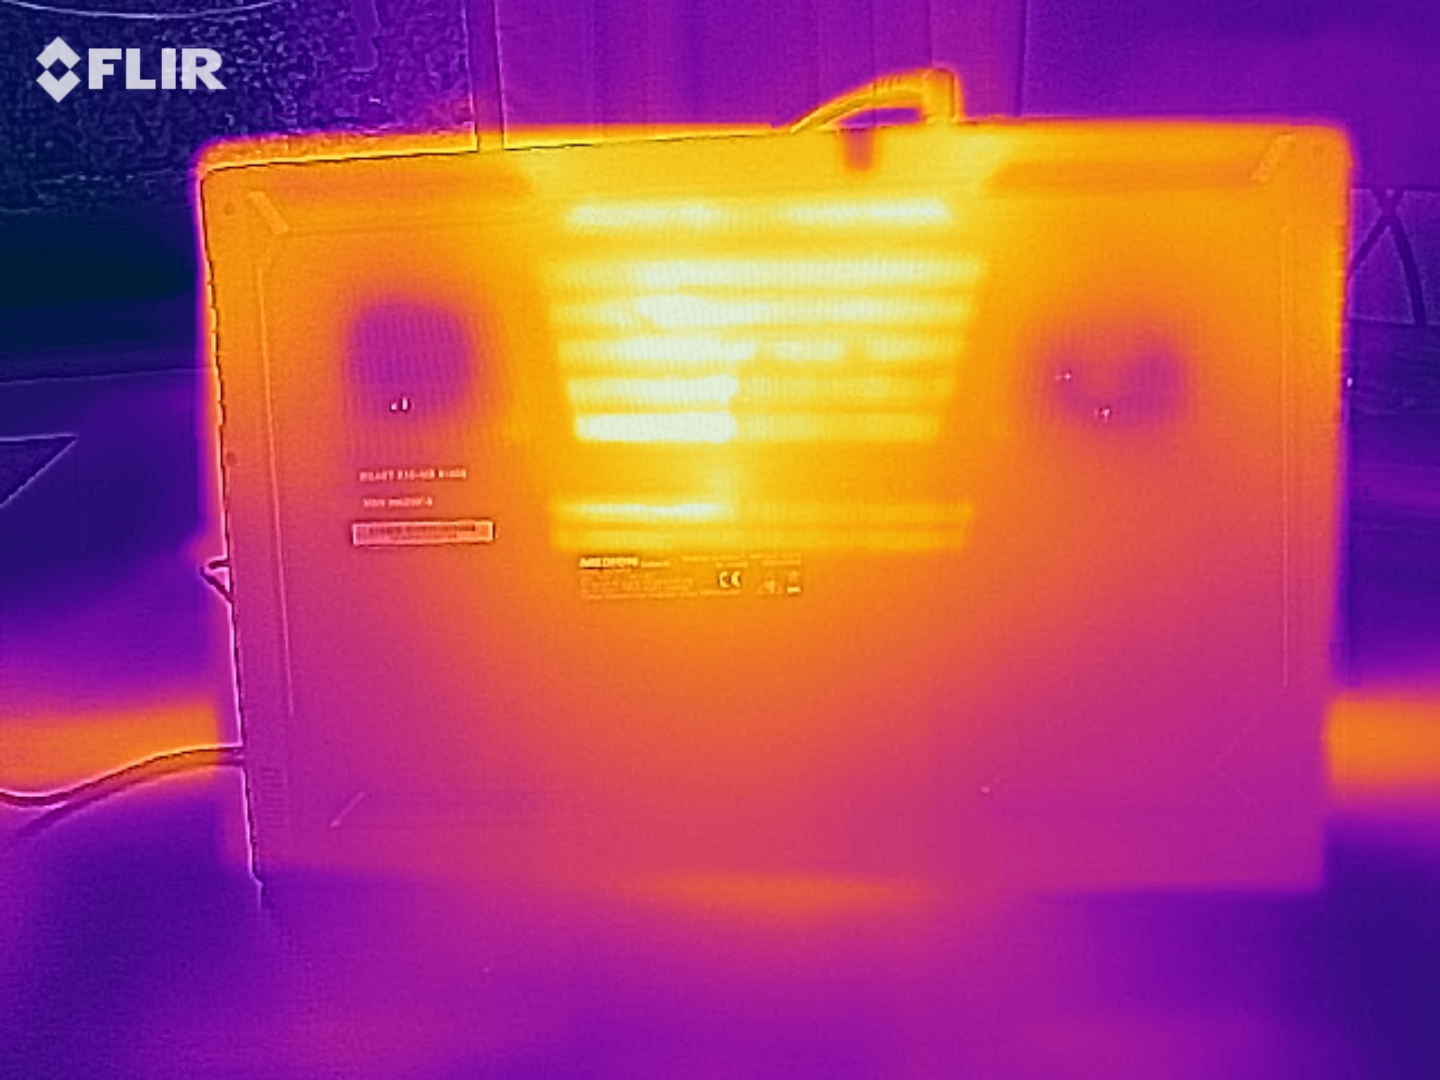
(-) The bottom heats up to a maximum of 56 °C / 133 F, compared to the average of 43.2 °C / 110 F
(+) In idle usage, the average temperature for the upper side is 28.8 °C / 84 F, compared to the device average of 33.8 °C / 93 F.
(-) Playing The Witcher 3, the average temperature for the upper side is 43 °C / 109 F, compared to the device average of 33.8 °C / 93 F.
(-) The palmrests and touchpad can get very hot to the touch with a maximum of 40 °C / 104 F.
(-) The average temperature of the palmrest area of similar devices was 28.9 °C / 84 F (-11.1 °C / -20 F).
| Medion Erazer Beast X10 MD61804 i7-10750H, GeForce RTX 2070 Super Max-Q | SCHENKER XMG Neo 17 Comet Lake i7-10875H, GeForce RTX 2070 Super Mobile | Asus Strix G17 G712LWS i7-10750H, GeForce RTX 2070 Super Mobile | Acer Predator Helios 300 PH317-54-75G8 i7-10750H, GeForce RTX 2060 Mobile | MSI GS75 10SF-609US i7-10875H, GeForce RTX 2070 Max-Q | Razer Blade Pro 17 RTX 2070 Max-Q 300 Hz i7-10875H, GeForce RTX 2070 Max-Q | Average NVIDIA GeForce RTX 2070 Super Max-Q | Average of class Gaming | |
|---|---|---|---|---|---|---|---|---|
| Heat | 1% | -0% | -3% | 1% | -6% | -1% | 3% | |
| Maximum Upper Side * | 51 | 48 6% | 53 -4% | 53 -4% | 49.8 2% | 40.8 20% | 49.5 ? 3% | 46 ? 10% |
| Maximum Bottom * | 56 | 54 4% | 56 -0% | 59 -5% | 55.6 1% | 48.4 14% | 58.4 ? -4% | 49.5 ? 12% |
| Idle Upper Side * | 31 | 30 3% | 29 6% | 29 6% | 28.2 9% | 36.8 -19% | 29.3 ? 5% | 31.4 ? -1% |
| Idle Bottom * | 30 | 33 -10% | 31 -3% | 32 -7% | 32.2 -7% | 41.2 -37% | 31.9 ? -6% | 32.5 ? -8% |
* ... smaller is better
Speakers
The stereo speakers produce a decent sound that can hardly provide any bass, though. For a better sound experience, we recommend the use of headphones or external speakers.
Medion Erazer Beast X10 MD61804 audio analysis
(±) | speaker loudness is average but good (76 dB)
Bass 100 - 315 Hz
(-) | nearly no bass - on average 21.7% lower than median
(±) | linearity of bass is average (13.7% delta to prev. frequency)
Mids 400 - 2000 Hz
(+) | balanced mids - only 2.6% away from median
(+) | mids are linear (4.7% delta to prev. frequency)
Highs 2 - 16 kHz
(+) | balanced highs - only 3.1% away from median
(+) | highs are linear (5.7% delta to prev. frequency)
Overall 100 - 16.000 Hz
(±) | linearity of overall sound is average (17.1% difference to median)
Compared to same class
» 43% of all tested devices in this class were better, 12% similar, 45% worse
» The best had a delta of 6%, average was 18%, worst was 132%
Compared to all devices tested
» 26% of all tested devices were better, 8% similar, 67% worse
» The best had a delta of 4%, average was 25%, worst was 134%
Energy management - The Medion laptop offers good battery life
Energy consumption
The X10 doesn't show irregularities in terms of energy consumption. In idle usage, we register a maximum power consumption of 30 watts. The stress test and our The Witcher 3 test let the power demand increase up to 274 watts and to an average of 176 watts, respectively. The power adapter's output is 230 watts.
| Idle | |
| Load |
|
| Medion Erazer Beast X10 MD61804 i7-10750H, GeForce RTX 2070 Super Max-Q | SCHENKER XMG Neo 17 Comet Lake i7-10875H, GeForce RTX 2070 Super Mobile | Asus Strix G17 G712LWS i7-10750H, GeForce RTX 2070 Super Mobile | Acer Predator Helios 300 PH317-54-75G8 i7-10750H, GeForce RTX 2060 Mobile | MSI GS75 10SF-609US i7-10875H, GeForce RTX 2070 Max-Q | Razer Blade Pro 17 RTX 2070 Max-Q 300 Hz i7-10875H, GeForce RTX 2070 Max-Q | Average NVIDIA GeForce RTX 2070 Super Max-Q | Average of class Gaming | |
|---|---|---|---|---|---|---|---|---|
| Power Consumption | 2% | 16% | 37% | 2% | 2% | 9% | 13% | |
| Idle Minimum * | 19 | 17 11% | 10 47% | 6 68% | 19.2 -1% | 19.6 -3% | 15.3 ? 19% | 13.7 ? 28% |
| Idle Average * | 22 | 20 9% | 14 36% | 11 50% | 22.4 -2% | 21.7 1% | 19.3 ? 12% | 19.1 ? 13% |
| Idle Maximum * | 30 | 29 3% | 25 17% | 19 37% | 34.7 -16% | 36.1 -20% | 30.5 ? -2% | 26.8 ? 11% |
| Load Average * | 118 | 121 -3% | 134 -14% | 96 19% | 106.7 10% | 115.6 2% | 108.5 ? 8% | 110.9 ? 6% |
| Witcher 3 ultra * | 176 | 199 -13% | 186 -6% | 144 18% | 160.5 9% | 157 11% | ||
| Load Maximum * | 274 | 258 6% | 230 16% | 197 28% | 248.7 9% | 219.9 20% | 246 ? 10% | 250 ? 9% |
* ... smaller is better
Battery life
The battery life is good overall. Our WLAN test (accessing websites using a script) and video test (the short film Big Buck Bunny [H.264 encoding, Full HD] running in a loop) are completed by the 17.3-incher after 6:50 hours and 8:29 hours, respectively. The power-saving functions are deactivated during both tests, and the display brightness is adjusted to about 150 cd/m². To perform the video test, the wireless modules are also switched off.
| Medion Erazer Beast X10 MD61804 i7-10750H, GeForce RTX 2070 Super Max-Q, 91.2 Wh | SCHENKER XMG Neo 17 Comet Lake i7-10875H, GeForce RTX 2070 Super Mobile, 62.32 Wh | Asus Strix G17 G712LWS i7-10750H, GeForce RTX 2070 Super Mobile, 66 Wh | Acer Predator Helios 300 PH317-54-75G8 i7-10750H, GeForce RTX 2060 Mobile, 59 Wh | MSI GS75 10SF-609US i7-10875H, GeForce RTX 2070 Max-Q, 80.25 Wh | Razer Blade Pro 17 RTX 2070 Max-Q 300 Hz i7-10875H, GeForce RTX 2070 Max-Q, 70 Wh | Average of class Gaming | |
|---|---|---|---|---|---|---|---|
| Battery Runtime | -45% | -19% | -18% | 18% | -28% | -20% | |
| Reader / Idle | 684 | 543 -21% | 493 -28% | 513 -25% | 544 ? -20% | ||
| H.264 | 509 | 426 -16% | 353 -31% | 399 ? -22% | |||
| WiFi v1.3 | 410 | 227 -45% | 330 -20% | 306 -25% | 295 -28% | 296 -28% | 368 ? -10% |
| Load | 117 | 94 -20% | 133 14% | 243 108% | 84.2 ? -28% |
Pros
Cons
Verdict
Medion's 17.3-inch gaming laptop brings all the latest games onto the screen smoothly thanks to the Core i7-10750H processor and the GeForce RTX 2070 Super Max Q GPU. The hardware comes with 32 GB of RAM (dual-channel mode, max. 64 GB), and a 1 TB NVMe SSD.
The noise development, which is quite high in gaming mode, can be reduced to obtain a comfortable everyday use of the laptop. An "Eco" mode lowers the CPU performance and consequently the noise emissions. The Core i7 is then roughly at the performance level of ULV CPUs - enough for office and Internet applications.
With the Erazer Beast X10, Medion delivers a slim, compact gaming laptop that can be described as a success.
The laptop comes with a 91 Wh battery, which is good for practical runtimes (WLAN operation, video playback, word processing) of 7 to 8 hours. The responsive, viewing-angle stable display (Full HD, IPS, 144 Hz) offers good color reproduction. Brightness and contrast are okay. The Thunderbolt 3 port allows the connection of extensive docking solutions or an external GPU. In addition, the fancy and very stable full metal case deserves praise.
Tip: In the period from August 28, 2020 to February 28, 2021, the purchase of the Beast X10 includes the game "Marvel's Avengers" as a free download. However, not from Medion but from Intel. The corresponding promotion code ("while stocks last") is sent by e-mail and must be redeemed with Intel by March 31, 2021. Medion has informed us that the procedure for claiming the code is explained in detail in the e-mail. The offer is not limited to Medion. Other laptop manufacturers are also participating in this Intel promotion.
Medion Erazer Beast X10 MD61804
-
11/26/2020 v7
Sascha Mölck
More articles related to this device
Medion Erazer Beast X10 MD61804 (Erazer Series)Related Articles

Pricecompare

