 Deutsch
 English
 Español
 Français
 Italiano
 Nederlands
 Polski
 Português
 Русский
 Türkçe
 Svenska
 Chinese
 Magyar
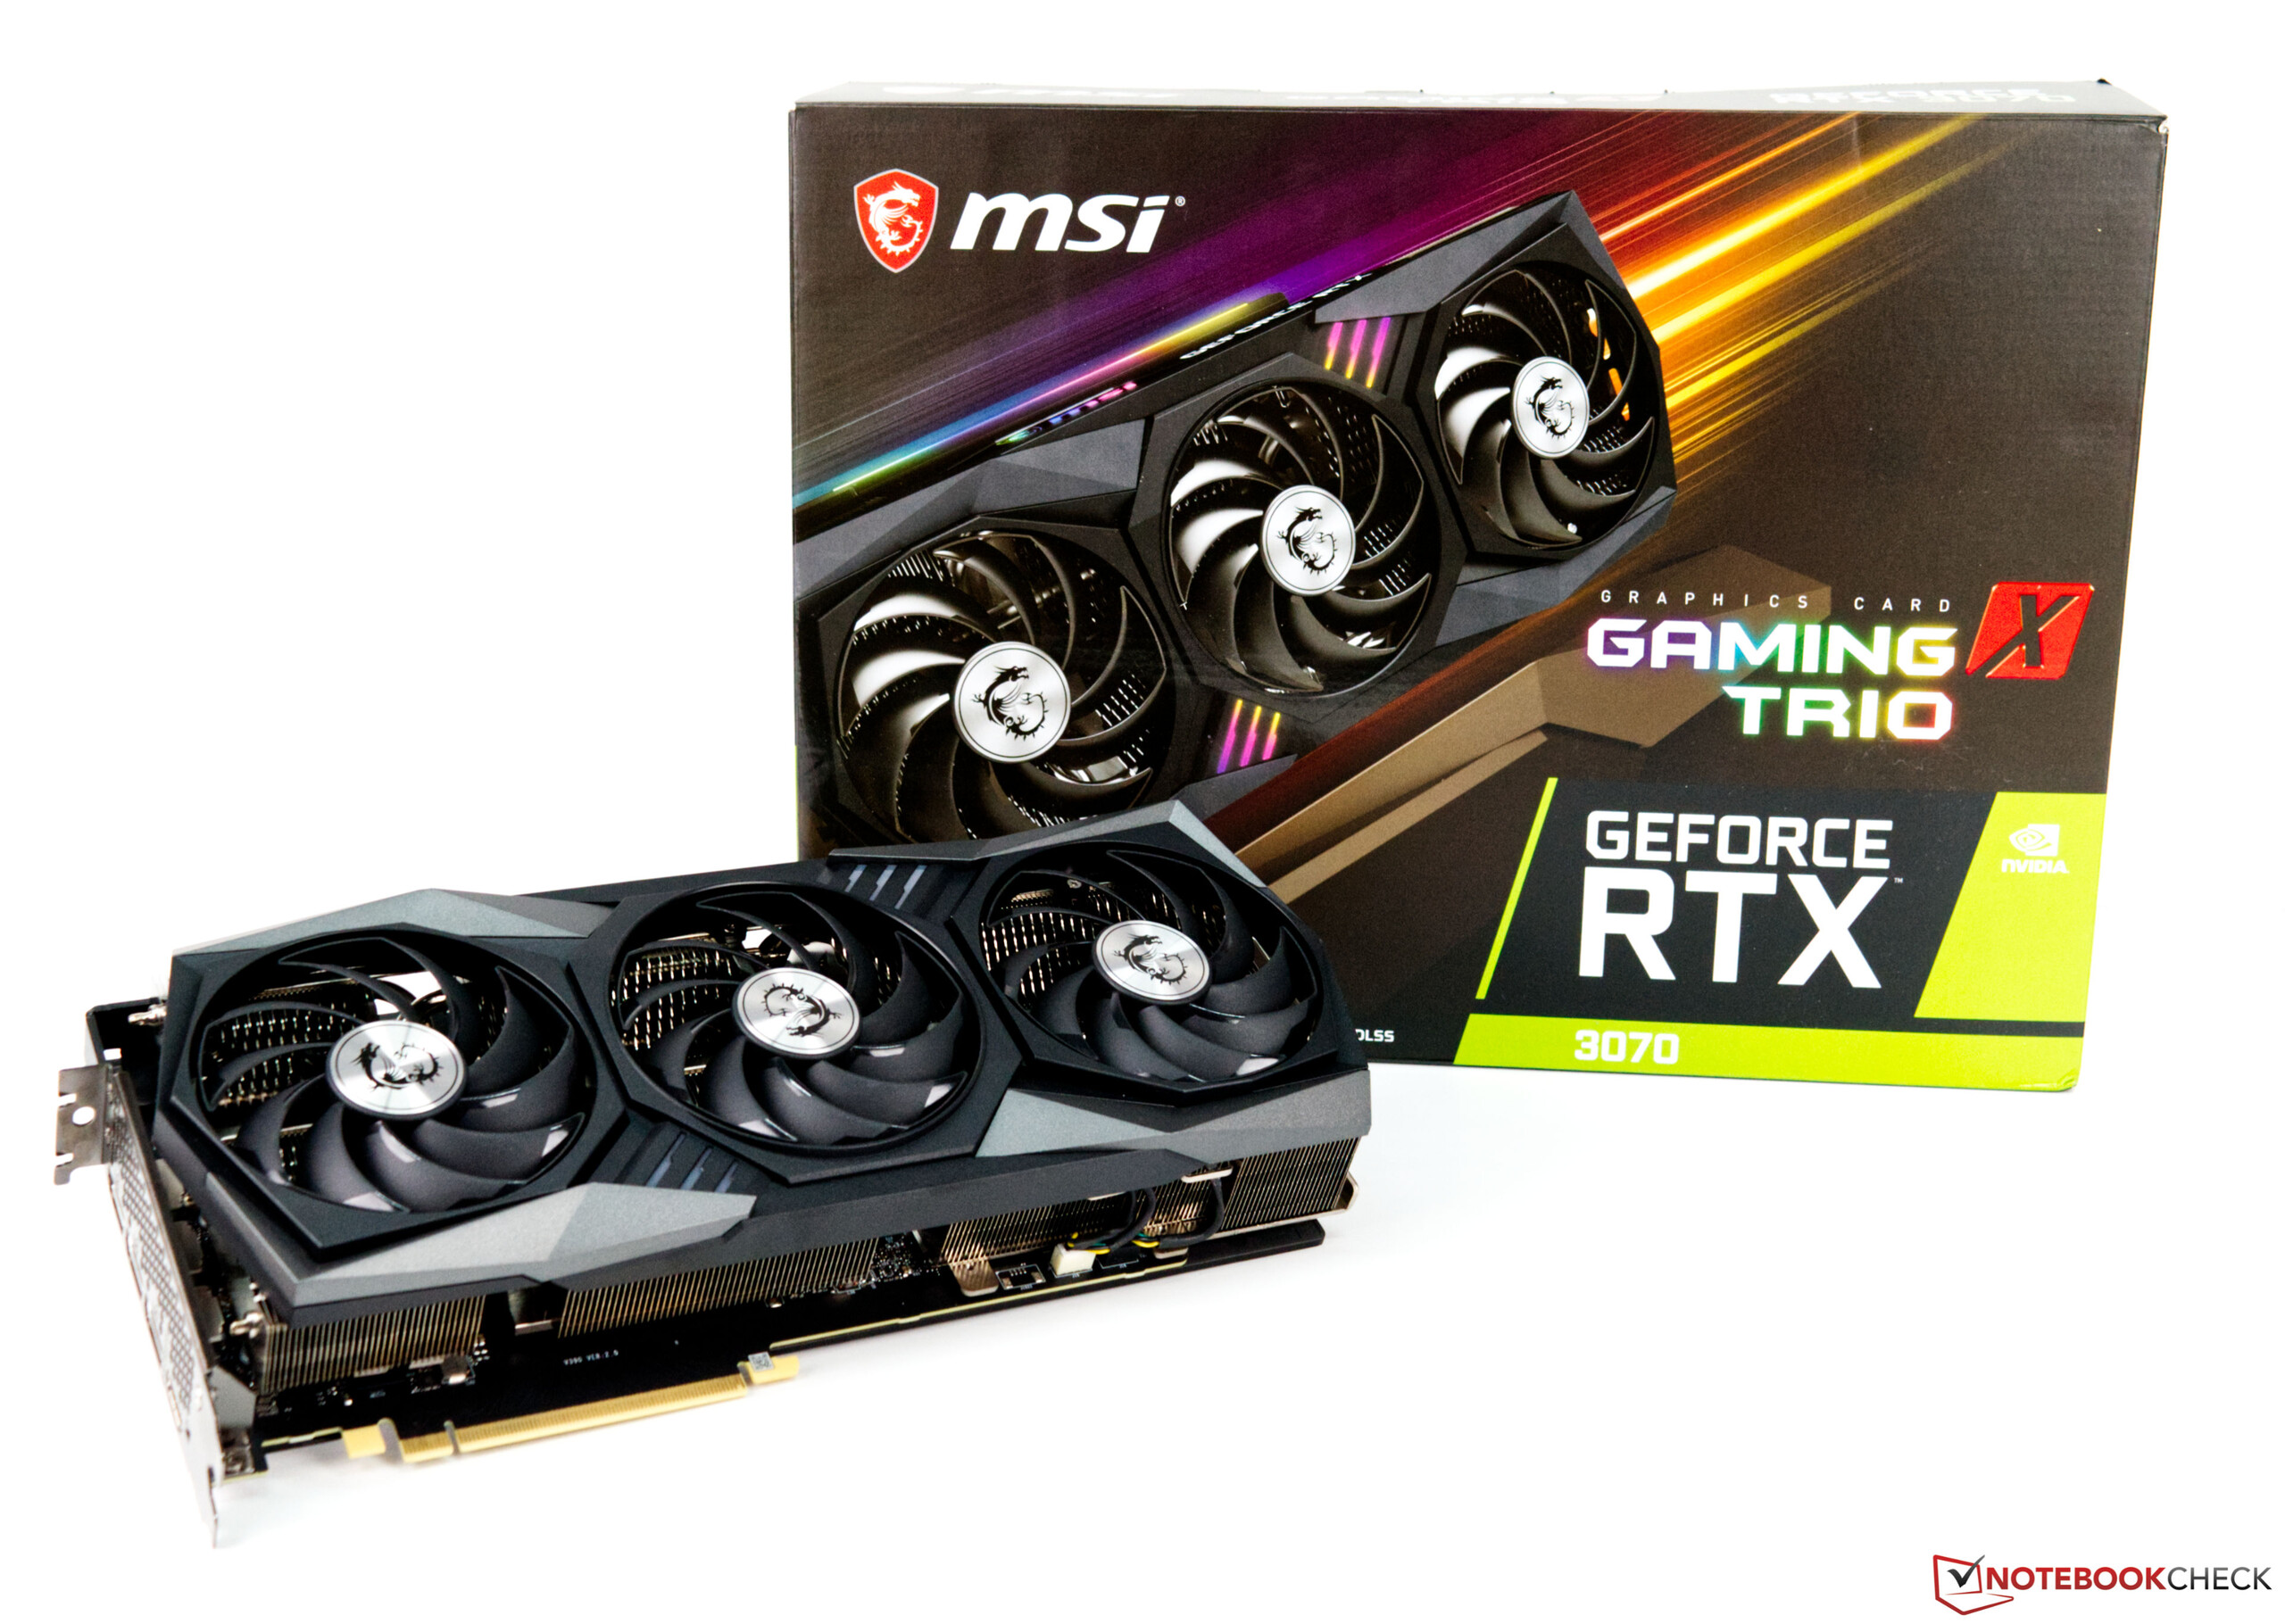
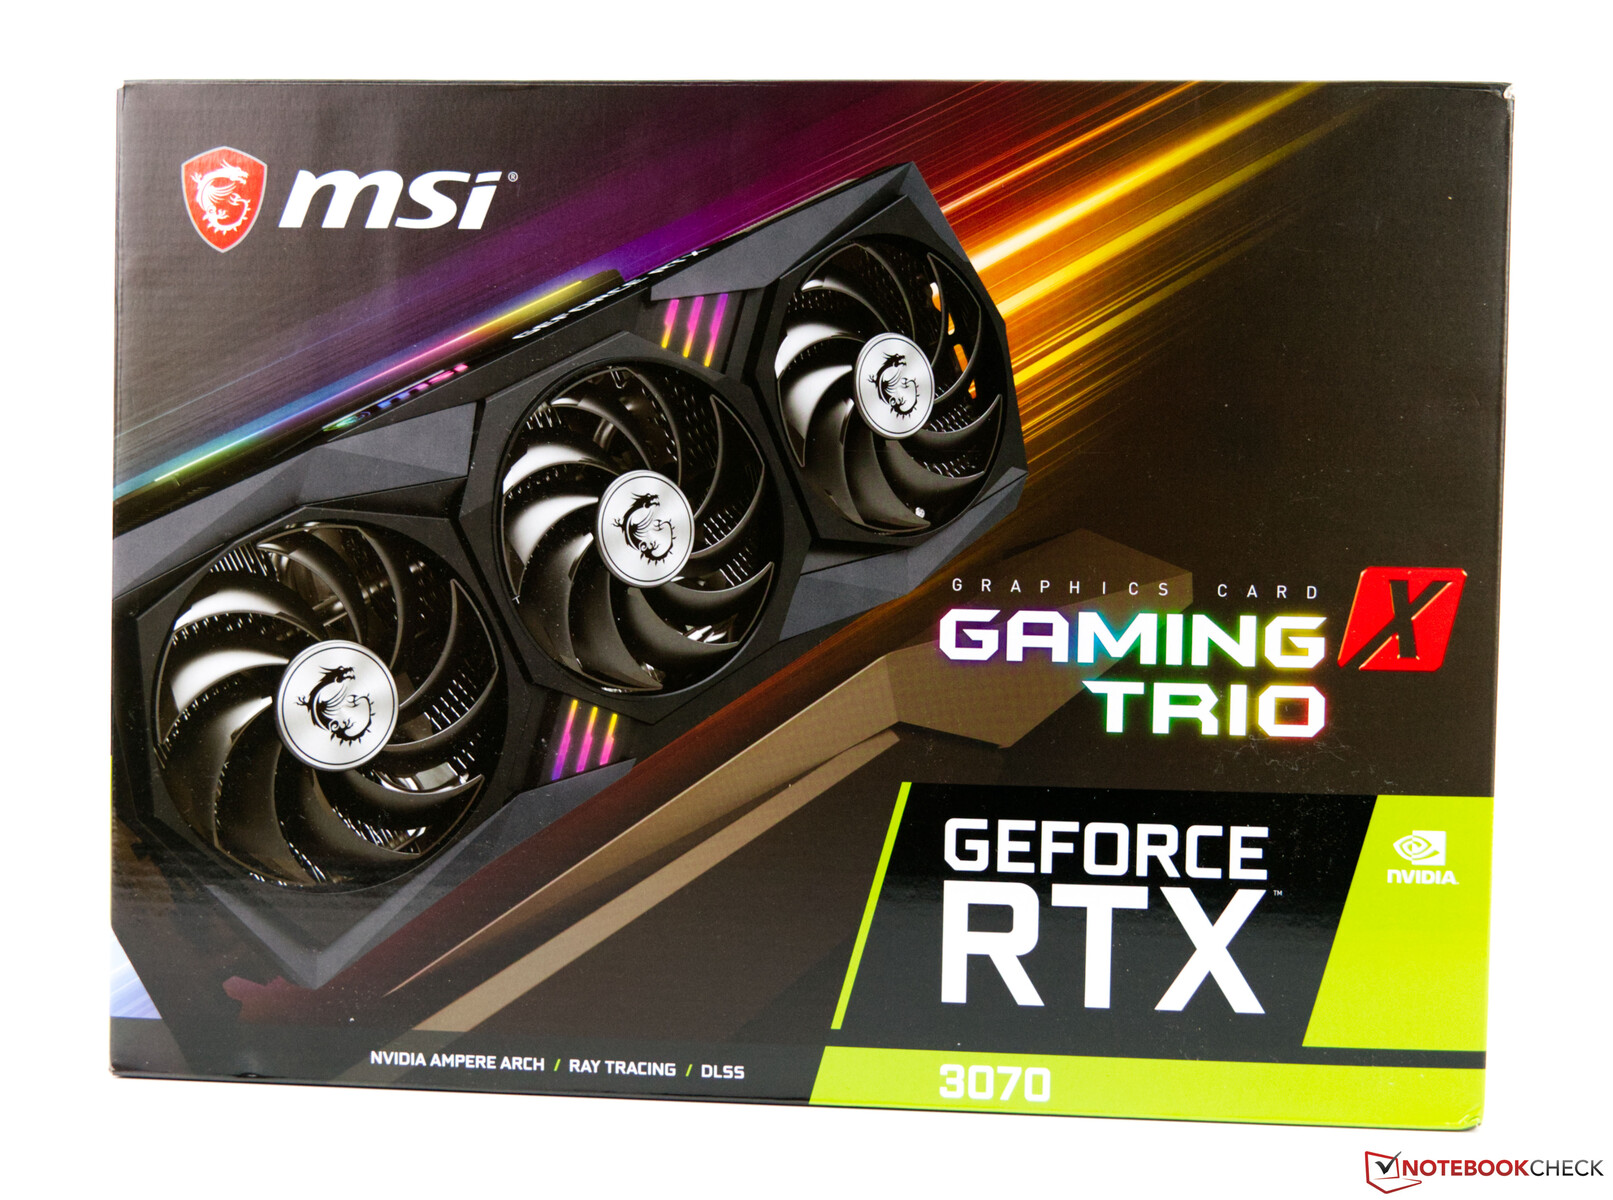
MSI GeForce RTX 3070 Gaming X Trio desktop graphics card in review
The Ampere architecture made its debut earlier this year, although initially only for the server market. The gaming devices based on the new chips manufactured in 8 nm came next. After initial testing, some of them have significantly outperformed the Turing graphics cards. Depending on the application case, Ampere offers up to 30% more performance than Turing.
In this way, the GeForce RTX 3070, as successor to the GeForce 2070 Super, takes a relatively light inheritance, because performance is significantly exceeded and is comparable to a GeForce RTX 2080 Ti. Conversely, this means more performance for a lower price for customers, because the GeForce RTX 2080 Ti cost 999 Euros (~$1,189) at release, while Nvidia charges 499 Euros (~$594) for the RTX 3070 Founders Edition. Depending on the custom model, prices increased due to better cooling solutions. This also applies to the current generation, because our GeForce RTX 3070 Gaming X Trio from MSI currently costs just under 720 Euros (~$857), when it's even available. This brings us straight to the next topic, because the scarce stocks have caused an additional increase in prices since the release. But it's not only Nvidia that is feeling the discontent from customers, since AMD is also struggling with this problem. Unfortunately, it's currently impossible to say when this situation will improve.
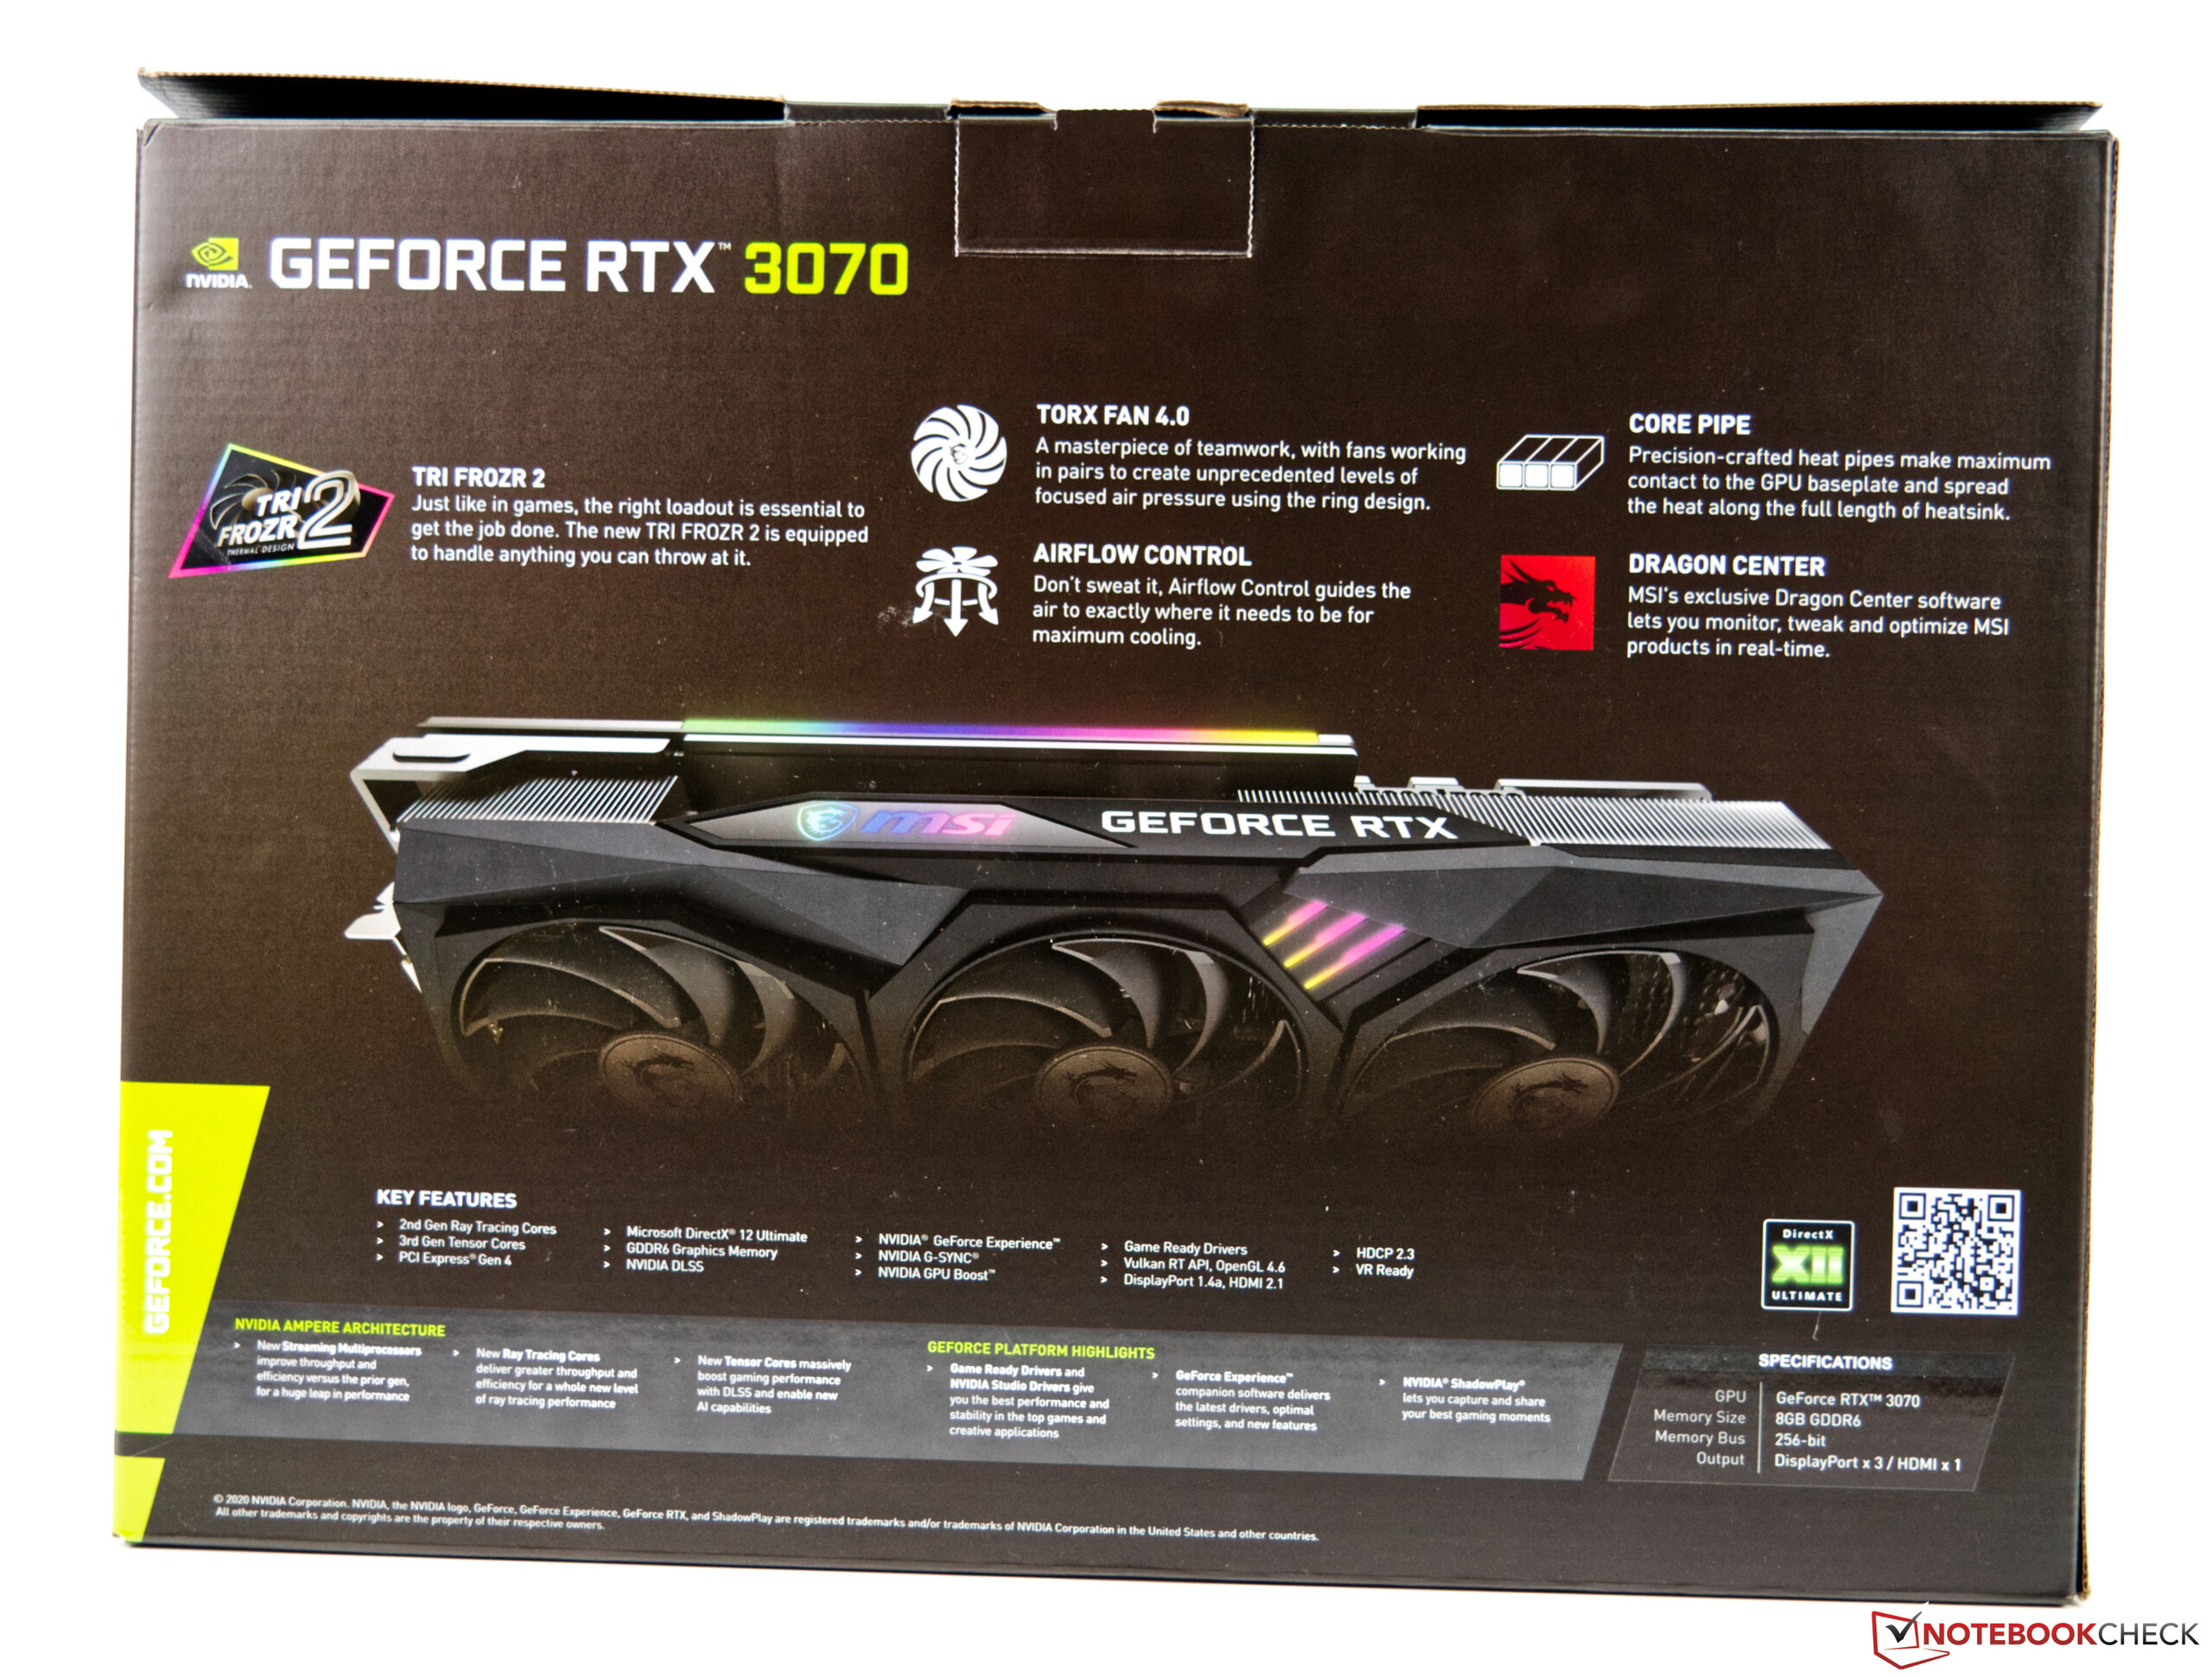
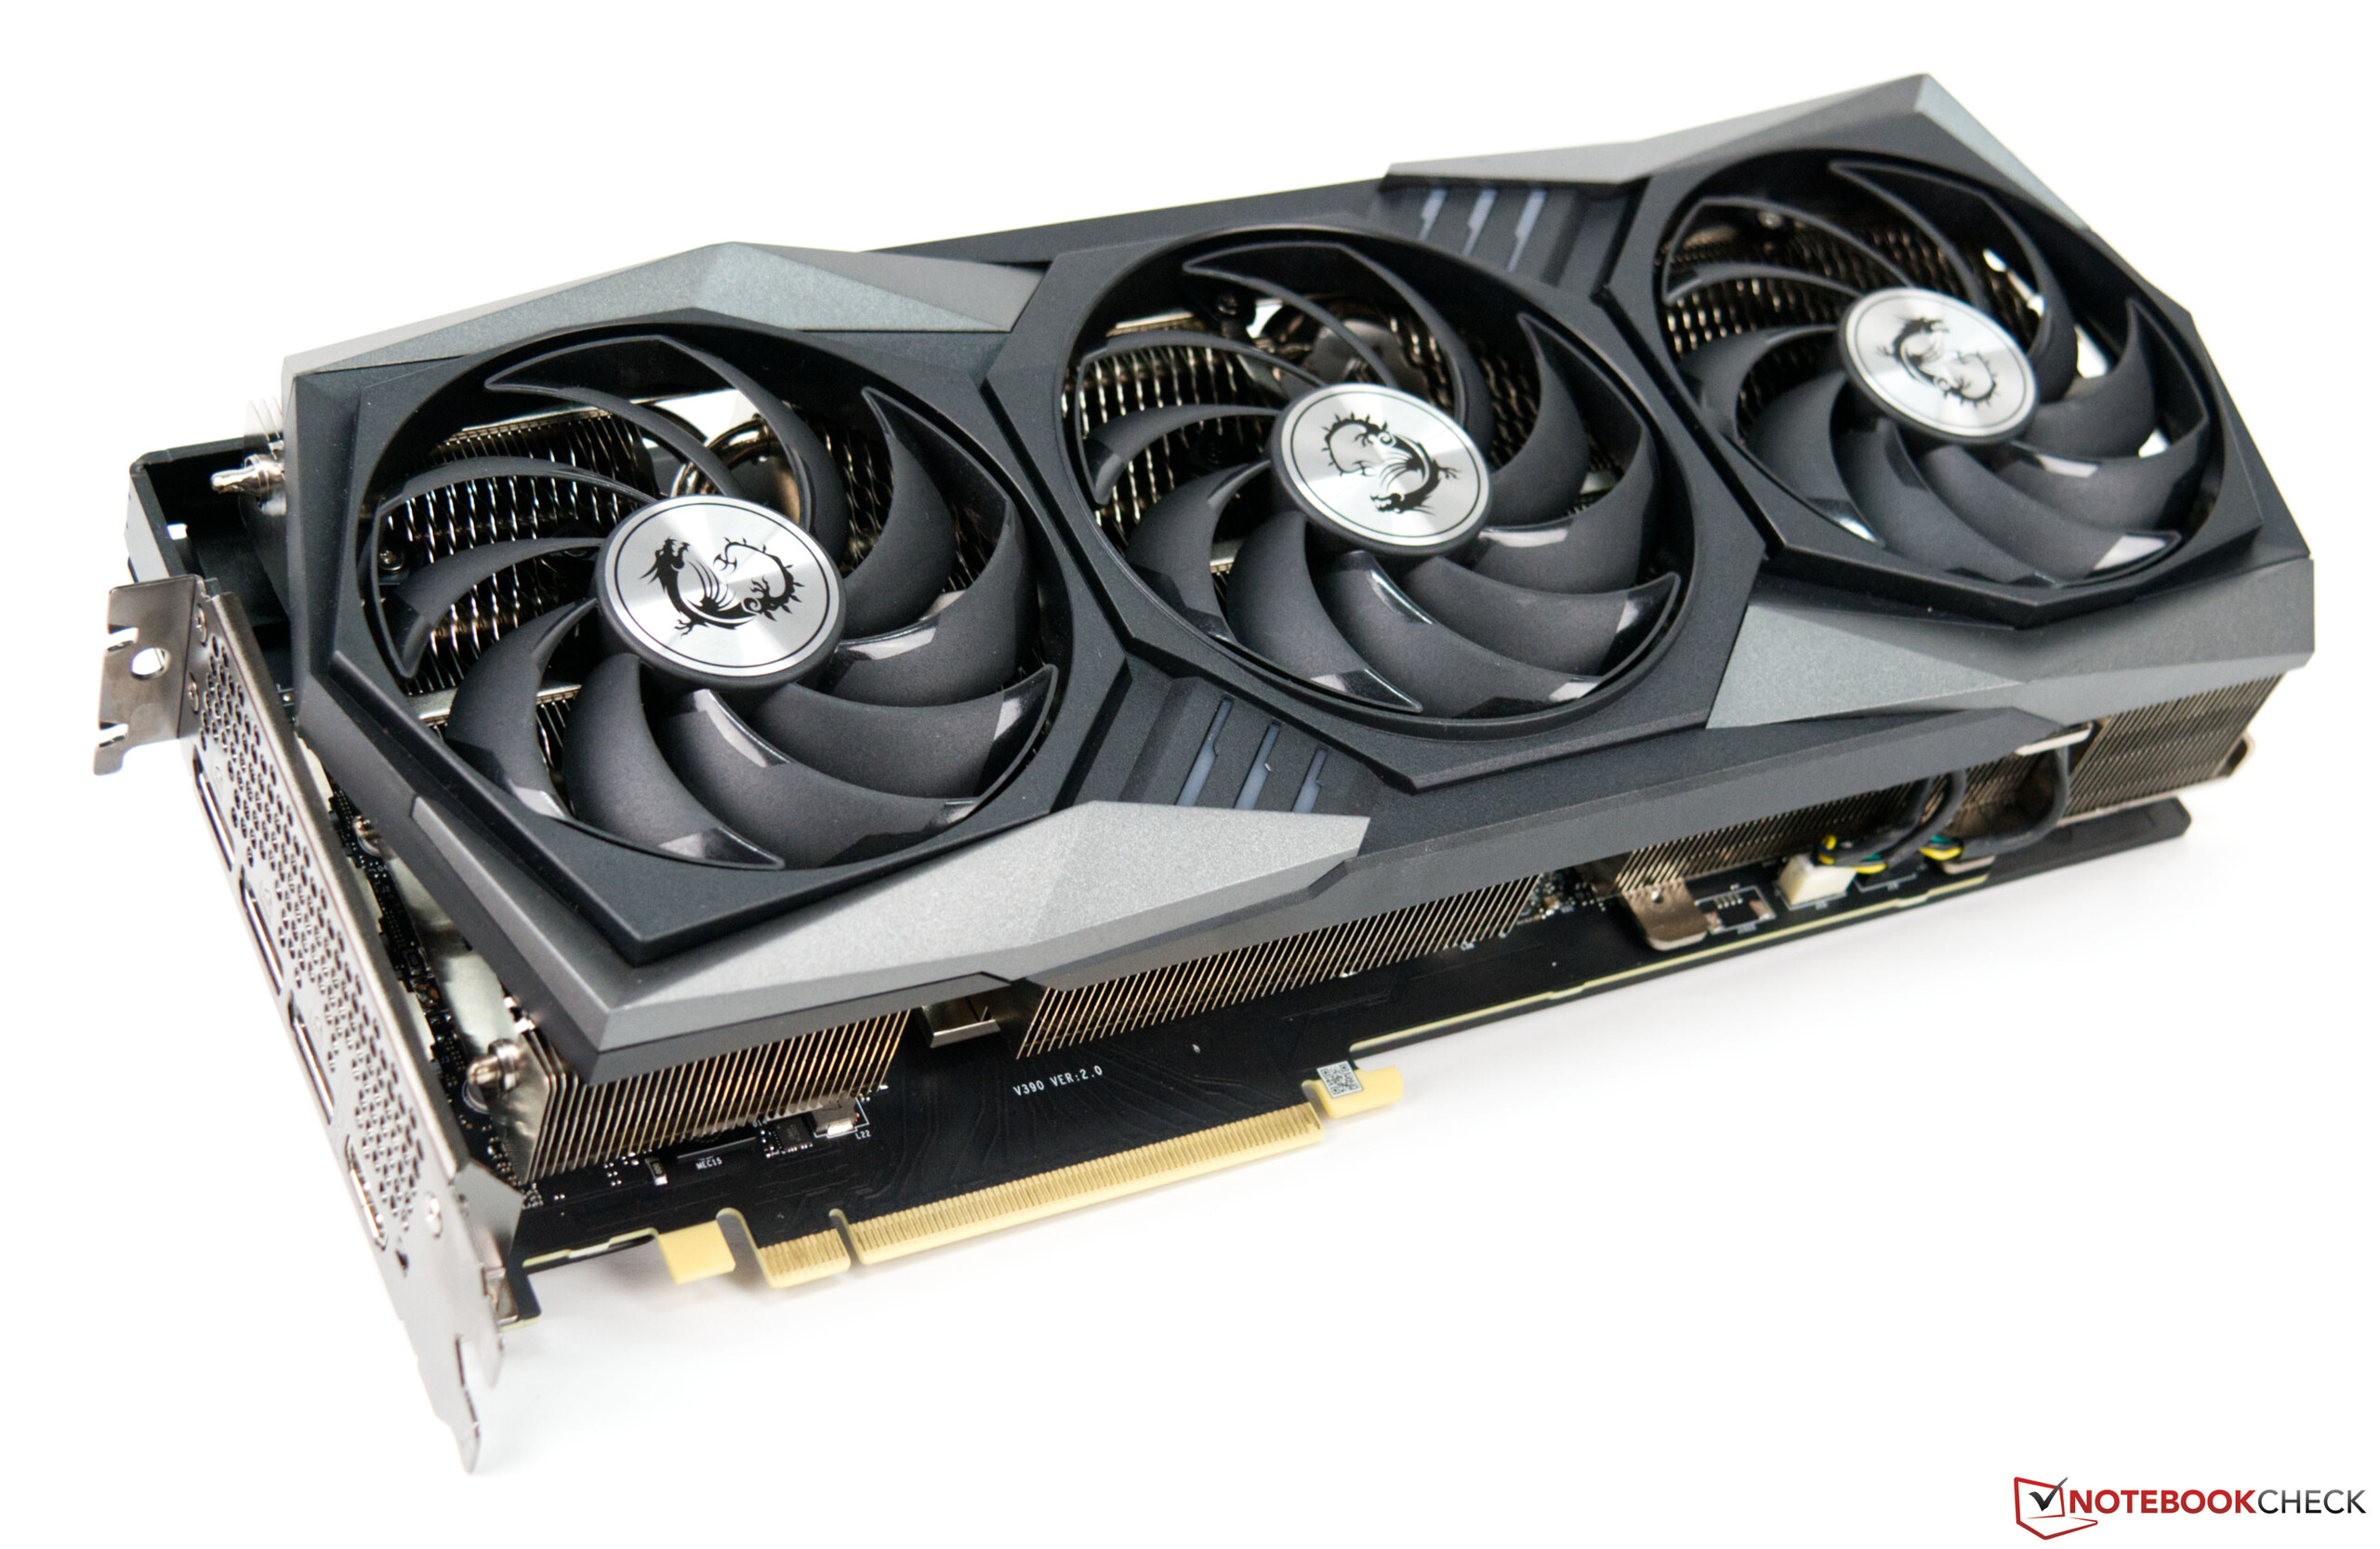
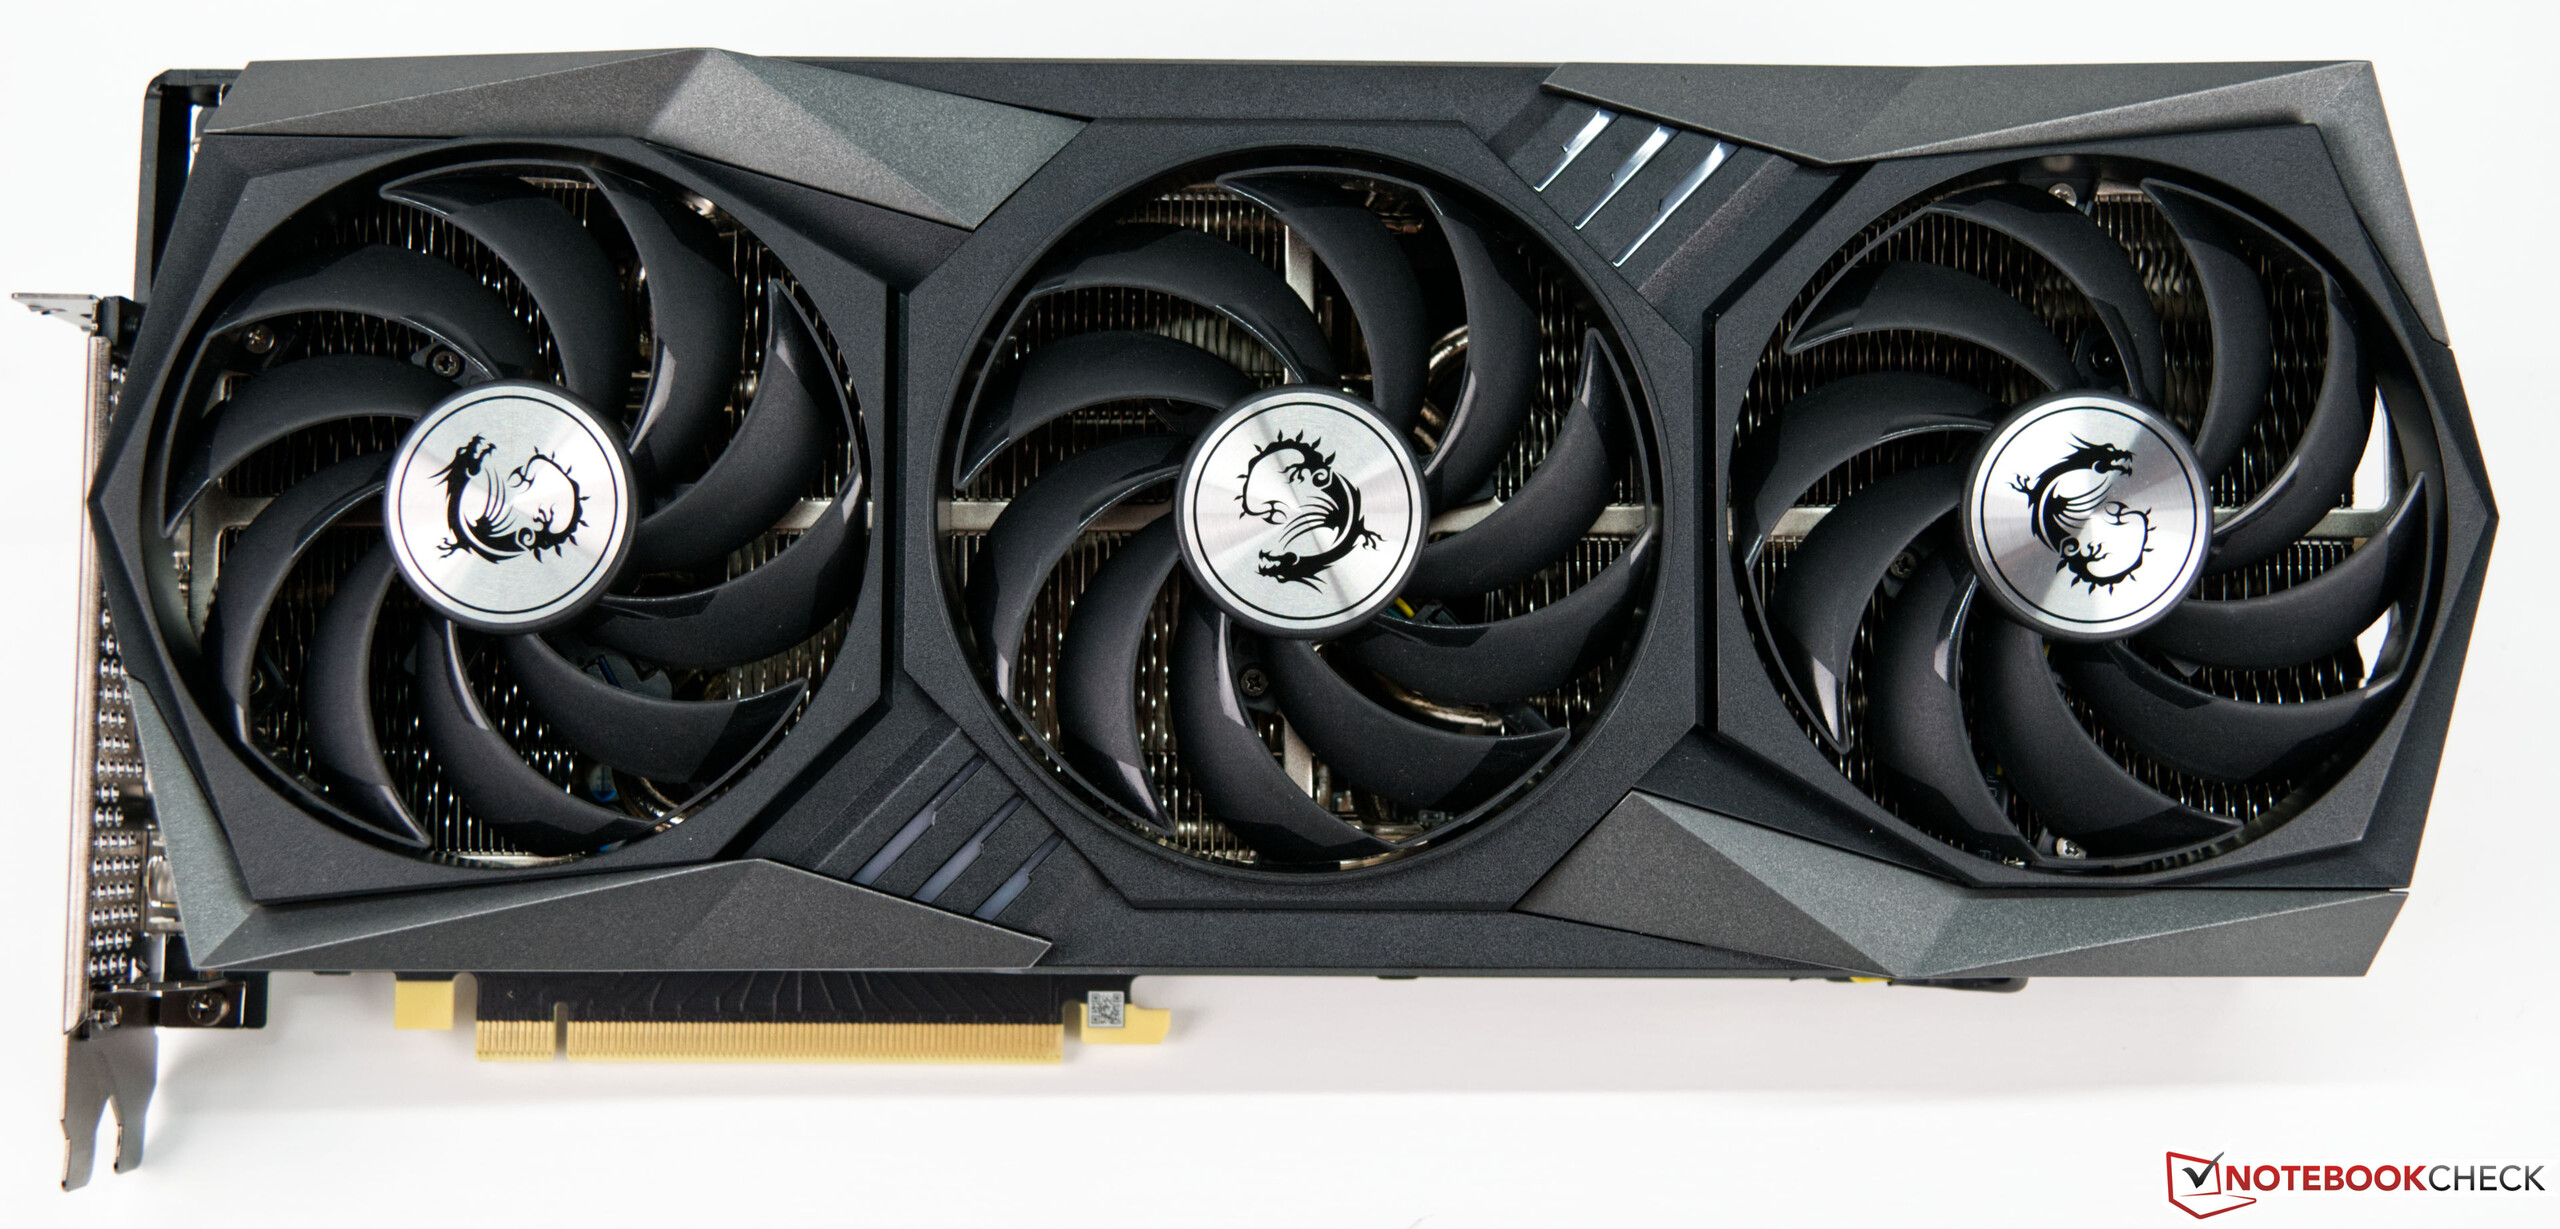
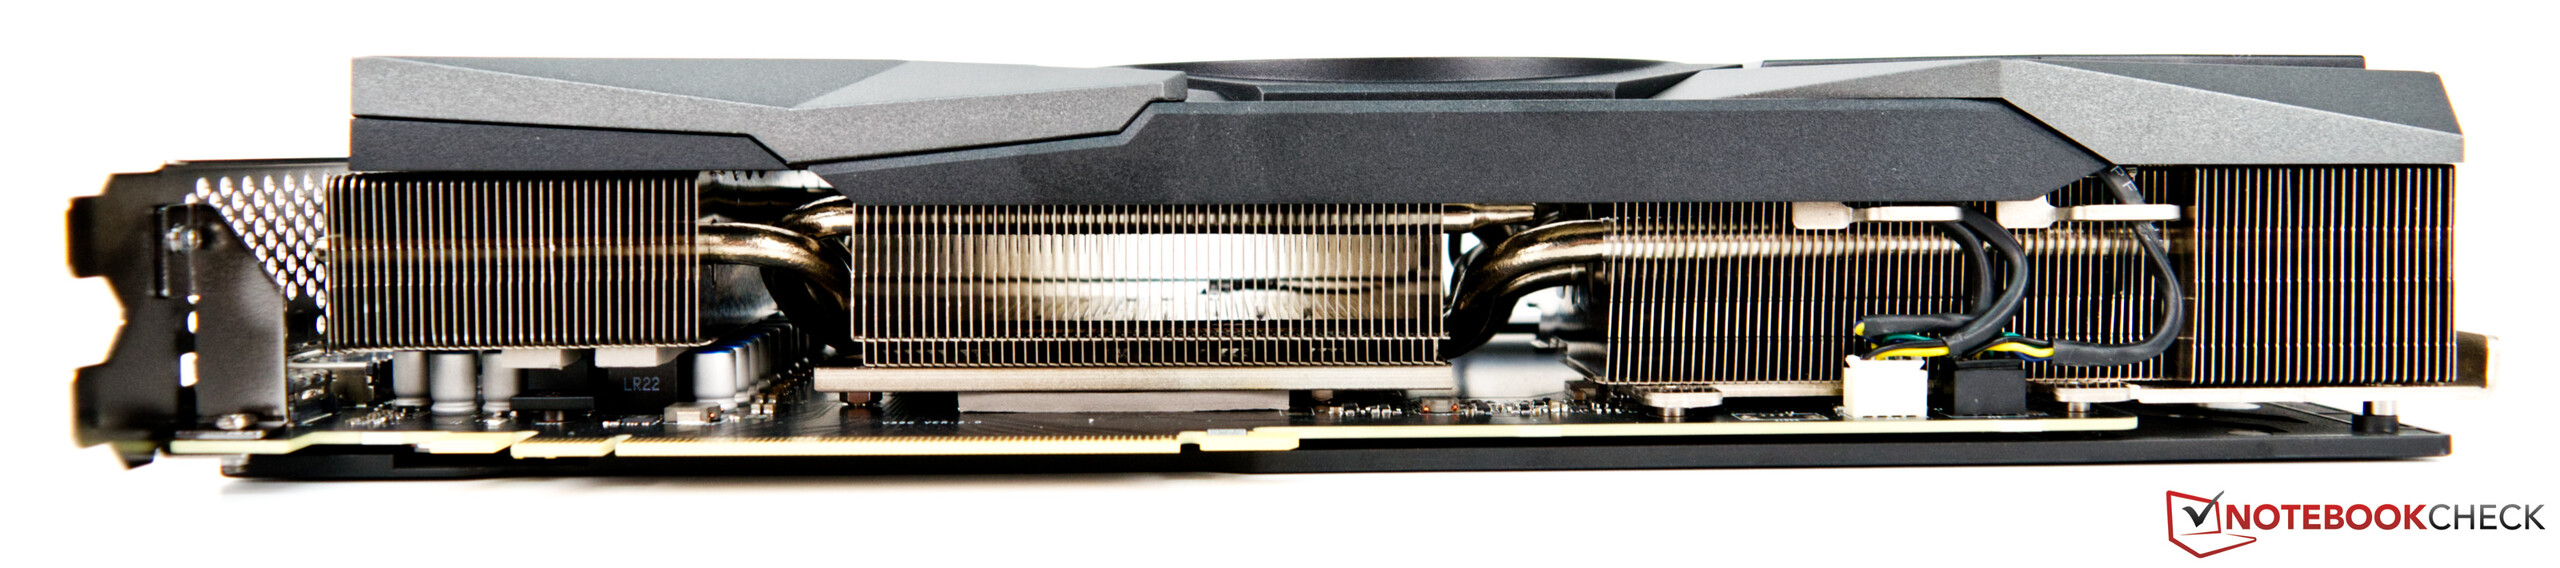
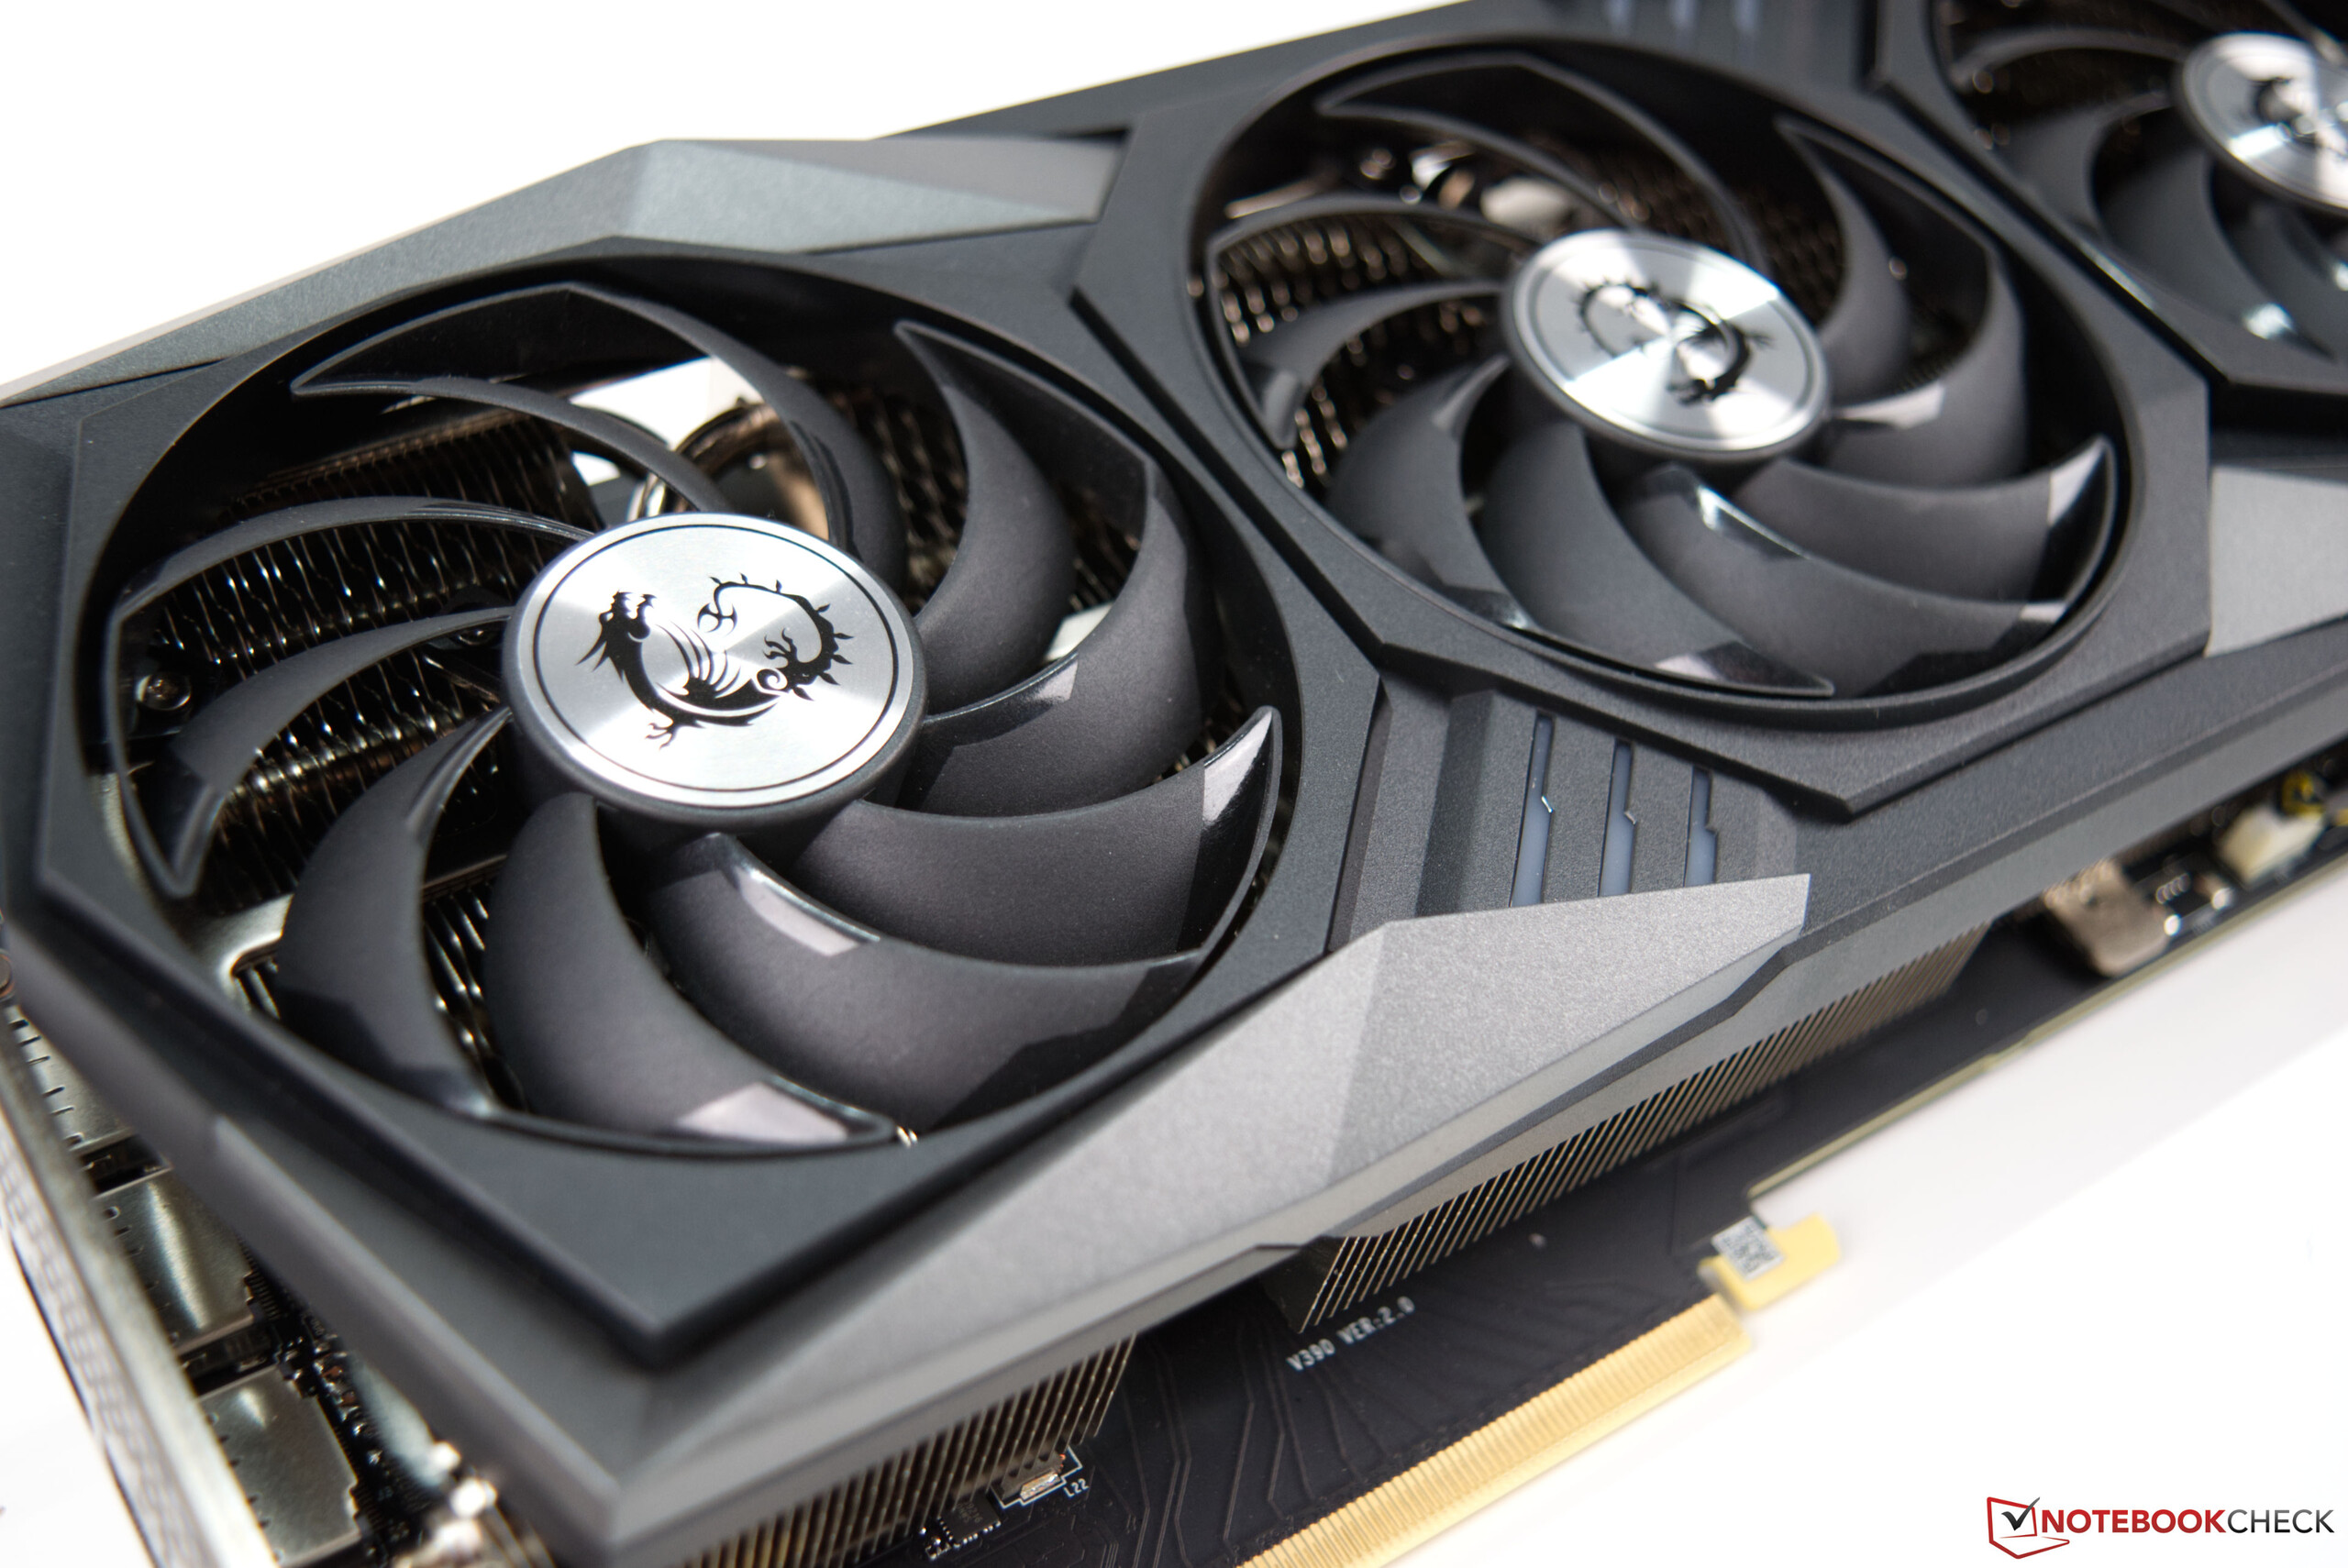
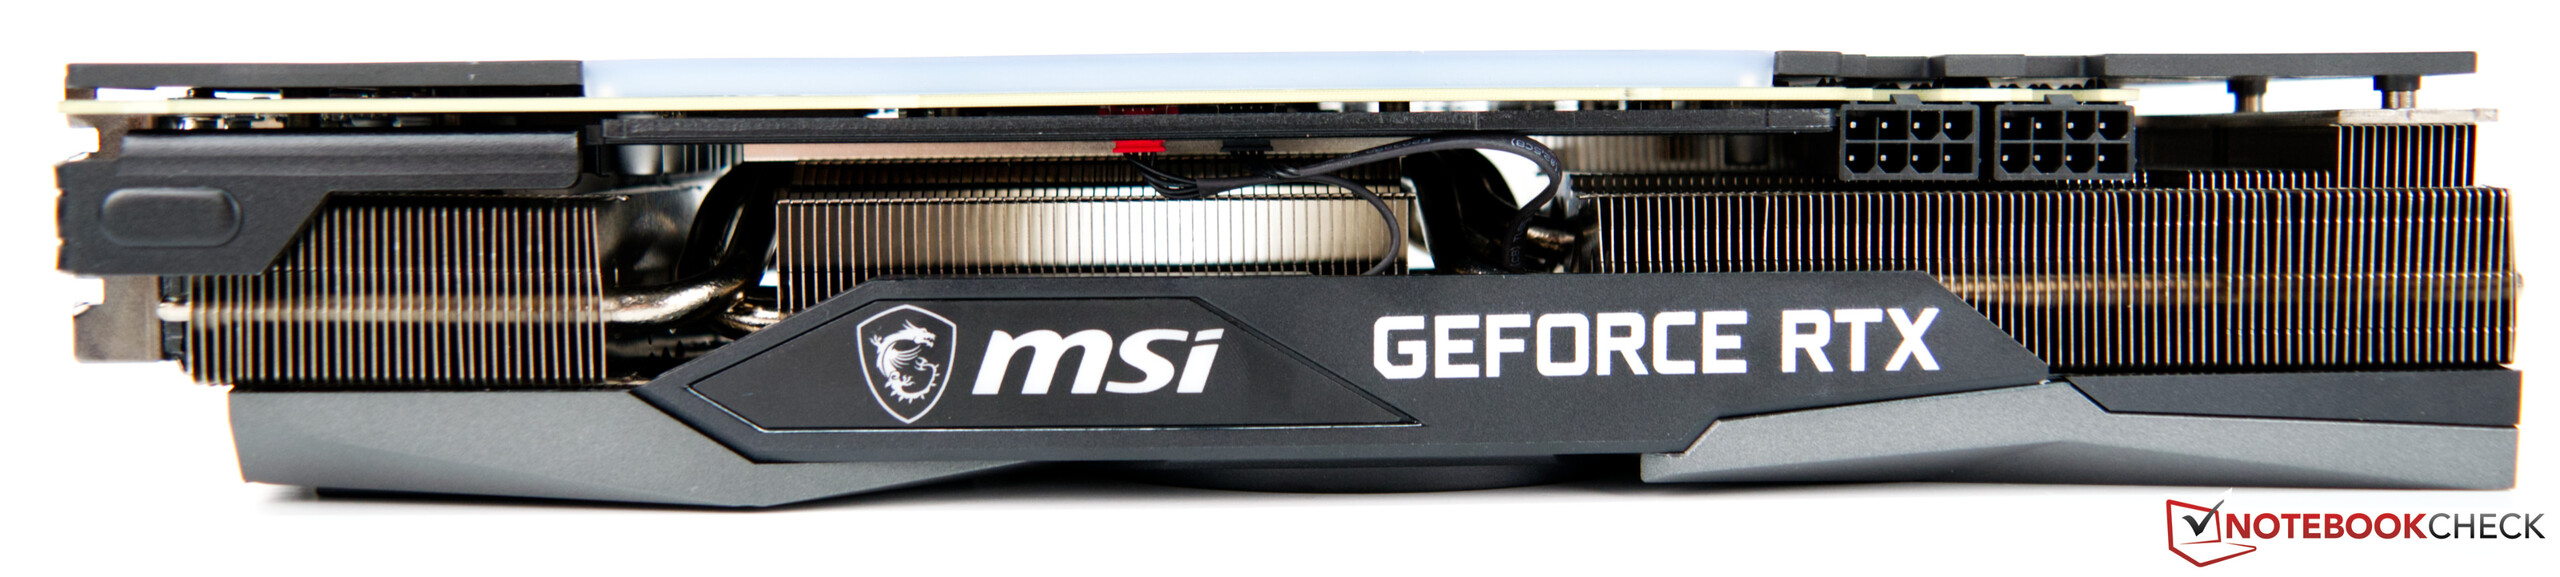
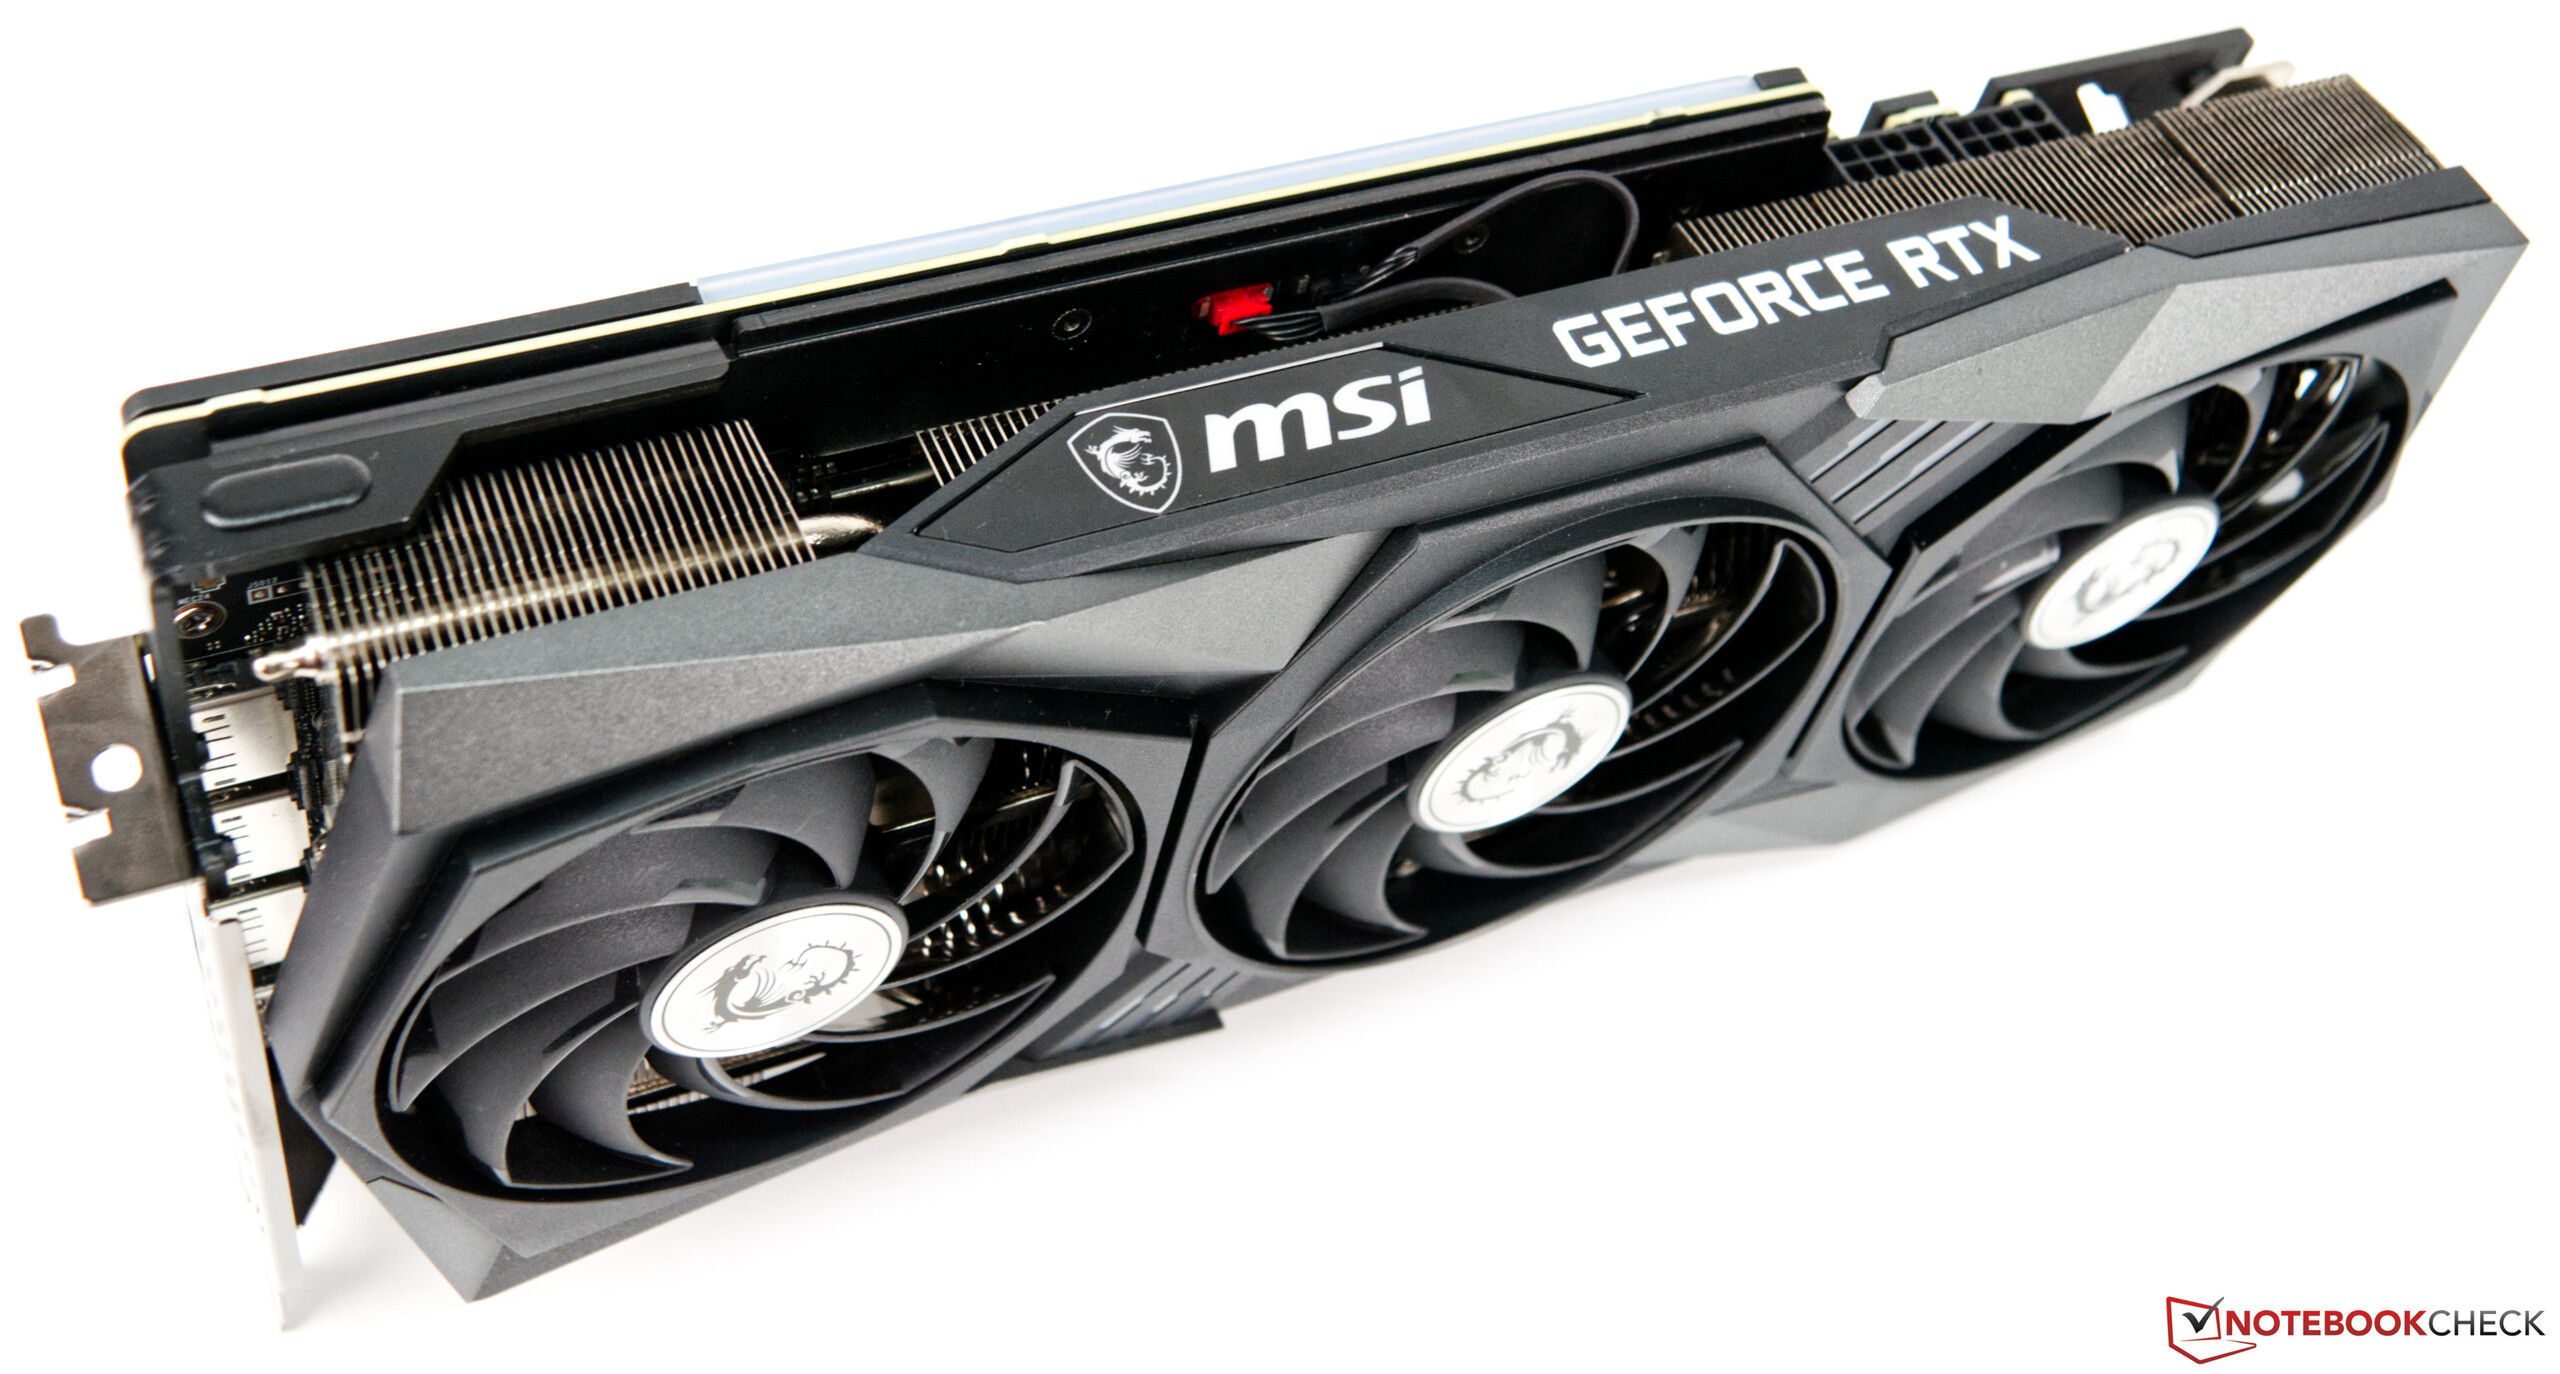
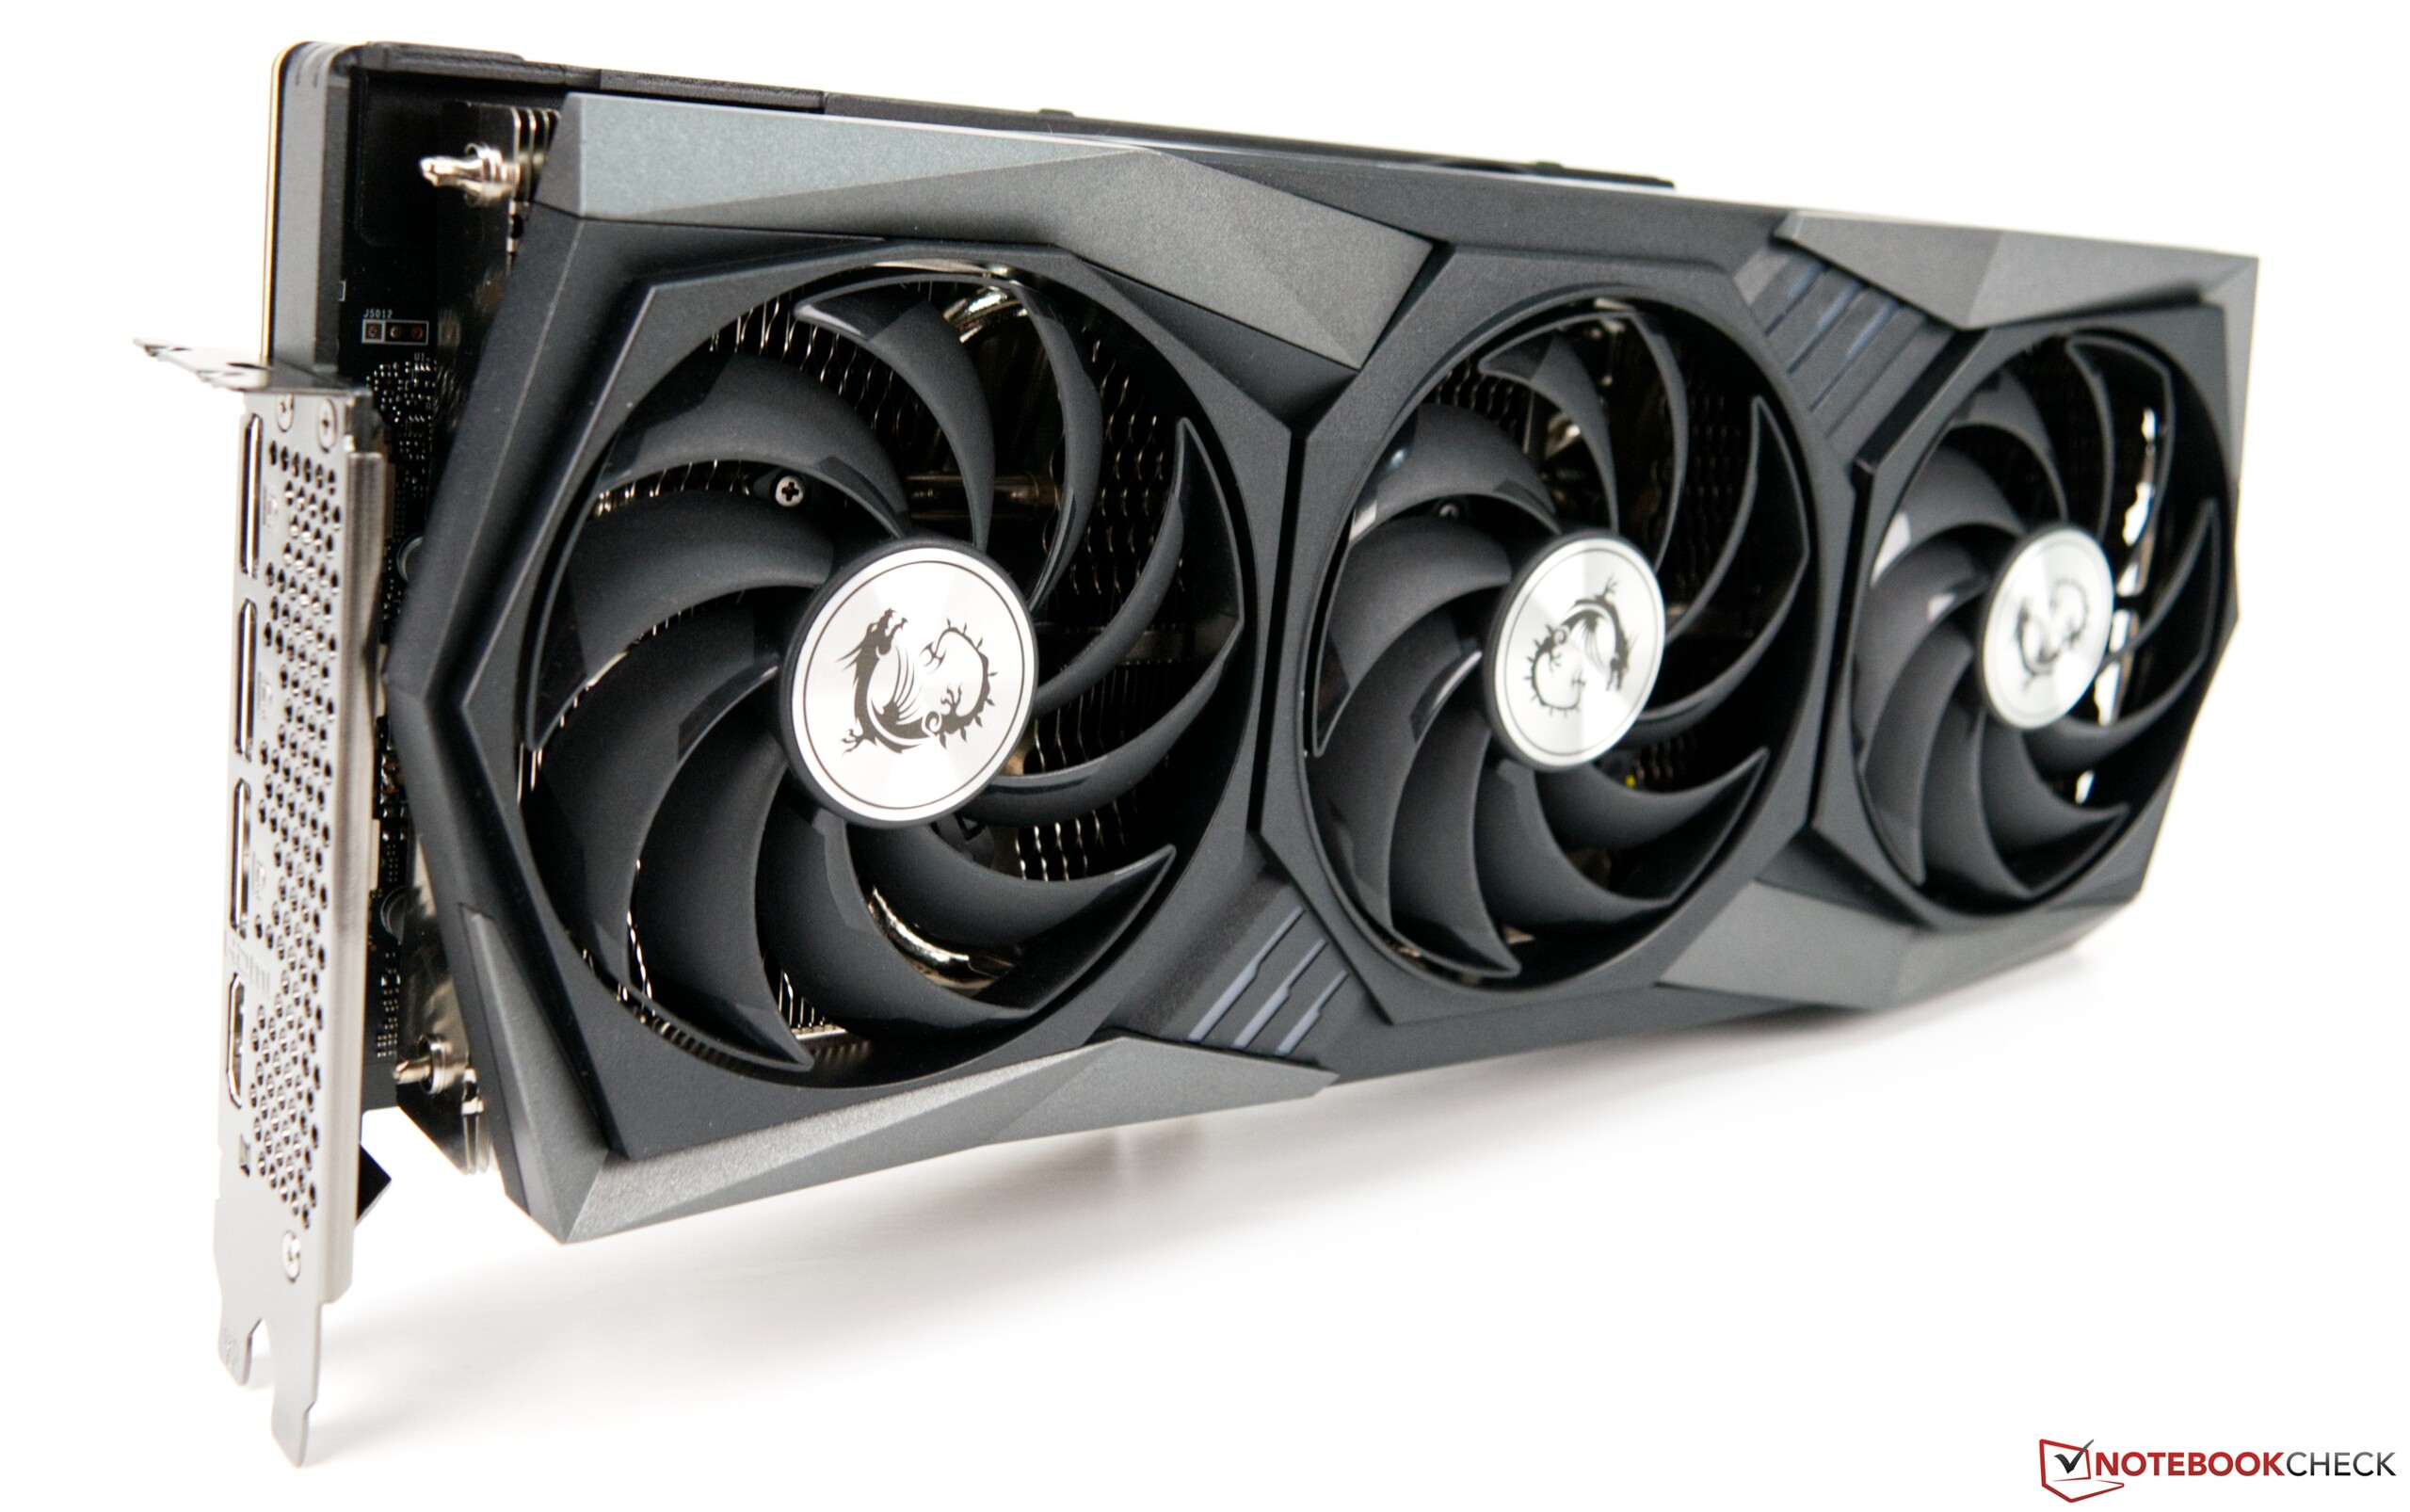
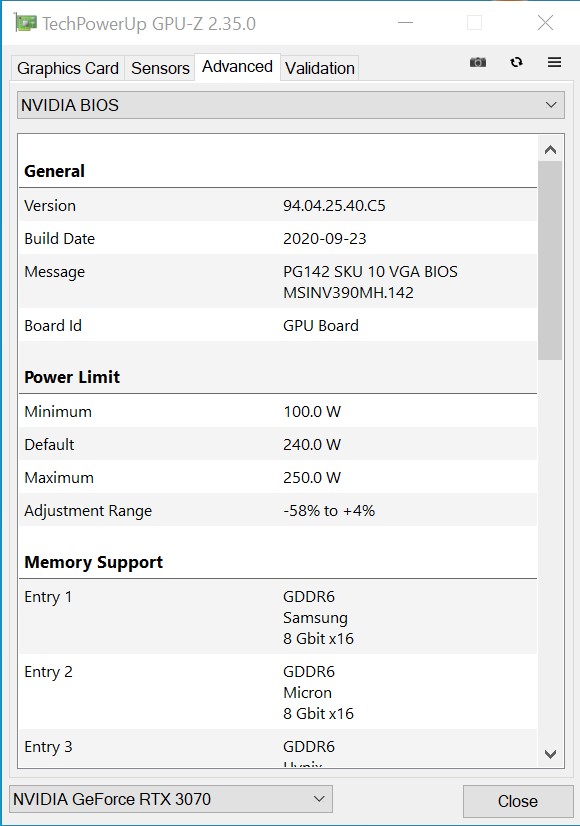
The MSI GeForce RTX 3070 Gaming X Trio is undoubtedly a very fast and excellently crafted graphics card. In addition, it's delivered with a 240-watt BIOS out of the box. The Founders Edition, on the other hand, has to make do with 220 watts. The very good and massive heat sink, which is equipped with three axial fans, takes care of the heat developed. The heatsink never really turns up, even under load, as we can already reveal at this point.
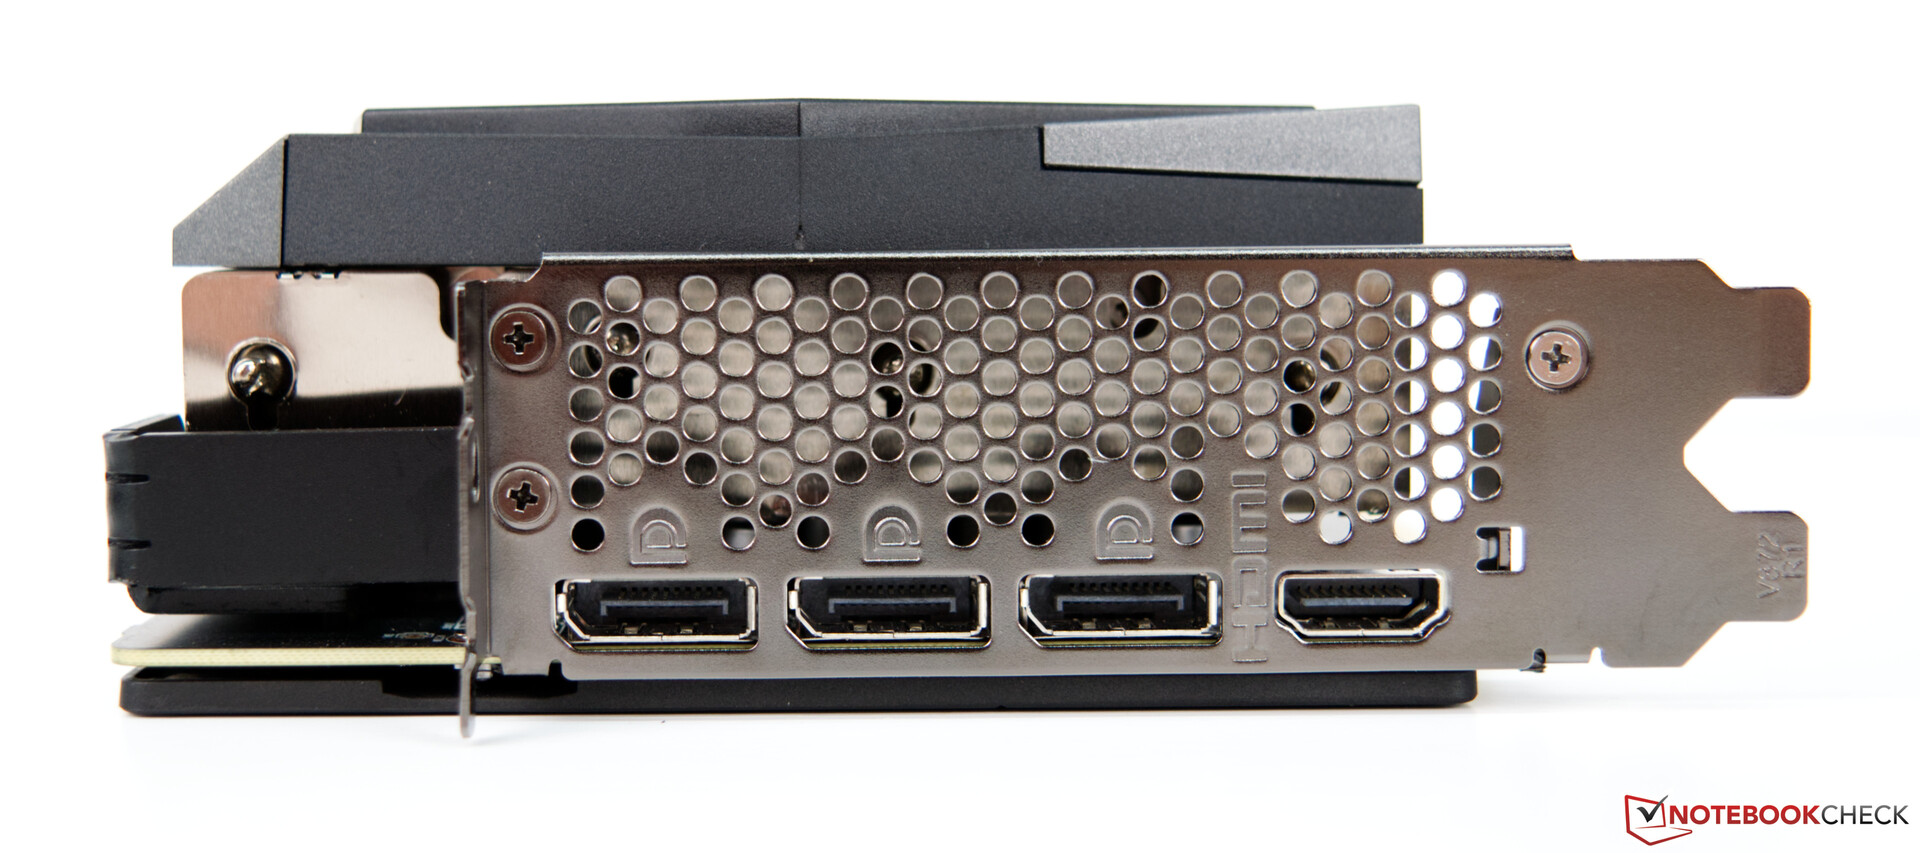
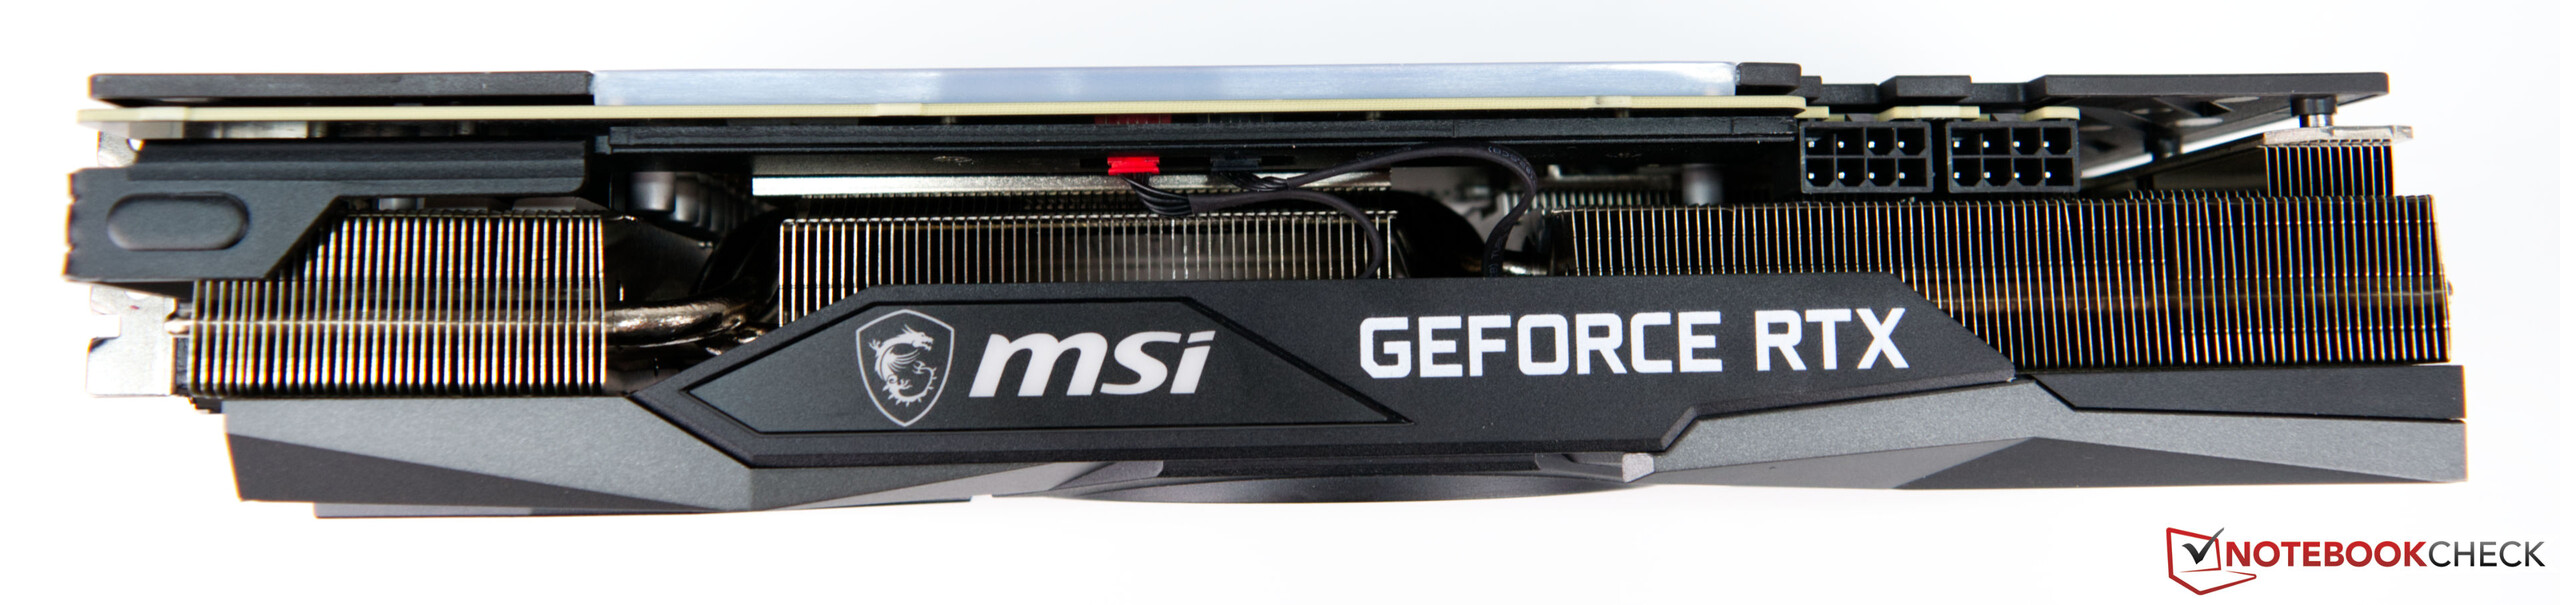
For the power supply, MSI does without the 12-pin connector that Nvidia uses with its Founders Edition cards and stays with the classic one. The GeForce RTX 3070 Gaming X Trio requires two 8-pin power connectors. Externally, up to four monitors can be operated simultaneously. For this, there is one HDMI output with the latest standard (2.1) and three DisplayPort connections (1.4a).

Comparison of the RTX 3070 with other NVIDIA GPUs
| Specification | RTX 3090 | RTX 3080 FE | MSI RTX 3070 | RTX 3070 FE | Titan RTX | TITAN X Pascal | RTX 2080 Ti | RTX 2080 | RTX 2070 S |
| Chip | GA102 | GA102 | GA104 | GA104 | TU102 | GP102 | TU102 | TU104 | TU104 |
| FinFET process | 8 nm | 8 nm | 8 nm | 8 nm | 12 nm | 16 nm | 12 nm | 12 nm | 12 nm |
| CUDA cores | 10,496 | 8,704 | 5,888 | 5,888 | 4,608 | 3,584 | 4,352 | 2,944 | 2,560 |
| Texture units | 328 | 272 | 184 | 184 | 288 | 224 | 272 | 184 | 160 |
| Tensor cores | 328 3rd Gen. | 272 3rd Gen. | 184 3rd Gen. | 184 3rd Gen. | 576 2nd Gen. | - | 544 2nd Gen. | 368 2nd Gen. | 320 2nd Gen. |
| RT cores | 82 | 68 | 46 | 46 | 72 | - | 68 | 46 | 40 |
| GPU base clock | 1,395 MHz | 1,440 MHz | 1,500 MHz | 1,500 MHz | 1,350 MHz | 1,417 MHz | 1,350 MHz | 1,515 MHz | 1,605 MHz |
| GPU boost clock | 1,695 MHz | 1,710 MHz | 1,830 MHz | 1,750 MHz | 1,770 MHz | 1,531 MHz | 1,545 MHz | 1,710 MHz | 1,770 MHz |
| Memory bus | 384-bit | 320-bit | 256-bit | 256-bit | 384-bit | 384-bit | 352-bit | 256-bit | 256-bit |
| Memory bandwidth | 936 GB/s | 760 GB/s | 448 GB/s | 448 GB/s | 672 GB/s | 480.4 GB/s | 616 GB/s | 448 GB/s | 448 GB/s |
| Video memory | 24 GB GDDR6X | 10 GB GDDR6X | 8 GB GDDR6 | 8 GB GDDR6 | 24 GB GDDR6 | 12 GB GDDR5X | 11 GB GDDR6 | 8 GB GDDR6 | 8 GB GDDR6 |
| Power consumption | 350 W | 320 W | 240 W | 220 W | 280 W | 250 W | 250 W | 215 W | 215 W |
Our test system with the AMD Ryzen 9 3900X as base
A current AMD platform based on the Asus X570 ROG Crosshair VIII serves as our test system. The CPU (AMD Ryzen 9 5900X) offers good CPU performance, and we used an AIO (Alphacool Eisbaer 280 mm) as cooling. The 32 GB RAM is from Corsair and clocks at 4,000 MHz. We use the Acer Predator XB321HK as monitor. This doesn't limit us thanks to its UHD suitability. At this point, we would like to thank AMD for providing the test platform and Corsair for the RAM kit.
For the subsequent benchmarks and tests, we use the following system:
- Corsair Carbide Air 540 ATX Cube
- AMD Ryzen 9 5900X
- MSI GeForce RTX 3070 Gaming X Trio (Nvidia driver 457.30)
- Asus X570 ROG Crosshair VIII Hero Wi-Fi (BIOS 2402, default settings, XMP 1 - DDR4 4000)
- Corsair RM1000X 1000-watt power supply unit
- Corsair Vengeance RGB Pro DDR4 4000 2x 16 GB memory kit
- Corsair MP600 2 TB M.2 PCIe 4.0 SSD
- Crucial MX500 2 TB (for games)
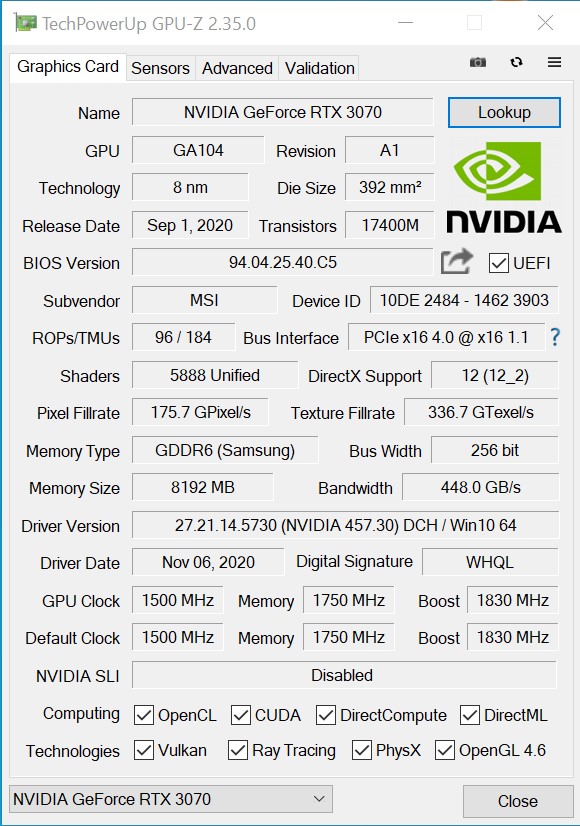
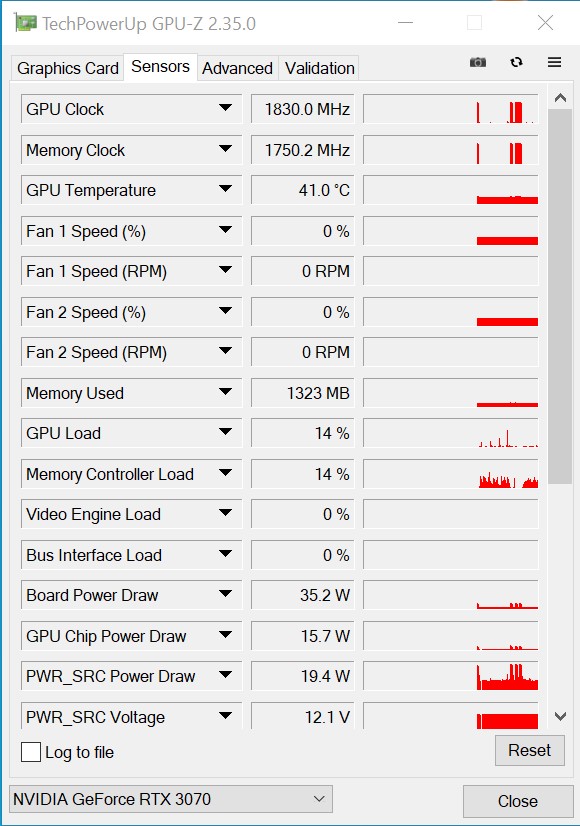
The clock speeds of the MSI GeForce RTX 3070 Gaming X Trio
Compared to the reference model, MSI hasn't touched the base clock speed, which also applies to the operating speed of the VRAM. Only the maximum turbo clock rate is somewhat higher at 1,830 MHz (+6%). In return, the GeForce RTX 3070 Gaming X Trio can also use 20 watts more energy. But this will probably not be of complete benefit for the graphics chip, because the additional fan and the RGB spectacle also require power.
In general, however, the boost speed is almost always surpassed during gaming, which is due to the very good cooling solution. Even under load, it ensures temperatures well below the temperature limit.
Synthetic benchmarks
For a first performance comparison, let's take a look at the results of the synthetic benchmarks. Here, the MSI GeForce RTX 3070 Gaming X Trio is about as fast as a GeForce RTX 2080 Ti. The performance of the Nvidia Titan RTX can't be achieved, but it's almost within reach. Compared to the GeForce RTX 2070 Super, our test sample can clearly set itself apart from the Turing model by about 40%. The GeForce RTX 3070 only needs about 10% more energy to achieve this.
| Unigine Superposition | |
| 1280x720 720p Low | |
| NVIDIA Titan RTX | |
| MSI GeForce RTX 3070 Gaming X Trio | |
| NVIDIA GeForce RTX 3080 | |
| 1920x1080 1080p High | |
| NVIDIA GeForce RTX 3090 | |
| NVIDIA GeForce RTX 3080 | |
| NVIDIA Titan RTX | |
| MSI GeForce RTX 3070 Gaming X Trio | |
| 1920x1080 1080p Extreme | |
| NVIDIA GeForce RTX 3090 | |
| NVIDIA GeForce RTX 3080 | |
| NVIDIA Titan RTX | |
| MSI GeForce RTX 3070 Gaming X Trio | |
| 3840x2160 4k Optimized | |
| NVIDIA GeForce RTX 3090 | |
| NVIDIA GeForce RTX 3080 | |
| NVIDIA Titan RTX | |
| MSI GeForce RTX 3070 Gaming X Trio | |
| 7680x4320 8k Optimized | |
| NVIDIA GeForce RTX 3090 | |
| NVIDIA GeForce RTX 3080 | |
| NVIDIA Titan RTX | |
| MSI GeForce RTX 3070 Gaming X Trio | |
| 3DMark 05 Standard | 51451 points | |
| 3DMark 06 Standard Score | 42108 points | |
| 3DMark Vantage P Result | 85505 points | |
| 3DMark 11 Performance | 28358 points | |
| 3DMark Ice Storm Standard Score | 201360 points | |
| 3DMark Cloud Gate Standard Score | 59414 points | |
| 3DMark Fire Strike Score | 26306 points | |
| 3DMark Fire Strike Extreme Score | 15681 points | |
| 3DMark Time Spy Score | 12889 points | |
Help | ||
Game benchmarks
We have tested the MSI GeForce RTX 3070 Gaming X Trio with a variety of games and can confirm that the graphics card has a very good gaming performance in Full HD and WQHD gaming. However, the GeForce RTX 3070 also masters many games in 4K, although some games only reach 40 FPS. Even in this resolution, though, games that aren't so hardware-hungry are no problem for the MSI GeForce RTX 3070 Gaming X Trio.
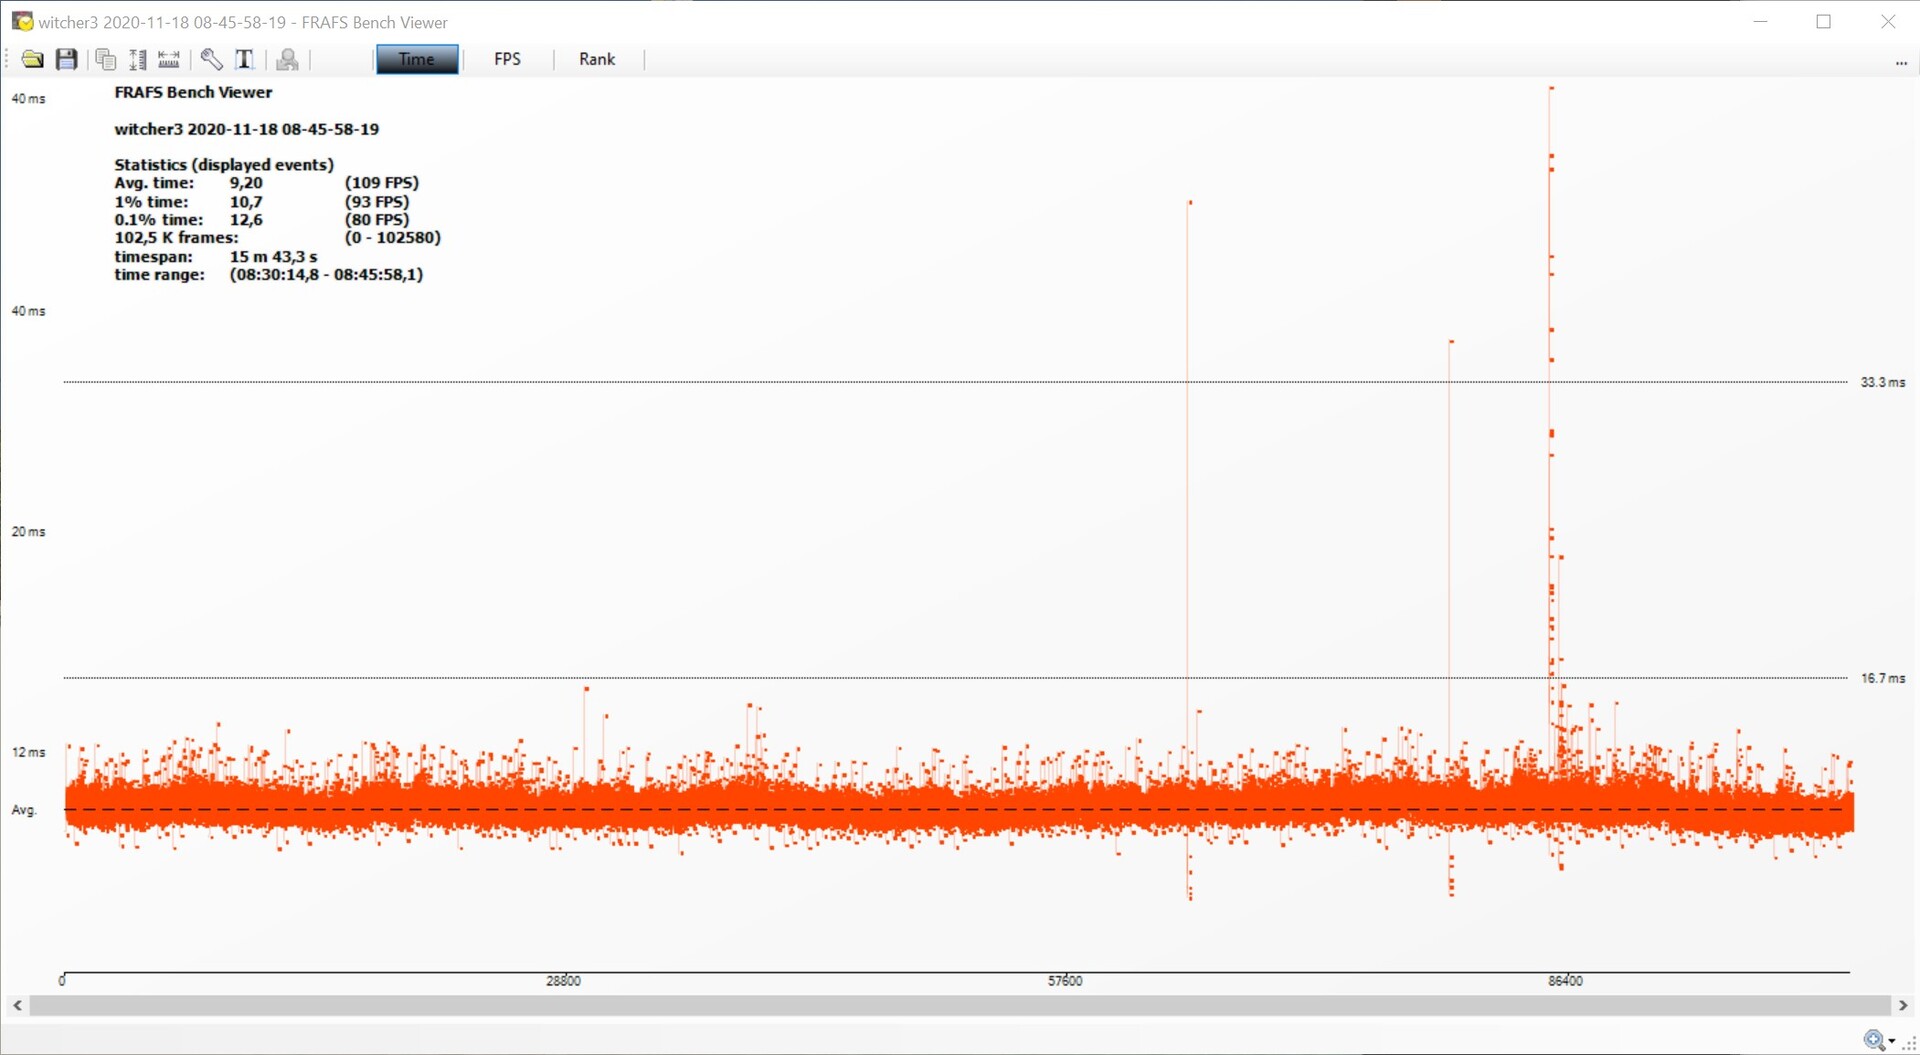
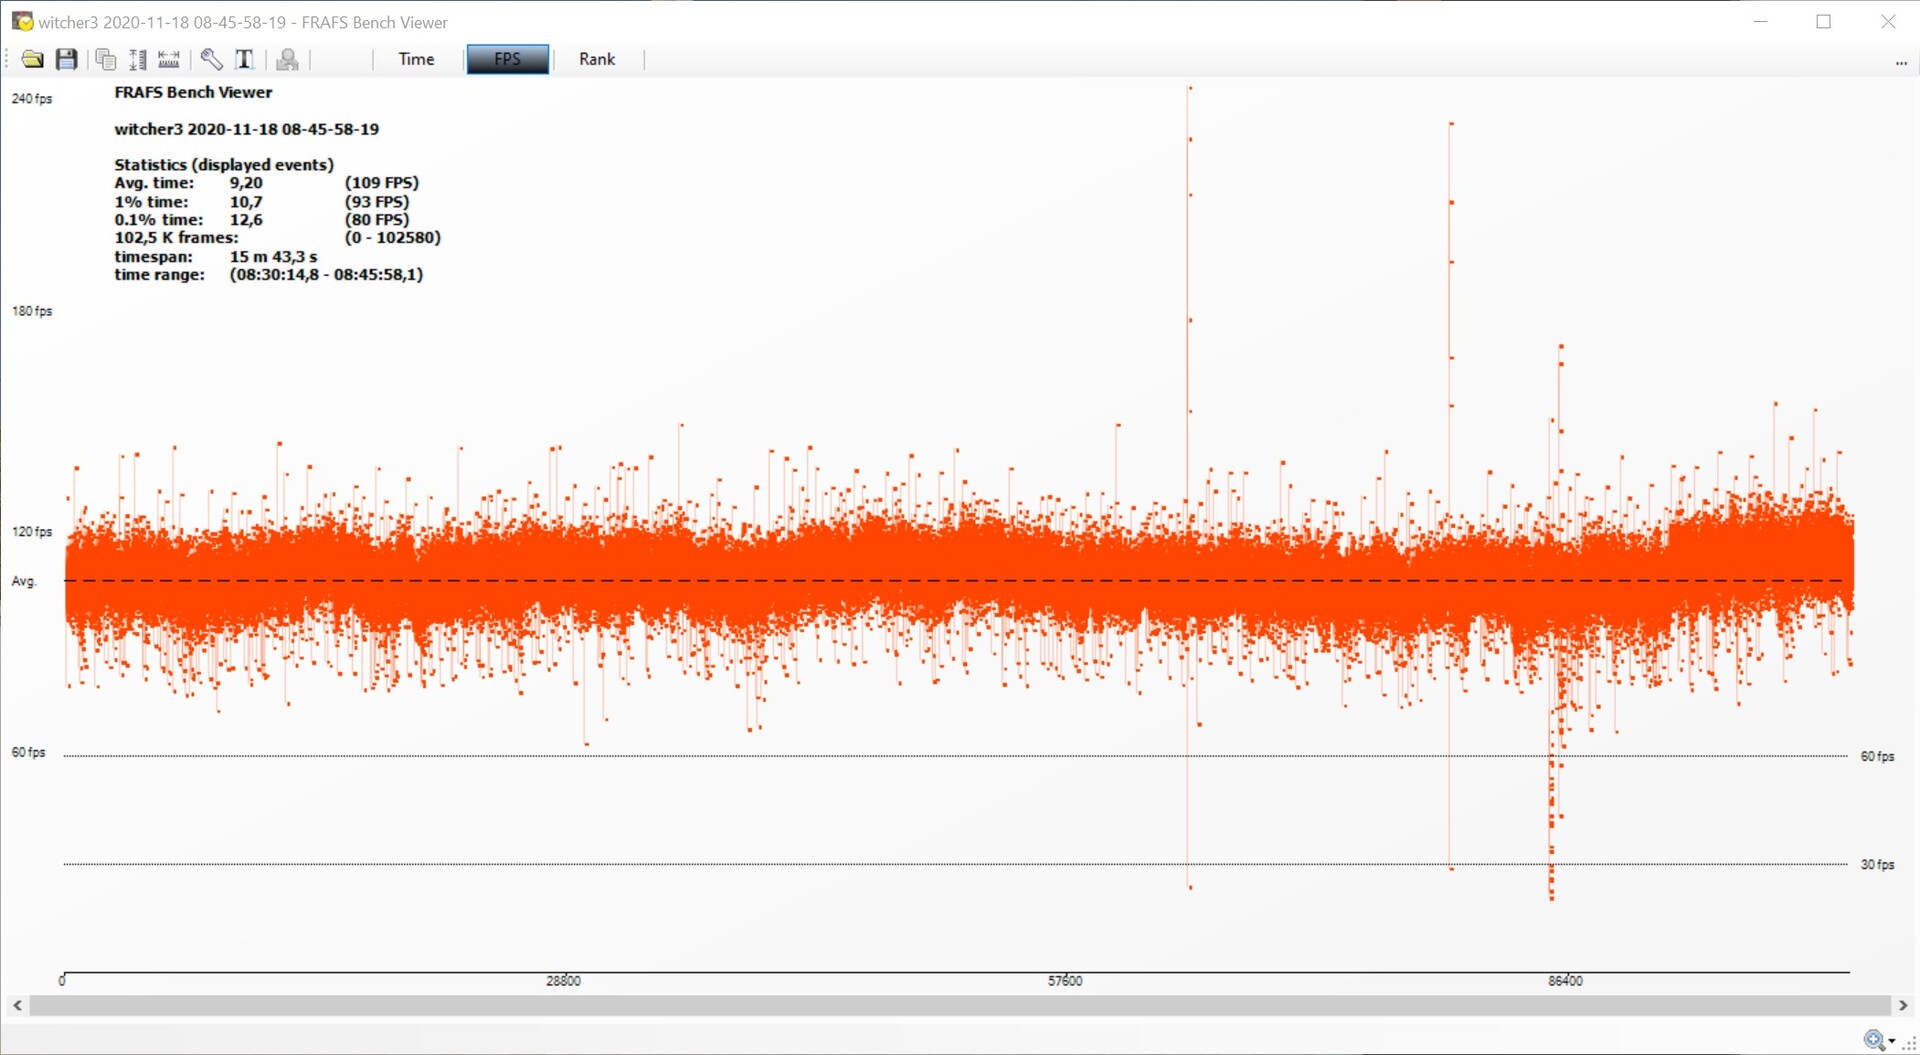
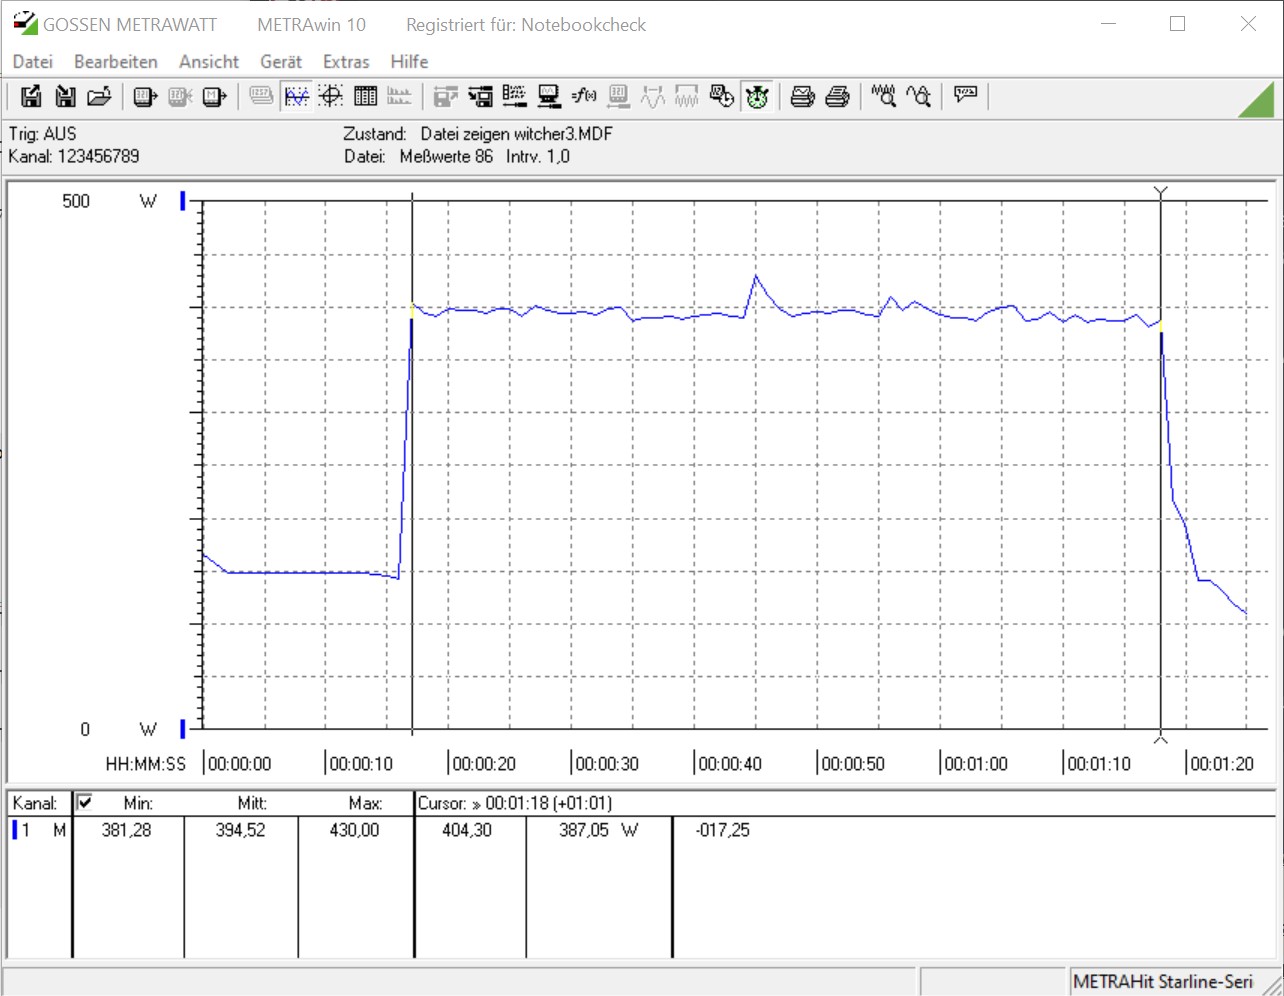
If you mostly play in 1080p or 1440p, you will be completely satisfied with the performance of the MSI GeForce RTX 3070 Gaming X Trio. The 8 GB of VRAM might look a bit limited at first glance. Nevertheless, this is sufficient for modern games. With the frame times and the frame progression that we registered with the game The Witcher 3 (Ultra preset), some higher latencies only show up every now and then, but they don't affect the gaming experience in a noticeable way. The frame progression is also constant in the long run, which again points to the good cooling unit.
Our GeForce RTX 3070 from MSI just barely loses against the GeForce RTX 2080 Ti in this comparison. The performance difference to the faster GeForce RTX 3080 is about 25 to 30% in high resolutions (2160p).
The Witcher 3 frame progression Ultra preset
| F1 2020 - 3840x2160 Ultra High Preset AA:T AF:16x | |
| NVIDIA GeForce RTX 3090 | |
| NVIDIA GeForce RTX 3080 | |
| NVIDIA Titan RTX | |
| MSI GeForce RTX 3070 Gaming X Trio | |
| Borderlands 3 - 3840x2160 Badass Overall Quality (DX11) | |
| NVIDIA GeForce RTX 3090 | |
| NVIDIA GeForce RTX 3080 | |
| NVIDIA Titan RTX | |
| NVIDIA Titan RTX | |
| MSI GeForce RTX 3070 Gaming X Trio | |
| GeForce RTX 2080 Ti (Desktop) | |
| Red Dead Redemption 2 - 3840x2160 Maximum Settings | |
| NVIDIA GeForce RTX 3090 | |
| NVIDIA GeForce RTX 3080 | |
| MSI GeForce RTX 3070 Gaming X Trio | |
| NVIDIA Titan RTX | |
| Rise of the Tomb Raider - 3840x2160 High Preset AA:FX AF:4x | |
| NVIDIA GeForce RTX 3080 | |
| GeForce RTX 2080 Ti (Desktop) | |
| MSI GeForce RTX 3070 Gaming X Trio | |
| GeForce RTX 2080 Super (Desktop) | |
| GeForce RTX 2080 (Desktop) | |
| GeForce RTX 2070 Super (Desktop) | |
| GeForce RTX 2070 (Desktop) | |
| Radeon VII | |
| GeForce RTX 2060 Super (Desktop) | |
| RX Vega 64 | |
| GeForce RTX 2060 (Desktop) | |
| The Witcher 3 - 3840x2160 High Graphics & Postprocessing (Nvidia HairWorks Off) | |
| NVIDIA GeForce RTX 3080 | |
| NVIDIA Titan RTX | |
| NVIDIA Titan RTX | |
| GeForce RTX 2080 Ti (Desktop) | |
| MSI GeForce RTX 3070 Gaming X Trio | |
| GeForce RTX 2080 Super (Desktop) | |
| GeForce RTX 2080 (Desktop) | |
| GeForce RTX 2070 Super (Desktop) | |
| GeForce RTX 2070 (Desktop) | |
| GeForce RTX 2060 Super (Desktop) | |
| Radeon VII | |
| Radeon RX 5700 XT (Desktop) | |
| GeForce RTX 2060 (Desktop) | |
| RX Vega 64 | |
| Radeon RX 5700 (Desktop) | |
| low | med. | high | ultra | QHD | 4K | |
| GTA V (2015) | 182 | 172 | 157 | 91.1 | 86.5 | 112 |
| The Witcher 3 (2015) | 451 | 350 | 224 | 122 | 88.2 | |
| Dota 2 Reborn (2015) | 162.9 | 140.5 | 137.6 | 128.6 | 123.4 | |
| Rise of the Tomb Raider (2016) | 336 | 252 | 197 | 169 | 83.8 | |
| Final Fantasy XV Benchmark (2018) | 190 | 148 | 115 | 93.9 | 56.9 | |
| X-Plane 11.11 (2018) | 143 | 117 | 95.4 | 81.1 | ||
| Far Cry 5 (2018) | 159 | 139 | 133 | 127 | 113 | 69 |
| Strange Brigade (2018) | 439 | 311 | 256 | 223 | 166 | 97.6 |
| Shadow of the Tomb Raider (2018) | 155 | 143 | 143 | 138 | 108 | 61 |
| Battlefield V (2018) | 177.5 | 144.3 | 125.8 | 113.6 | 98.8 | 69 |
| Apex Legends (2019) | 144 | 144 | 144 | 144 | 144 | 107 |
| Far Cry New Dawn (2019) | 131 | 112 | 112 | 97 | 94 | 70 |
| Metro Exodus (2019) | 156 | 136 | 113 | 91.3 | 74.4 | 49.1 |
| The Division 2 (2019) | 220 | 173 | 142 | 112 | 82 | 49 |
| Anno 1800 (2019) | 115 | 112 | 82.7 | 46.5 | 46.2 | 34.3 |
| Rage 2 (2019) | 264 | 192 | 168 | 163 | 110 | 56.7 |
| Control (2019) | 238 | 147 | 122 | 82.5 | 42.3 | |
| Borderlands 3 (2019) | 142 | 129 | 111 | 95.8 | 75.9 | 44.2 |
| Star Wars Jedi Fallen Order (2019) | 106 | 106 | 104 | 102 | 67.6 | |
| Red Dead Redemption 2 (2019) | 168 | 156 | 119 | 78 | 65 | 44 |
| Hunt Showdown (2020) | 216 | 192 | 180 | 138 | 70.2 | |
| Doom Eternal (2020) | 246 | 246 | 244 | 237 | 208 | 116 |
| F1 2020 (2020) | 321 | 288 | 249 | 179 | 146 | 89.2 |
| Horizon Zero Dawn (2020) | 172 | 152 | 132 | 125 | 109 | 77 |
| Flight Simulator 2020 (2020) | 115 | 97.4 | 79.9 | 62.8 | 55.6 | 37.3 |
| Serious Sam 4 (2020) | 161.2 | 130.6 | 121.3 | 104.2 | 91.3 | 67.6 |
| Mafia Definitive Edition (2020) | 152 | 128 | 124 | 98.7 | 56.6 | |
| Star Wars Squadrons (2020) | 382 | 316 | 292 | 268 | 207 | 128 |
| FIFA 21 (2020) | 150 | 152 | 156 | 152 | 156 | 160 |
| Watch Dogs Legion (2020) | 100 | 100 | 88.9 | 79 | 65.7 | 37 |
| Dirt 5 (2020) | 169 | 119 | 102 | 86 | 74 | 52.9 |
| Assassin´s Creed Valhalla (2020) | 125 | 100 | 87 | 78 | 67 | 47 |
| Call of Duty Black Ops Cold War (2020) | 205 | 186 | 132 | 122 | 107 | 74 |
Compute performance
In LuxMark and ComputeMark, the MSI GeForce RTX 3070 Gaming X Trio competes again with the GeForce RTX 2080 Ti and can, therefore, also clearly outperform the GeForce RTX 2070 Super. However, the difference to the faster GeForce RTX 3080 is smaller here than in the pure gaming benchmarks. Compared to the workstation graphics cards, the GeForce cards lack the driver optimizations.
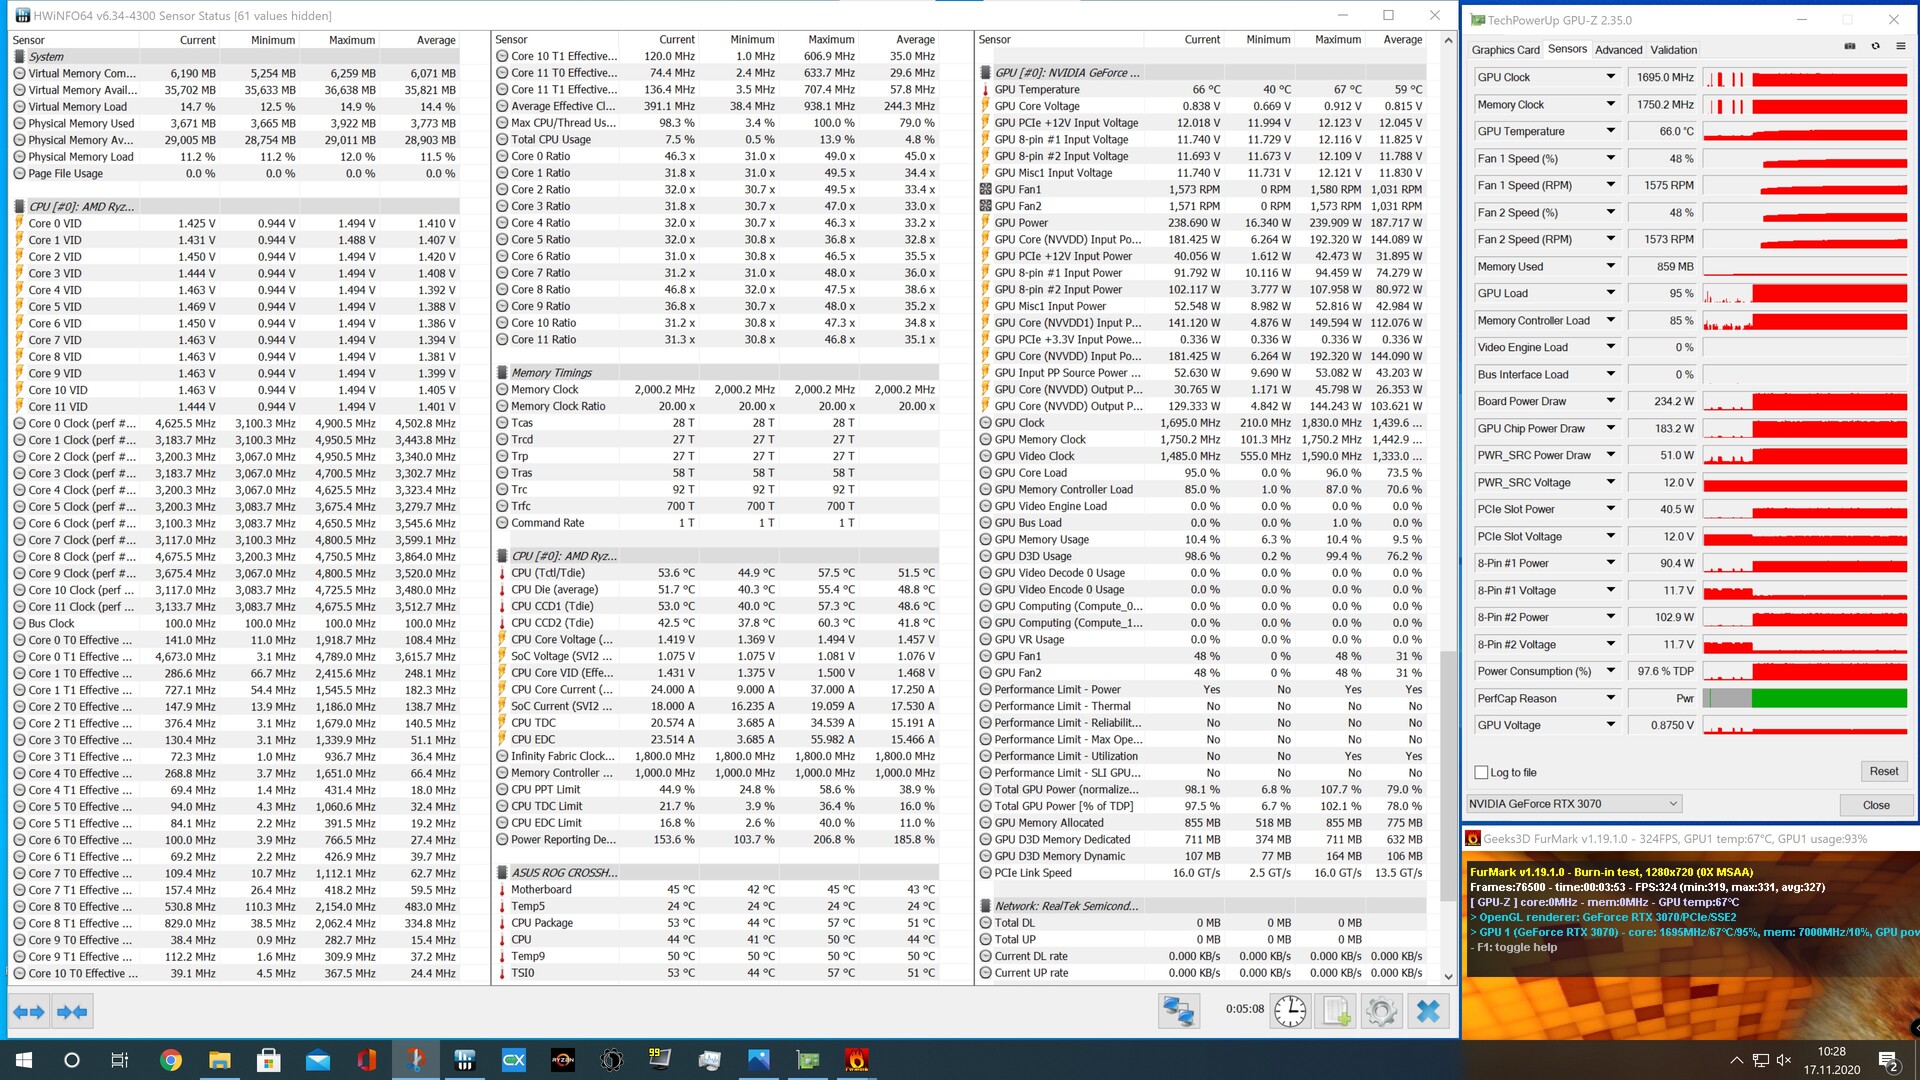
Emissions of the MSI GeForce RTX 3070 Gaming X Trio
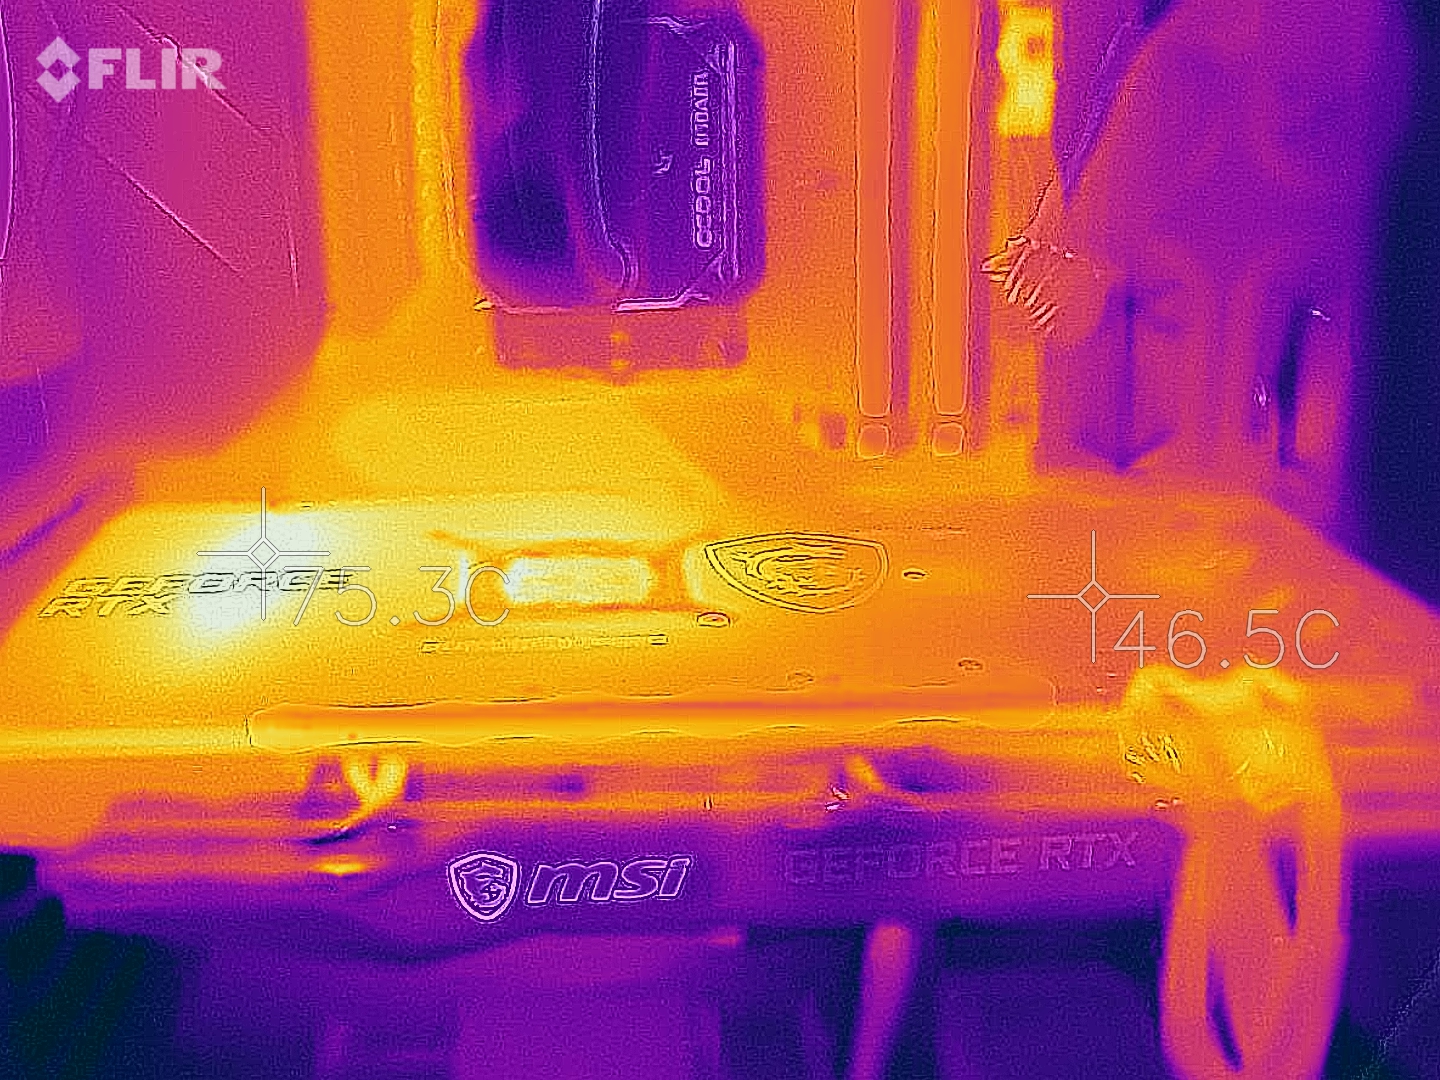
The MSI GeForce RTX 3070 Gaming X Trio gets a 240-watt BIOS, in which the graphics card also indulges under load. This is a bit less than on the equally fast GeForce RTX 2080 Ti but also a bit more than on the reference model from Nvidia.
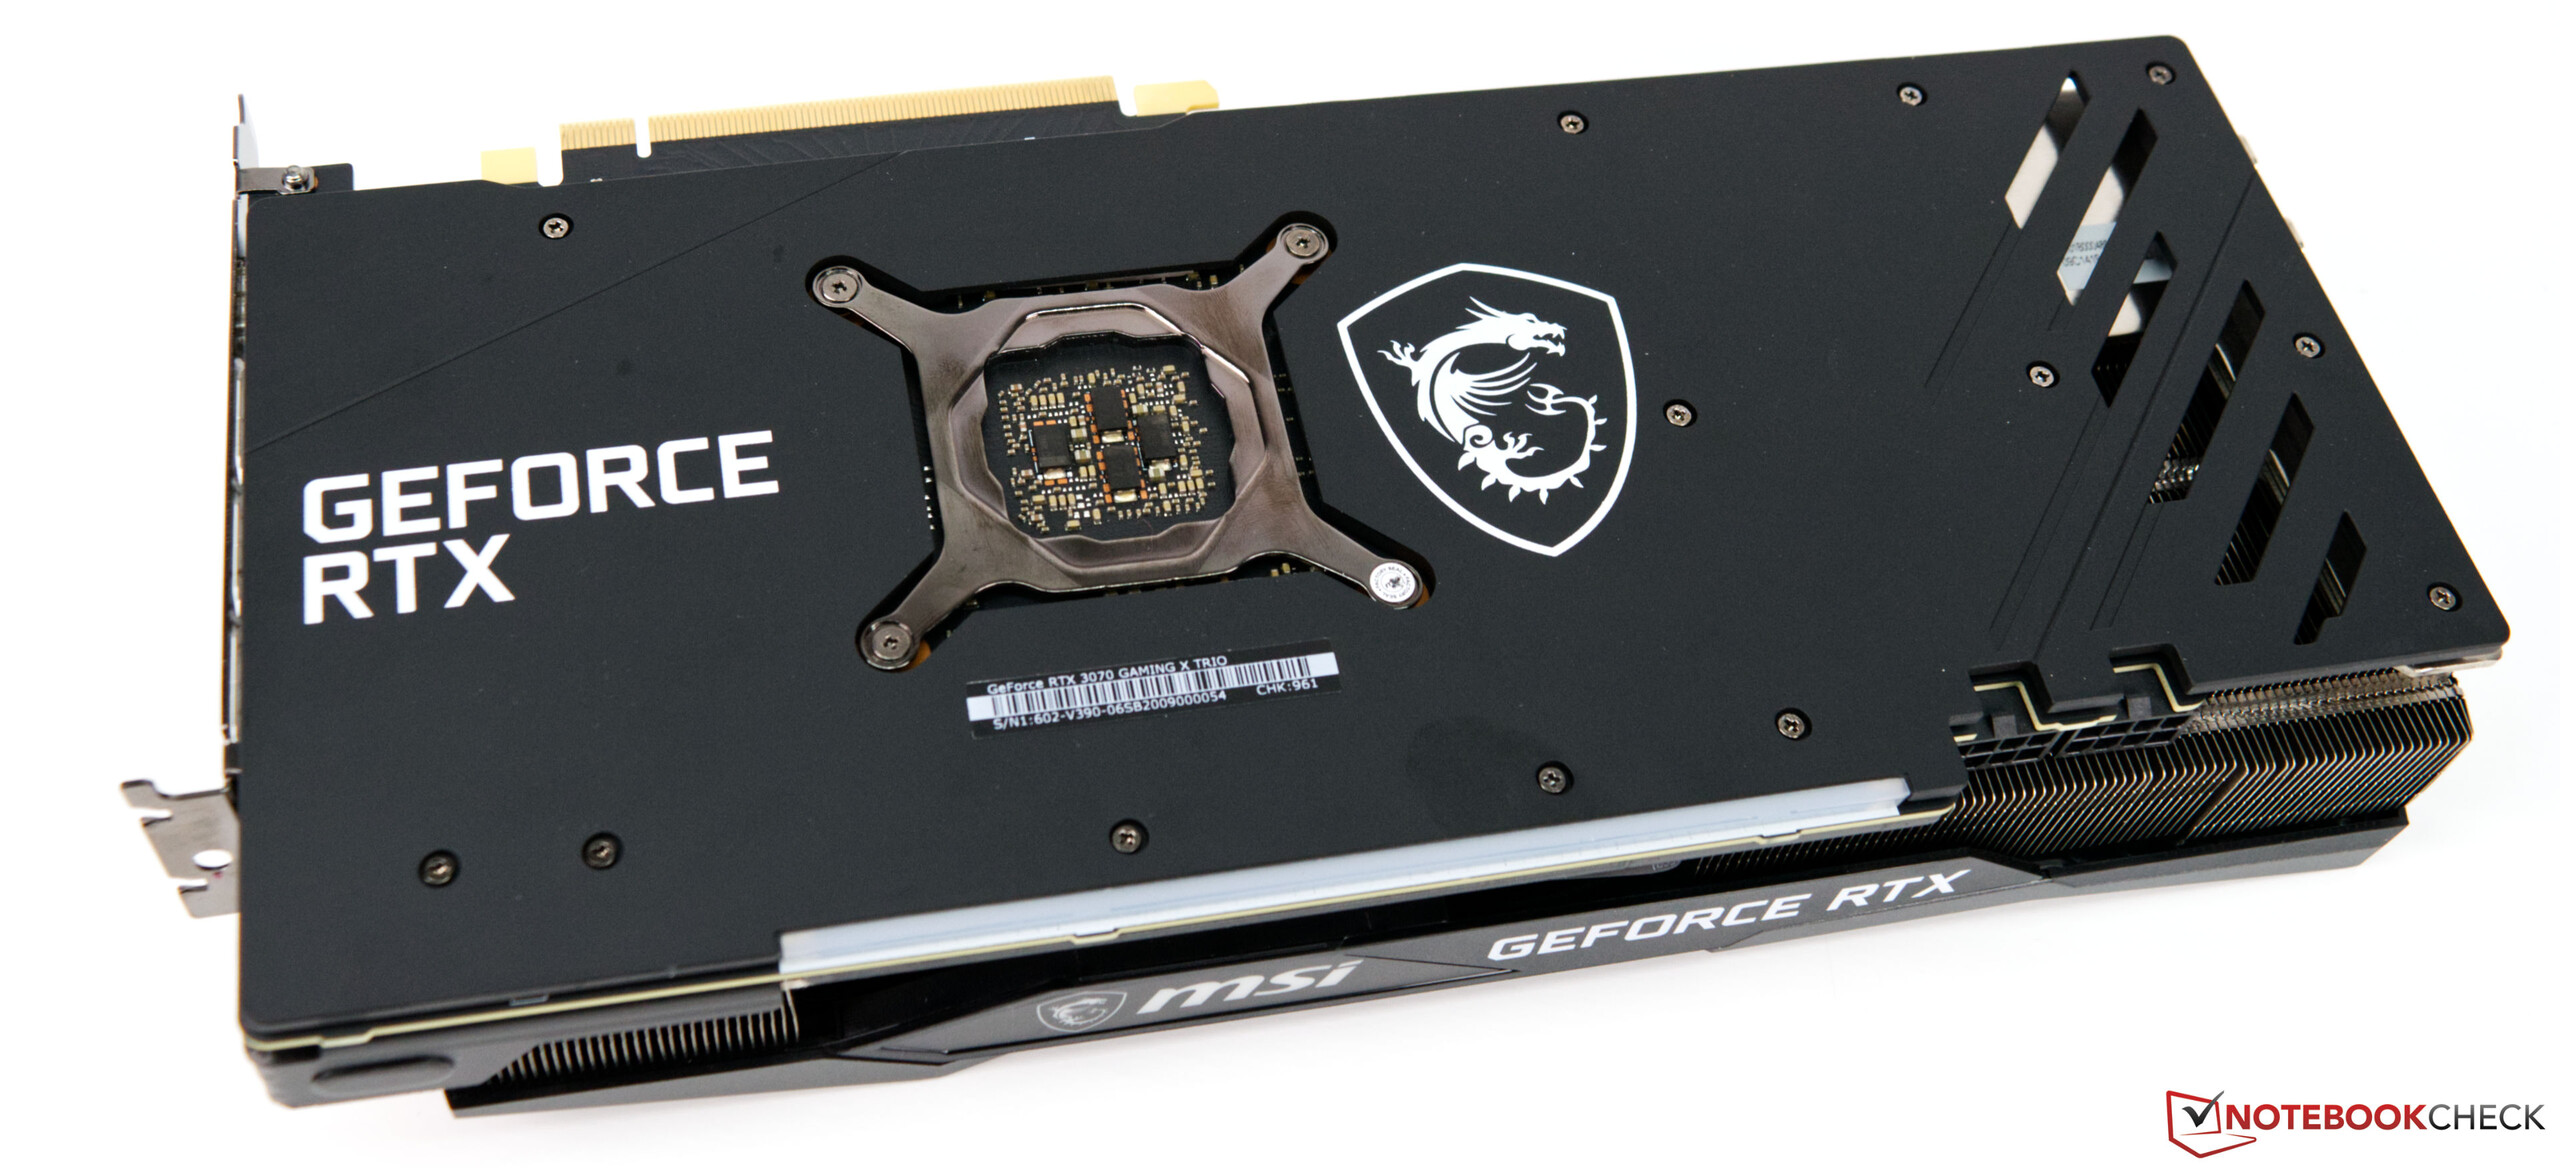
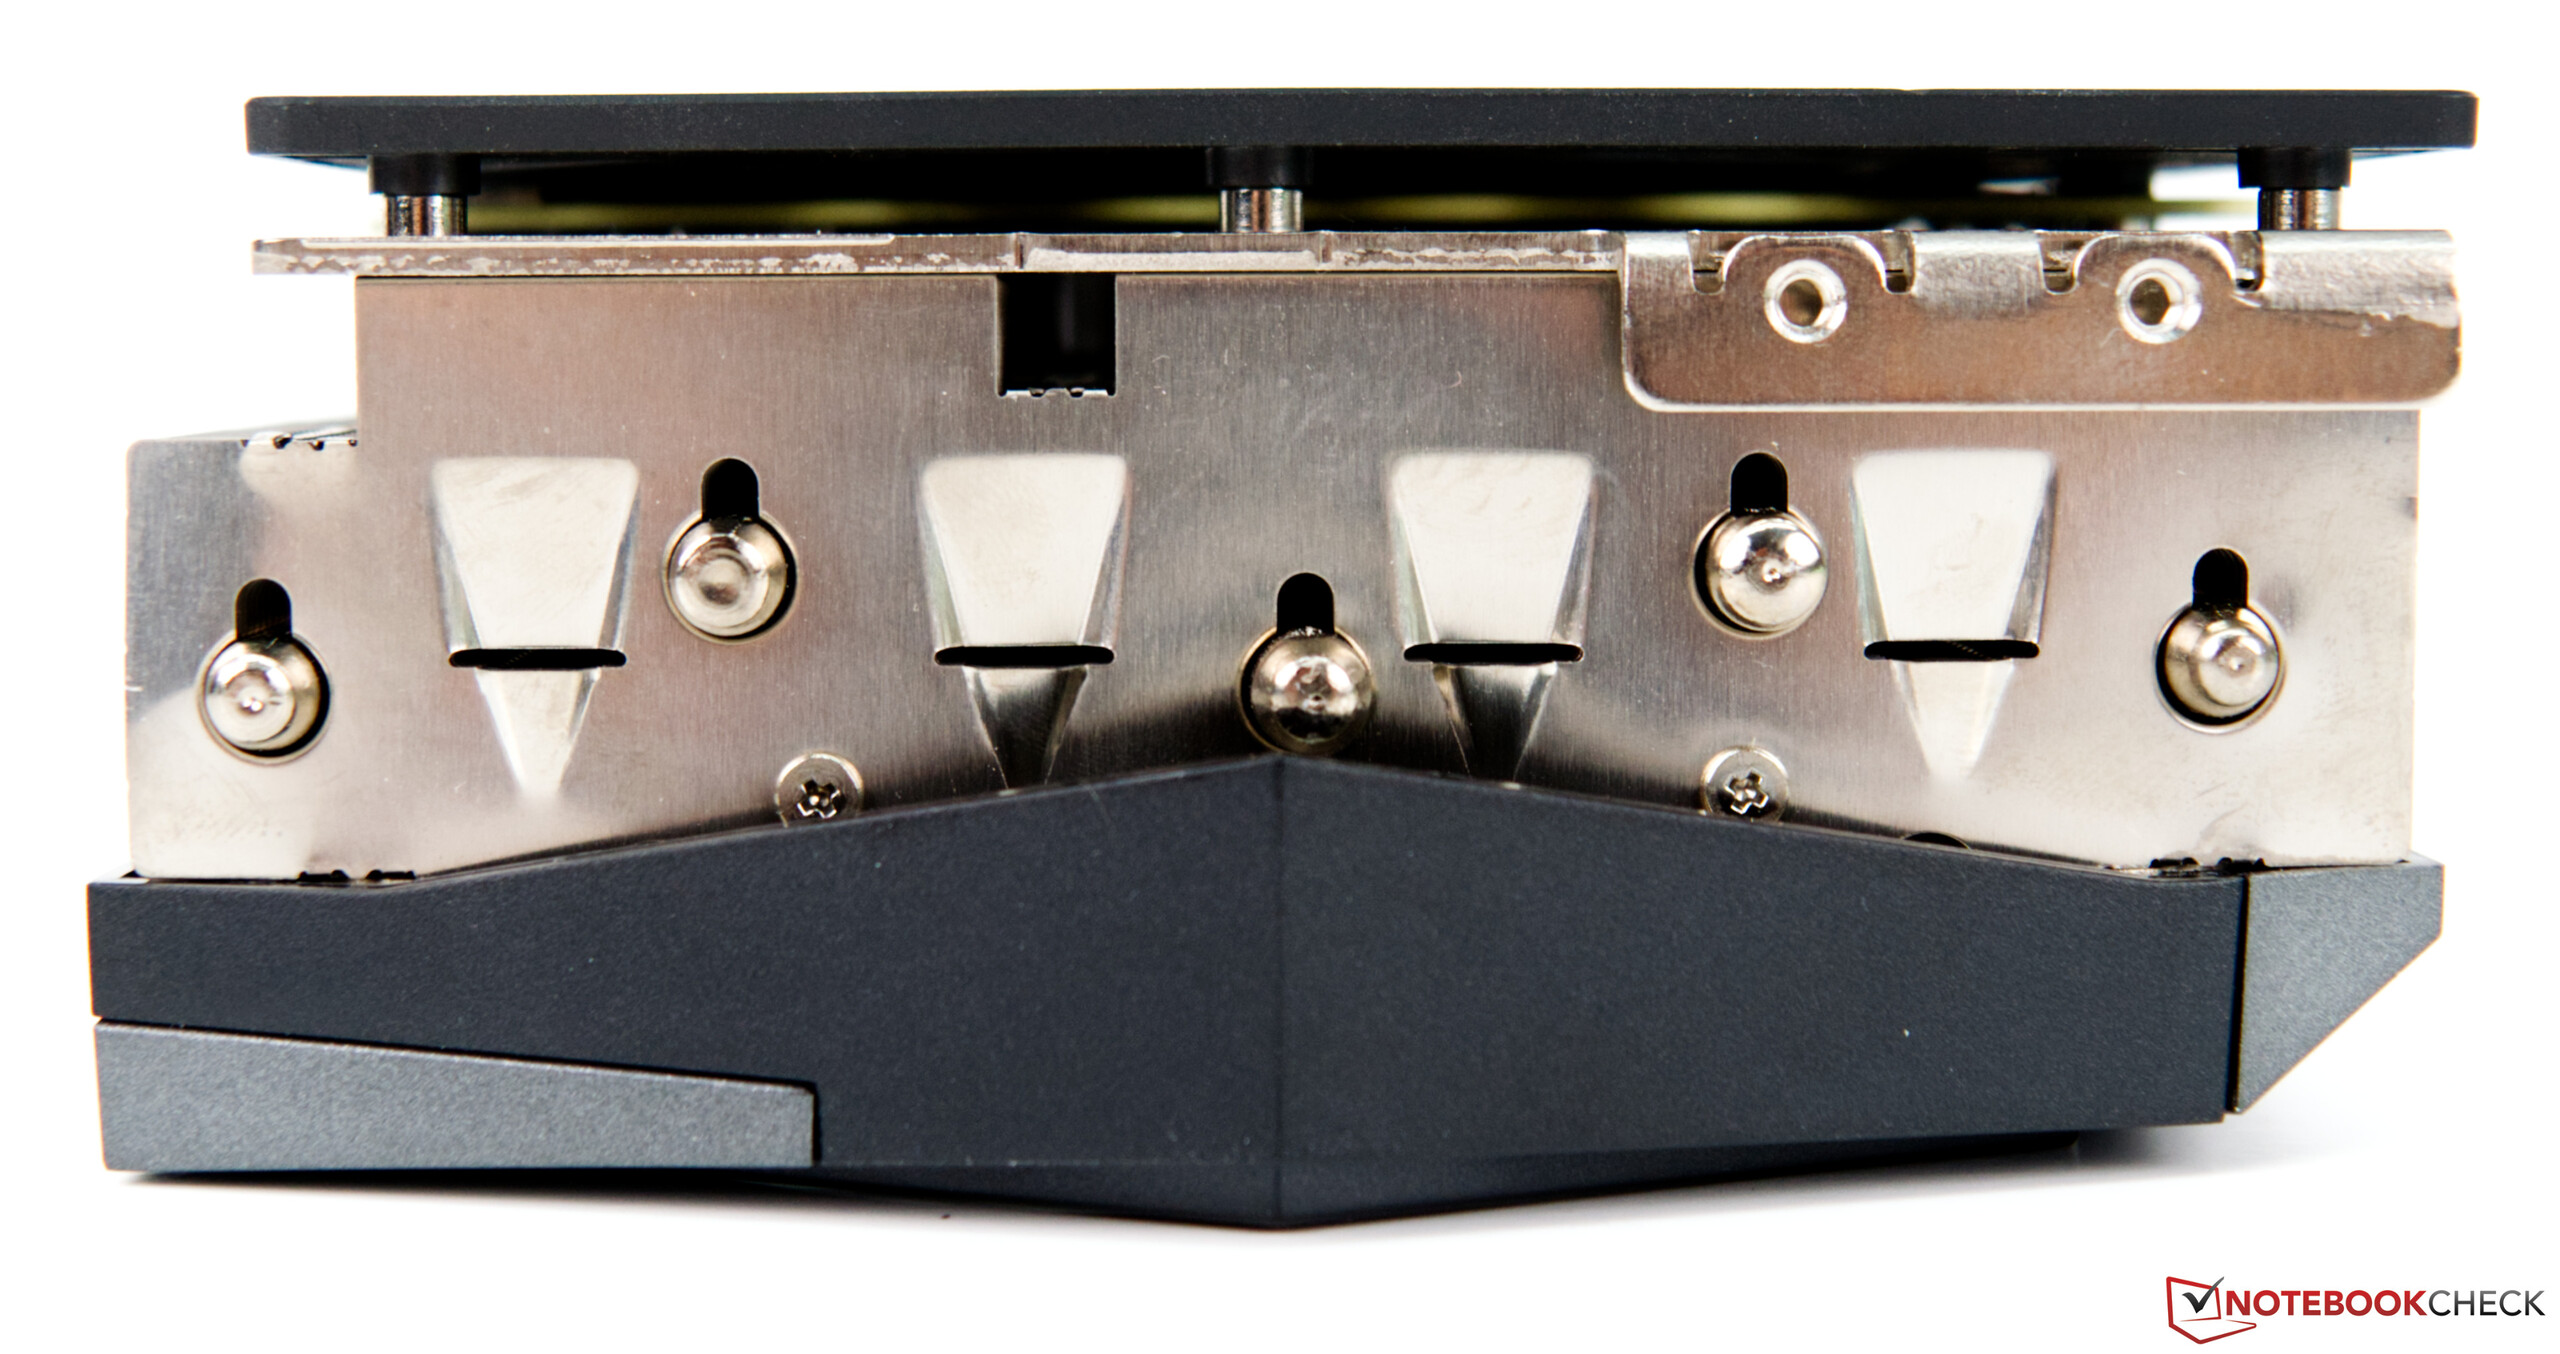
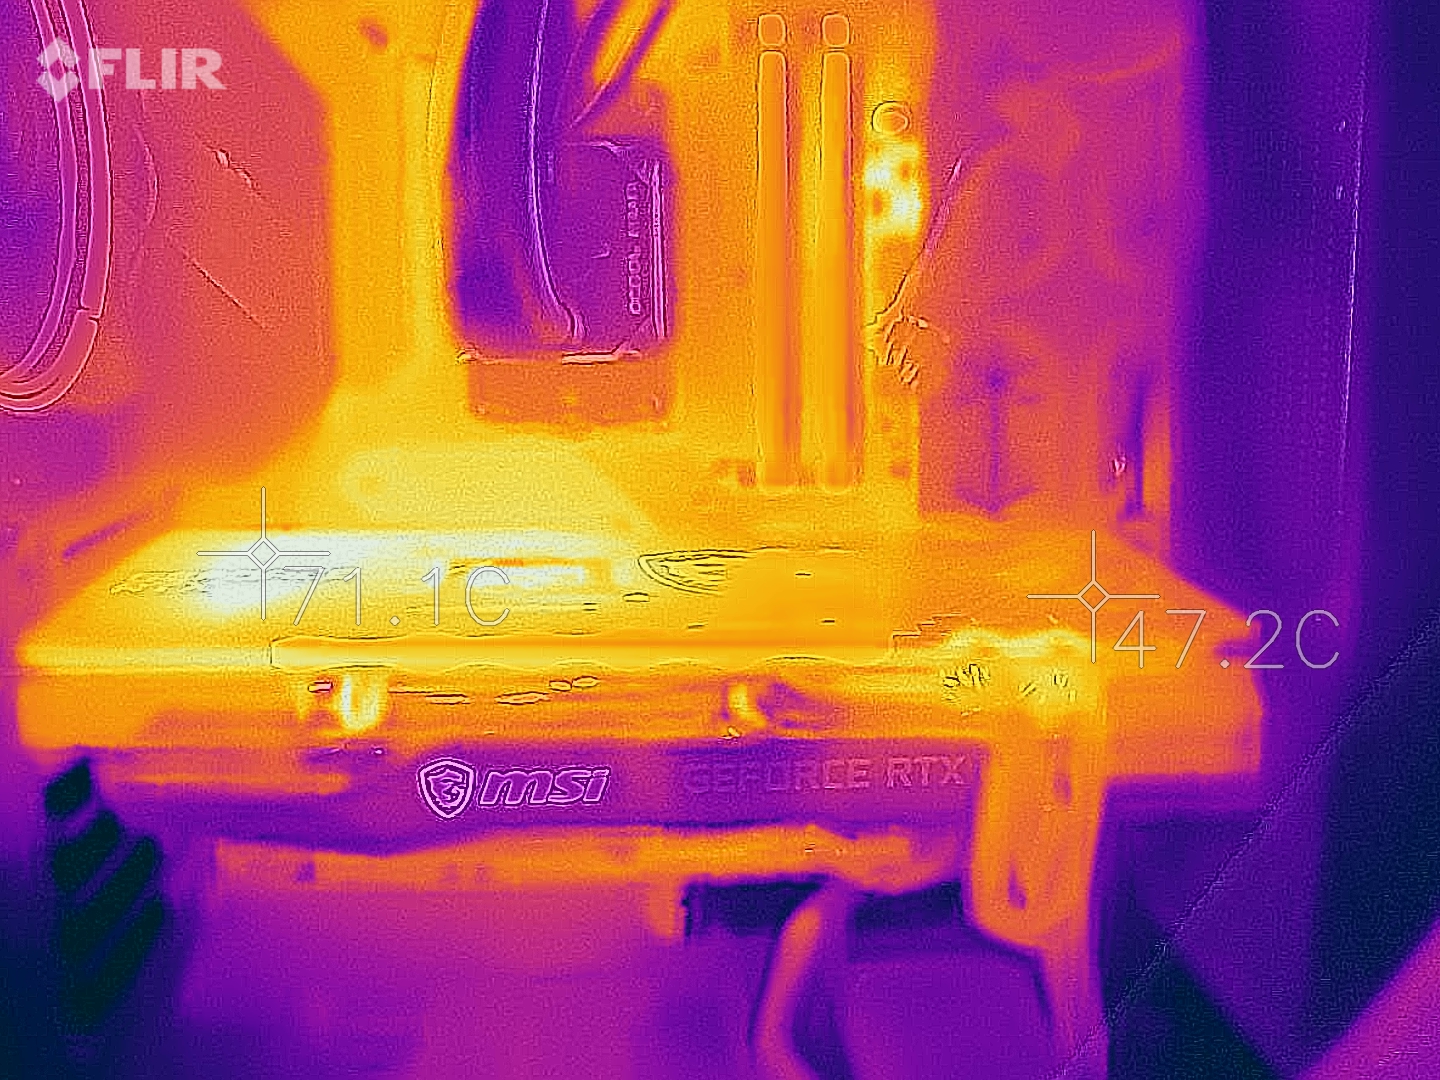
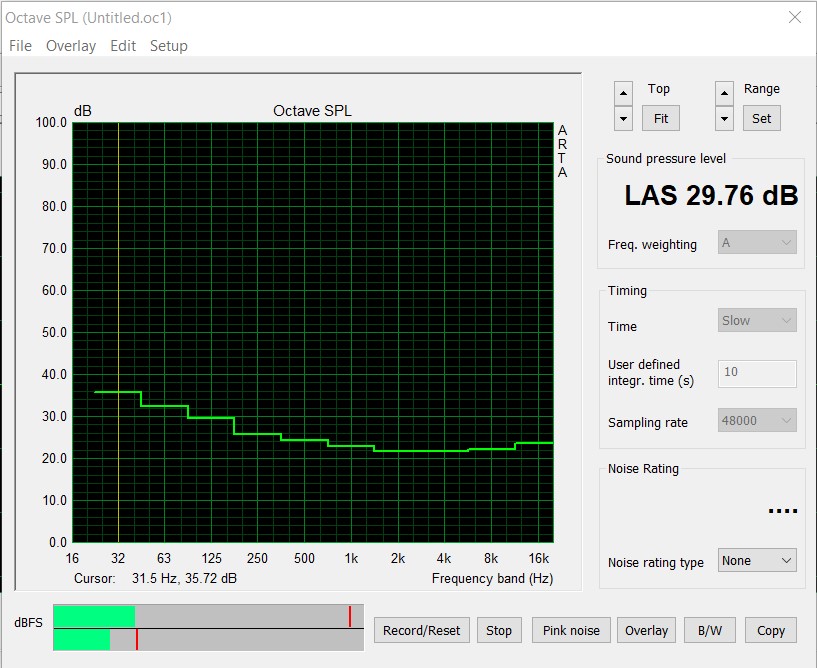
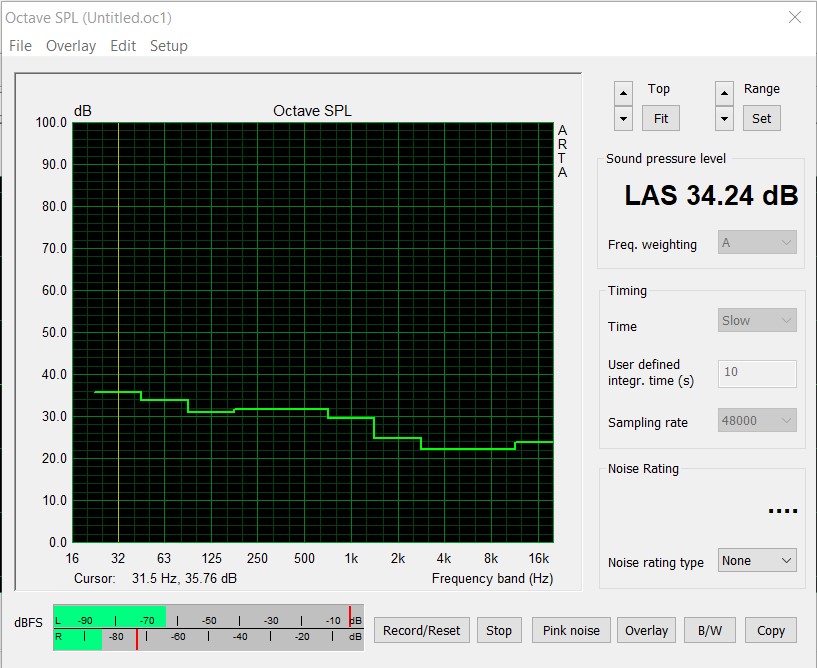
The cooling unit of the Gaming X Trio graphics card is very large, which must be taken into account when choosing a case. In return, the built-in cooler does an excellent job and cools the graphics card reliably and quietly. Without load, the fans stand still, so that no noise is generated. Only under load do the three axial fans turn up a bit. We could only measure a maximum of 34.24 dB(A) in the stress test, though. Consequently, this graphics card is very quiet even under load. Nevertheless, the GPU temperature remains far away from critical levels at a maximum of 67 °C (~153 °F).
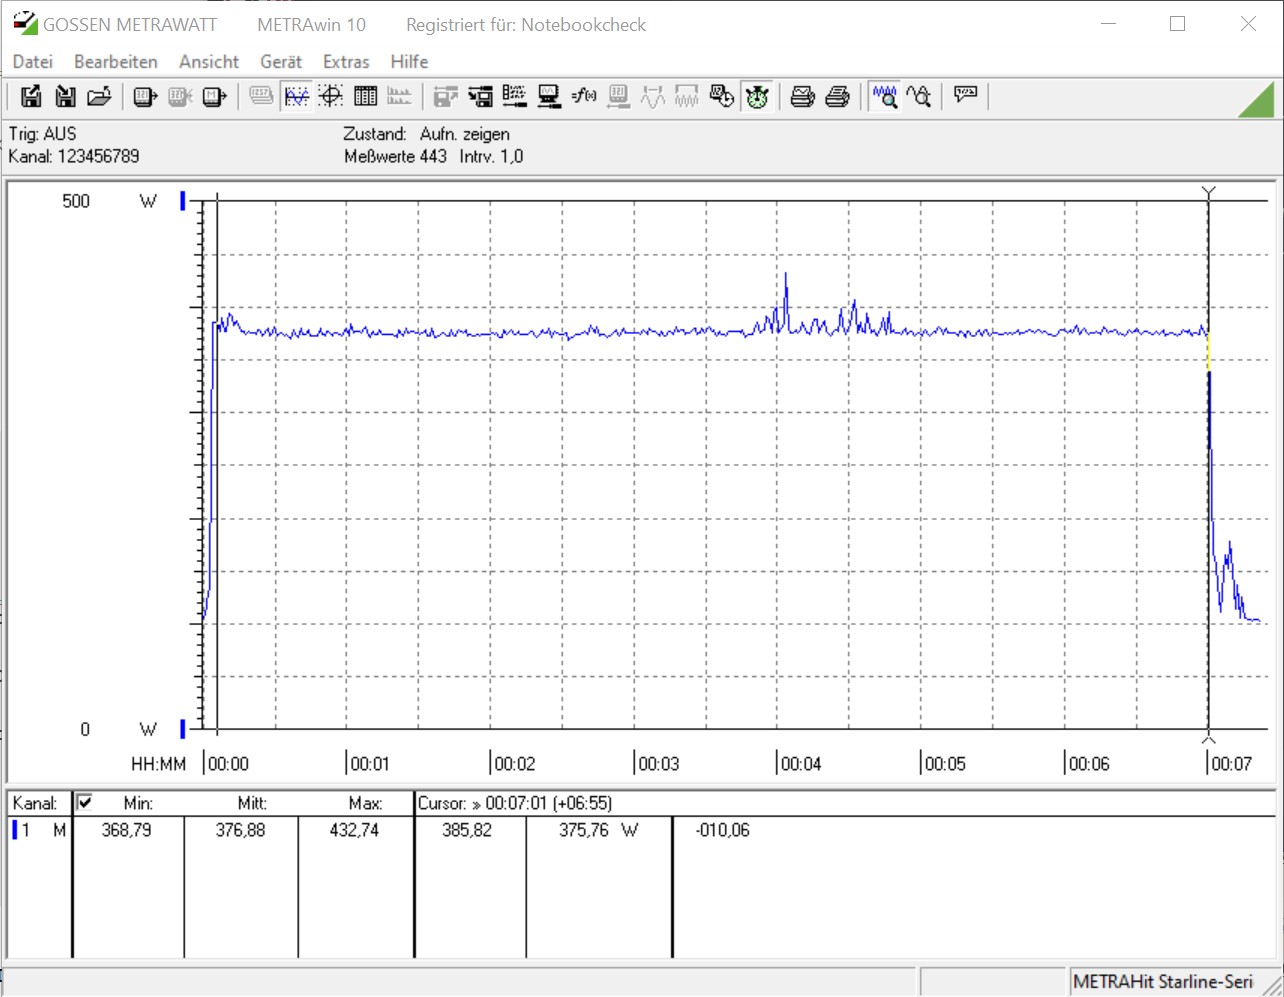
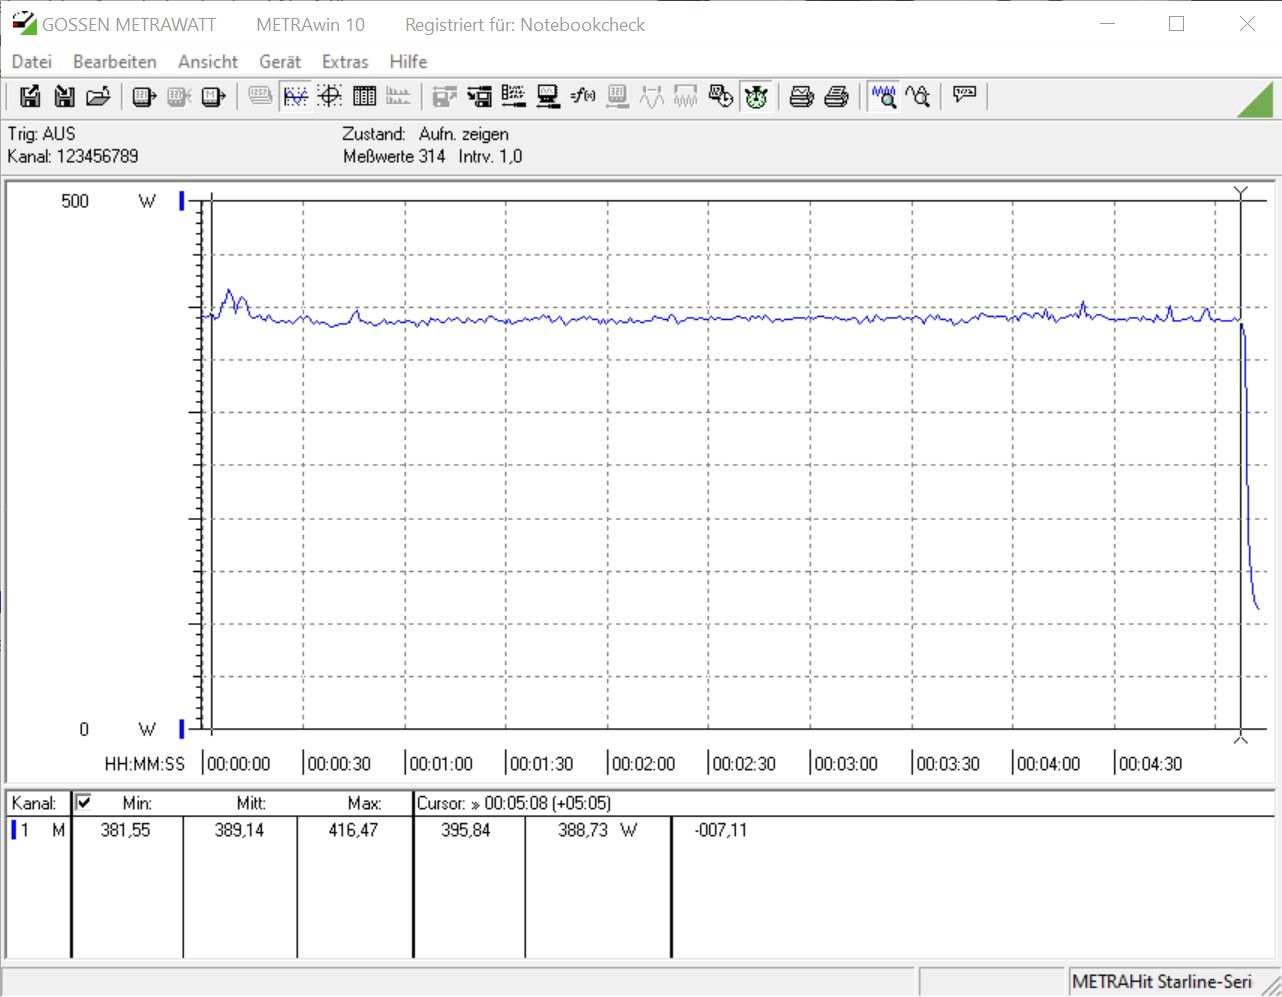
When it comes to power consumption, the MSI GeForce RTX 3070 Gaming X Trio performs quite well. The test system requires about 95 watts in idle usage. At the same time, however, 394 watts is drawn from the power outlet during gaming. But the result is still good in the end, because the GeForce RTX 2080 Ti always needed slightly more energy in our test. The difference to the GeForce RTX 2070 Super is relatively small.

* ... smaller is better
Pros
Cons
Verdict - Almost inaudible despite higher TDP

The GeForce RTX 3070 is still the smallest Ampere GPU for the consumer market so far. With the GeForce RTX 3070 Gaming X Trio, MSI continues to develop the Gaming X Trio series very well. The test sample offers more performance due to the higher TDP, which results in a slightly higher boost speed. But the very good cooler also contributes to not having to sacrifice performance under load. Furthermore, the GPU never reached critical temperatures. Nonetheless, the graphics card is hardly audible in a closed case.
When the graphics card is available, it will currently set you back almost 720 Euros (~$857). This is significantly above the MSRP that MSI has set for the GeForce Gaming X Trio. According to the manufacturer, this value is 559 Euros (~$665). It's understandable that these board partner cards cost slightly more than the reference models due to the very good cooler and the RGB lighting. But at the moment, the very scarce stocks are driving the price up even further.
Owners of a GeForce RTX 2080 Ti can remain still and relax, because an upgrade is not worth it in this case. Users who still play with a Pascal GPU such as the GTX 1070 or the GTX 1080, though, can consider upgrading, since the increase in performance is significantly noticeable here.
With the GeForce RTX 3070 Gaming X Trio, not only does MSI have a very quiet graphics card with an Ampere GPU on the market, but it also increases the TDP limit to achieve slightly more performance.
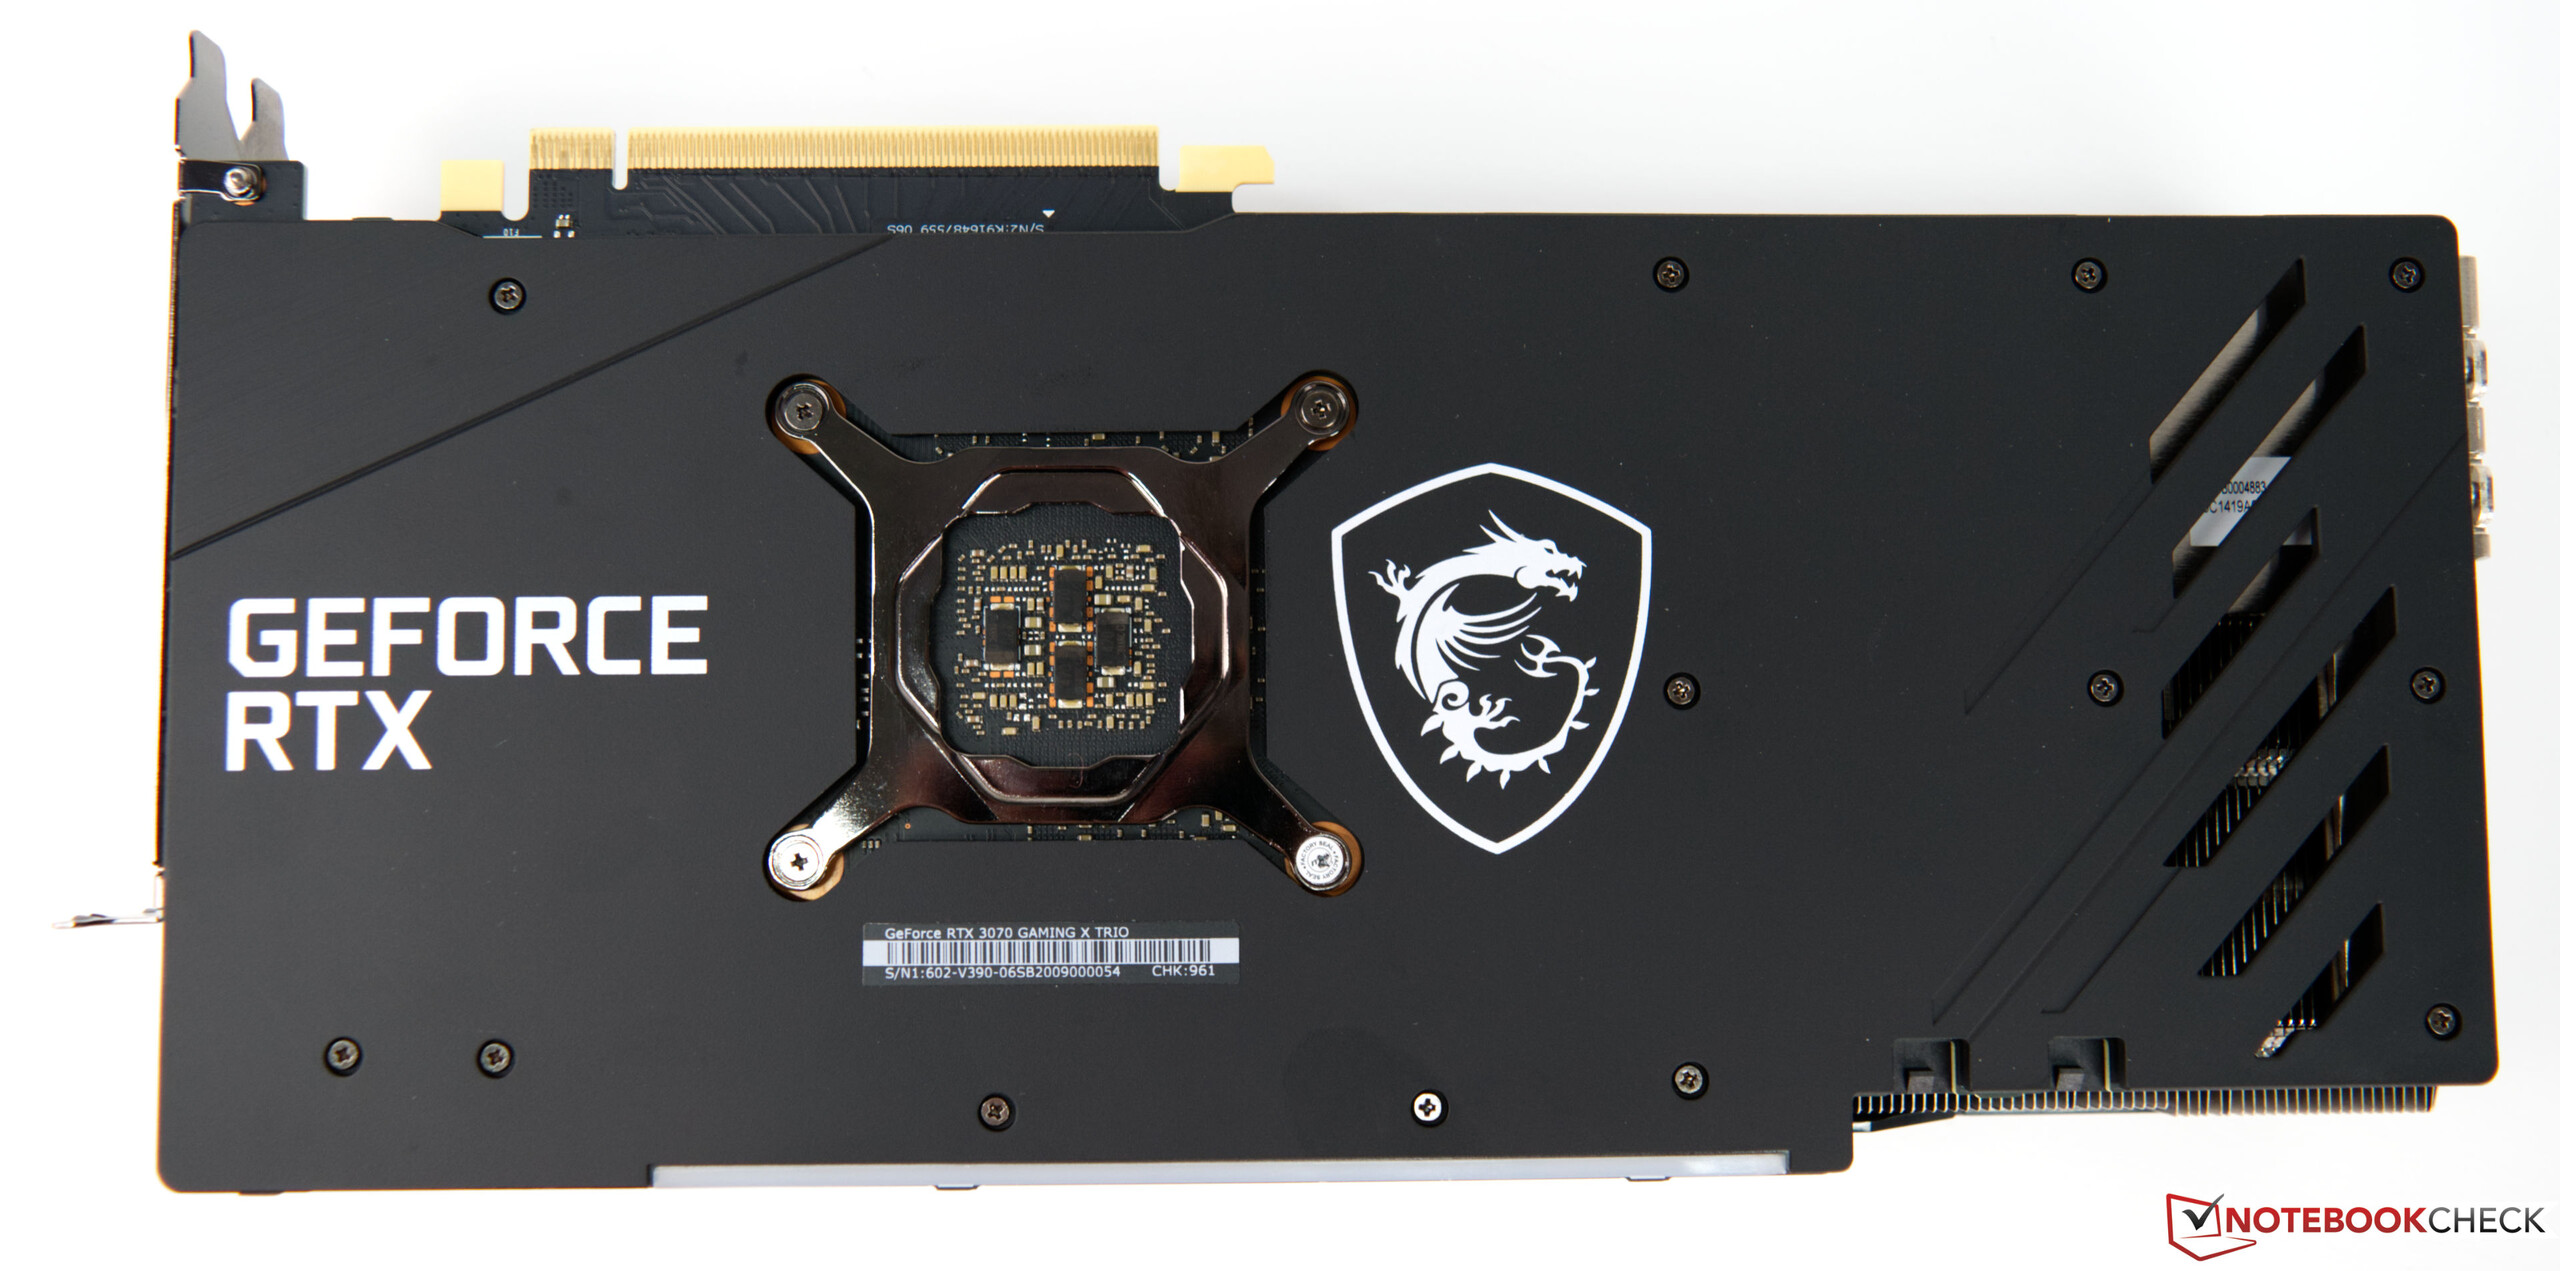
Besides the price, which is the only point of criticism that can currently be mentioned, the size of the graphics card could also be included at this point. At the same time, however, the size of the card is also responsible for the low noise level under load, because a large PCB allows heat to be distributed better. So, if you want to buy the GeForce RTX 3070 Gaming X Trio, you should take this into account when choosing the case. When it comes to the choice of the power supply, you're well served with a 650-watt power supply unit.
All benchmarks and test values for the RTX 3070 can be found on the graphics card site for the GeForce RTX 3070 (regularly updated).


