 Deutsch
 English
 Español
 Français
 Italiano
 Nederlands
 Polski
 Português
 Русский
 Türkçe
 Svenska
 Chinese
 Magyar
Lenovo Yoga C930-13IKB (i7-8550U, FHD) Convertible Review
")
Not to be confused with the very different Yoga Book C930, the Yoga C930 is the direct successor to last year's Yoga 920. This latest iteration is actually slightly thicker than its predecessor and it drops the unique watchband hinge in favor of added functionality such as larger internal speakers and a new integrated active stylus. See our original preview page for an overview of the changes from the Yoga 920.
Currently, the Yoga C930 is only available in just a handful of SKUs. The base configuration is equipped with a Core i5-8250U CPU, FHD touchscreen, 8 GB of DDR4 RAM, and a 256 GB PCIe SSD while the higher-end configuration uses a Core i7-8550U CPU, 4K UHD touchscreen, 16 GB of RAM, and up to 1 TB of storage. Our test model today is the mid-range option with the i7-8550U, FHD touchscreen, and 12 GB of RAM retailing for about $1400 to $1500 USD.
Since this is our second Yoga C930 unit, we recommend checking out the full review on our first Yoga C930 unit for more information on the chassis and its features. Our review here will instead focus on the performance of the i7-8550U configuration and how it compares to the i5-8250U configuration.
Competitors in this convertible subnotebook space include the HP Spectre x360 13, Dell XPS 13 9365 2-in-1, Acer Spin 5, and Asus ZenBook Flip 14.
More Lenovo Yoga reviews:
Case


Connectivity

Communication
| Networking | |
| iperf3 transmit AX12 | |
| HP Spectre x360 13-ae048ng | |
| Lenovo Yoga C930-13IKB 81C4 | |
| Lenovo Yoga 920-13IKB-80Y7 | |
| Dell XPS 13 9370 i7 UHD | |
| iperf3 receive AX12 | |
| Dell XPS 13 9370 i7 UHD | |
| Lenovo Yoga 920-13IKB-80Y7 | |
| Lenovo Yoga C930-13IKB 81C4 | |
| HP Spectre x360 13-ae048ng | |
Display
Unsurprisingly, display measurements are close to that of our Core i5 test unit since both use the same AU Optronics B139HAN03_0 IPS panel. Backlight bleeding is once again minimal to suggest excellent display consistency between different C930 systems.
It remains to be seen how the 4K UHD configuration performs as it will likely have different display properties as the FHD option. It's unfortunate that display brightness is only around 300 nits as the XPS 15, MacBook Pro 15, and Surface Pro alternatives are much brighter for better outdoor visibility.


| |||||||||||||||||||||||||
Brightness Distribution: 87 %
Center on Battery: 312 cd/m²
Contrast: 726:1 (Black: 0.43 cd/m²)
ΔE Color 7.6 | 0.5-29.43 Ø5, calibrated: 1.96
ΔE Greyscale 8.8 | 0.57-98 Ø5.3
92.3% sRGB (Argyll 1.6.3 3D)
59.1% AdobeRGB 1998 (Argyll 1.6.3 3D)
64.7% AdobeRGB 1998 (Argyll 2.2.0 3D)
92.6% sRGB (Argyll 2.2.0 3D)
62.7% Display P3 (Argyll 2.2.0 3D)
Gamma: 2.01
| Lenovo Yoga C930-13IKB 81C4 AUO B139HAN03_0, IPS, 13.90, 1920x1080 | Lenovo Yoga C930-13IKB B139HAN03_0, IPS, 13.90, 1920x1080 | Lenovo Yoga 920-13IKB-80Y7 AU Optronics B139HAN03.0, IPS, 13.90, 1920x1080 | HP Spectre x360 13-ae048ng Chi Mei (CMN1376), IPS, 13.30, 1920x1080 | Acer Spin 3 SP314-51-548L BOE CQ NV140FHM-N41, IPS, 14.00, 1920x1080 | Dell XPS 13 9370 i7 UHD ID: Sharp SHP148B, Name: LQ133D1, Dell P/N: 8XDHY, IPS, 13.30, 3840x2160 | |
|---|---|---|---|---|---|---|
| Display | 2% | -1% | 8% | -37% | 8% | |
| Display P3 Coverage | 62.7 | 64.3 3% | 62.5 0% | 68.1 9% | 39.68 -37% | 68.9 10% |
| sRGB Coverage | 92.6 | 94.6 2% | 91.7 -1% | 99.5 7% | 58.9 -36% | 98.4 6% |
| AdobeRGB 1998 Coverage | 64.7 | 66.2 2% | 64.1 -1% | 70.2 9% | 41 -37% | 69.5 7% |
| Response Times | -14% | -29% | -5% | -31% | -87% | |
| Response Time Grey 50% / Grey 80% * | 34.4 ? | 40.8 ? -19% | 46 ? -34% | 36 ? -5% | 43 ? -25% | 69.6 ? -102% |
| Response Time Black / White * | 25.6 ? | 27.6 ? -8% | 31.6 ? -23% | 27 ? -5% | 35 ? -37% | 44 ? -72% |
| PWM Frequency | 25000 ? | 1000 | 3759 ? | |||
| Screen | 10% | 6% | 30% | 6% | 34% | |
| Brightness middle | 312 | 316 1% | 297.9 -5% | 311 0% | 220 -29% | 478.5 53% |
| Brightness | 295 | 291 -1% | 278 -6% | 278 -6% | 221 -25% | 466 58% |
| Brightness Distribution | 87 | 83 -5% | 81 -7% | 82 -6% | 78 -10% | 86 -1% |
| Black Level * | 0.43 | 0.36 16% | 0.44 -2% | 0.2 53% | 0.18 58% | 0.43 -0% |
| Contrast | 726 | 878 21% | 677 -7% | 1555 114% | 1222 68% | 1113 53% |
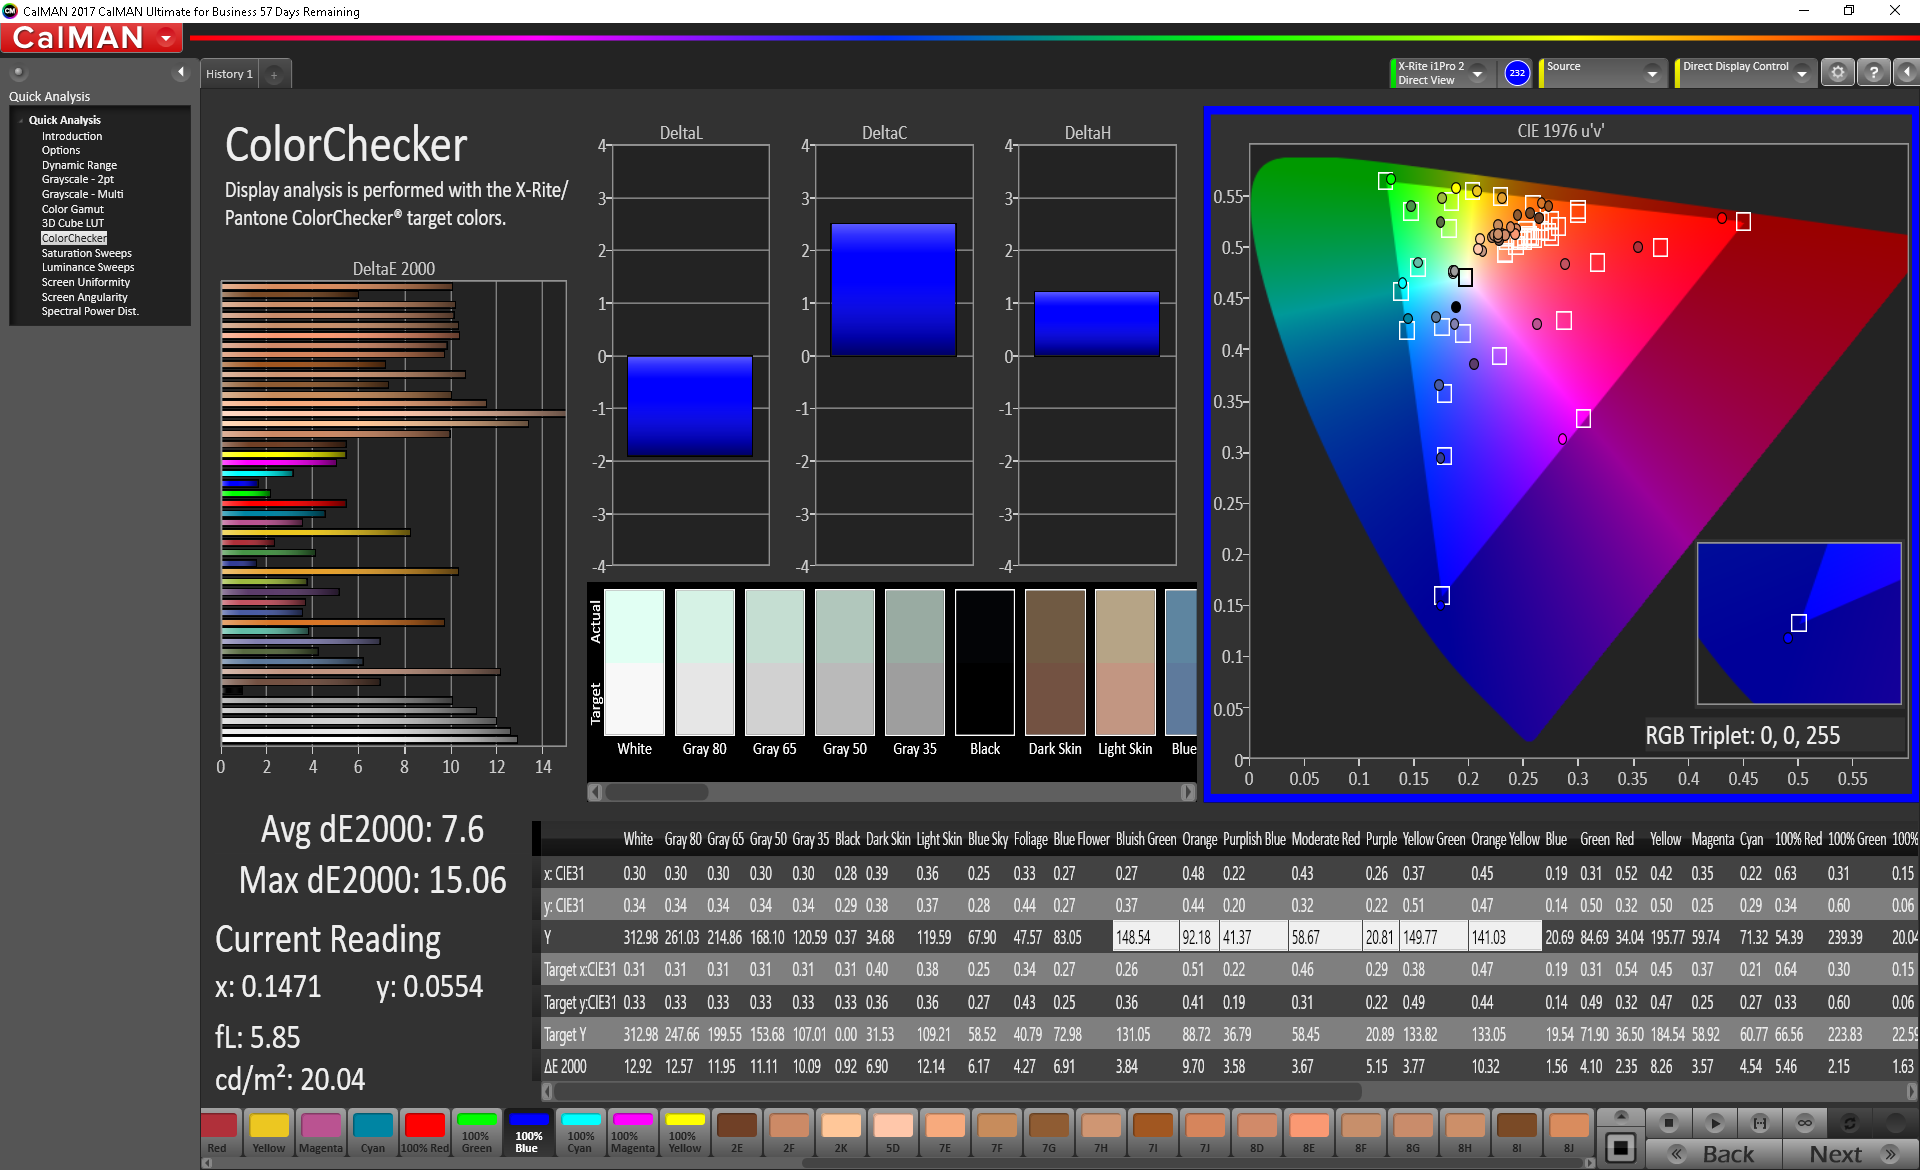
| Colorchecker dE 2000 * | 7.6 | 5.9 22% | 5.1 33% | 3.98 48% | 3.98 48% | 3.09 59% |
| Colorchecker dE 2000 max. * | 15.06 | 12.9 14% | 11 27% | 8.48 44% | 7.69 49% | 5.94 61% |
| Colorchecker dE 2000 calibrated * | 1.96 | 1.3 34% | 4 -104% | 2.06 -5% | ||
| Greyscale dE 2000 * | 8.8 | 8.6 2% | 6.7 24% | 5.57 37% | 1.68 81% | 2.4 73% |
| Gamma | 2.01 109% | 2.1 105% | 2.9 76% | 2.51 88% | 2.37 93% | 2.063 107% |
| CCT | 6874 95% | 6854 95% | 6839 95% | 7810 83% | 6382 102% | 6883 94% |
| Color Space (Percent of AdobeRGB 1998) | 59.1 | 60.7 3% | 64.1 8% | 64 8% | 38 -36% | 69.47 18% |
| Color Space (Percent of sRGB) | 92.3 | 94.5 2% | 91.7 -1% | 99 7% | 58 -37% | 98.36 7% |
| Total Average (Program / Settings) | -1% /
6% | -8% /
0% | 11% /
21% | -21% /
-7% | -15% /
14% |
* ... smaller is better


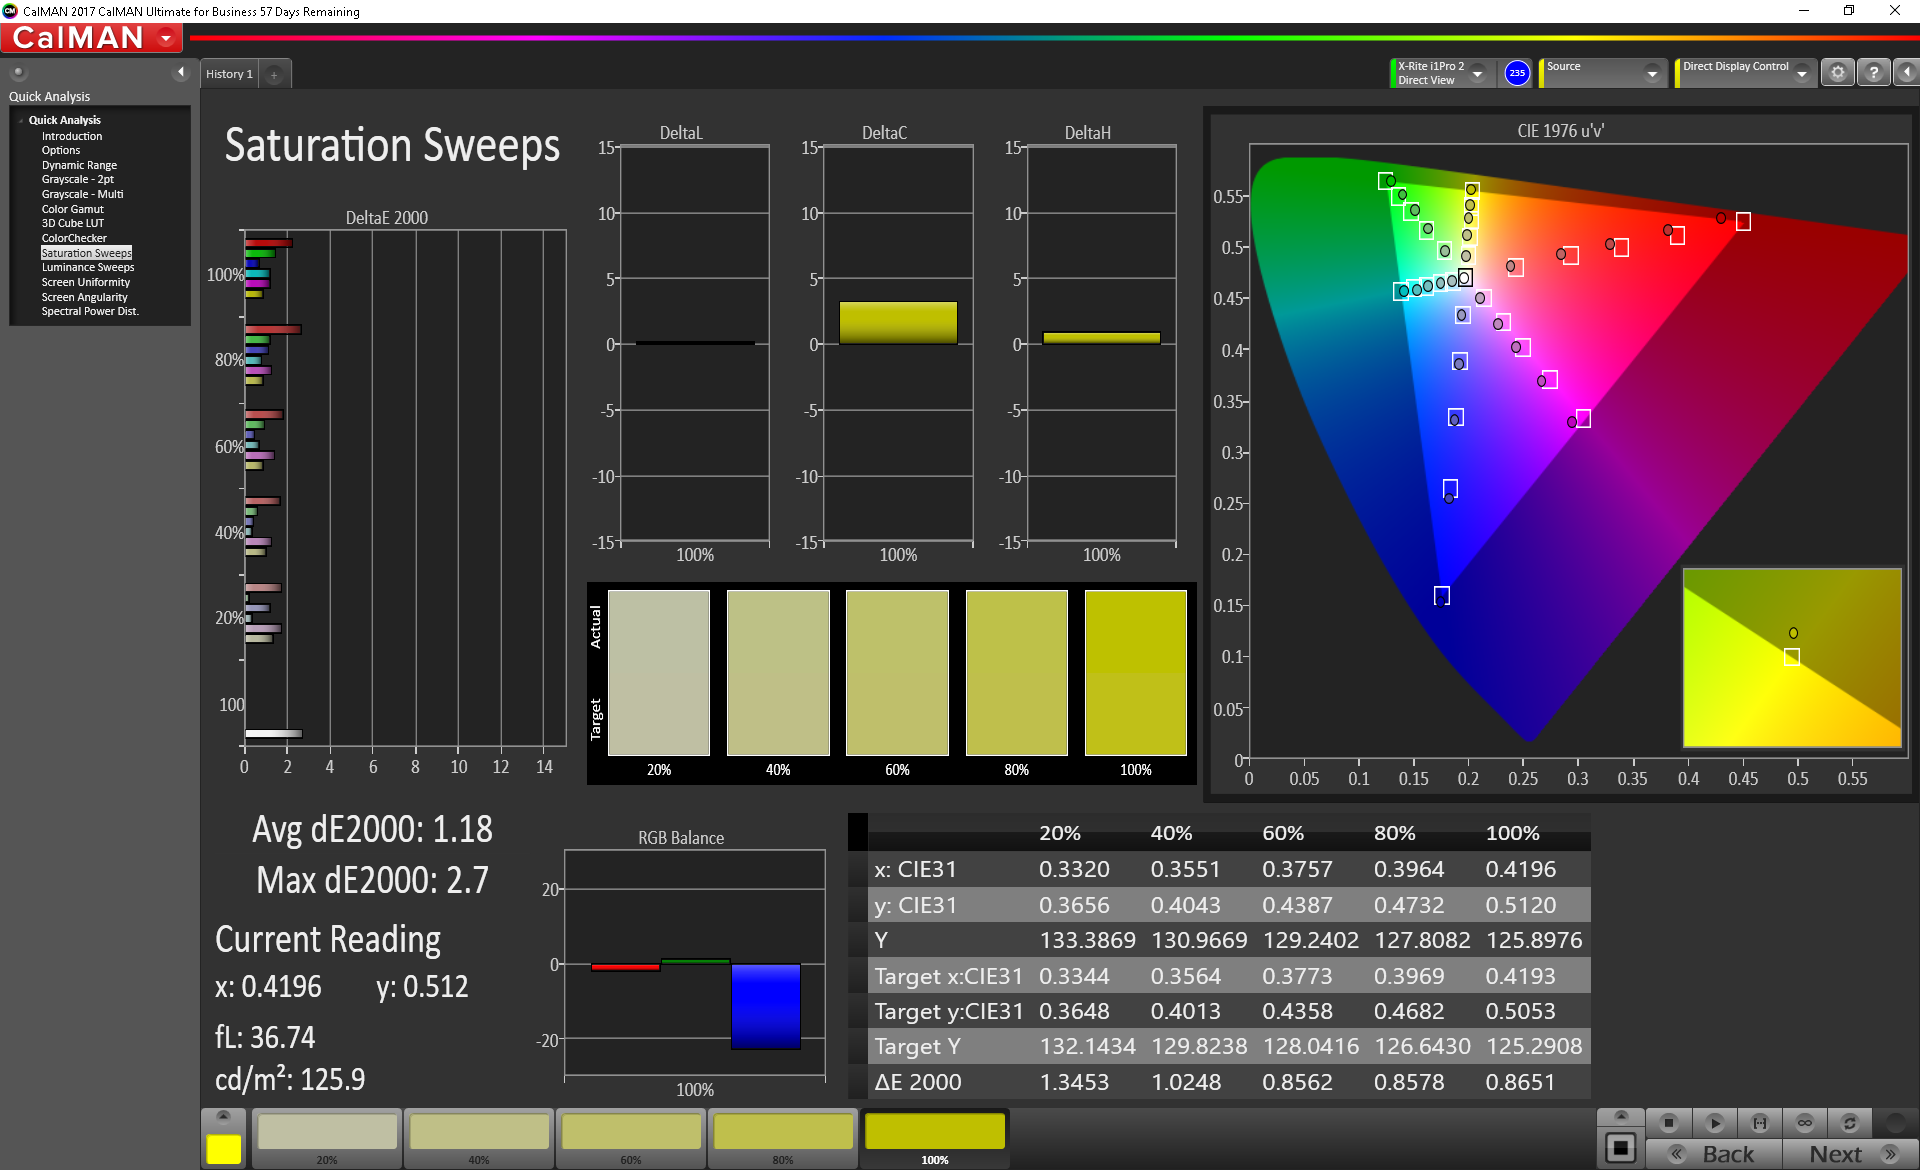
Color accuracy is disappointingly below average out of the box with an overly cool color temperature. Our calibration efforts address the issue and we highly recommend applying our ICC profile above to get the most out of the display.


Display Response Times
| ↔ Response Time Black to White | ||
|---|---|---|
| 25.6 ms ... rise ↗ and fall ↘ combined | ↗ 15.6 ms rise |  |
| ↘ 10 ms fall | ||
| The screen shows relatively slow response rates in our tests and may be too slow for gamers. In comparison, all tested devices range from 0.1 (minimum) to 240 (maximum) ms. » 56 % of all devices are better. This means that the measured response time is worse than the average of all tested devices (21.5 ms). | ||
| ↔ Response Time 50% Grey to 80% Grey | ||
| 34.4 ms ... rise ↗ and fall ↘ combined | ↗ 18.8 ms rise |  |
| ↘ 15.6 ms fall | ||
| The screen shows slow response rates in our tests and will be unsatisfactory for gamers. In comparison, all tested devices range from 0.2 (minimum) to 636 (maximum) ms. » 42 % of all devices are better. This means that the measured response time is similar to the average of all tested devices (33.7 ms). | ||
Screen Flickering / PWM (Pulse-Width Modulation)
| Screen flickering / PWM not detected |  | ||
In comparison: 53 % of all tested devices do not use PWM to dim the display. If PWM was detected, an average of 17844 (minimum: 5 - maximum: 3846000) Hz was measured. | |||
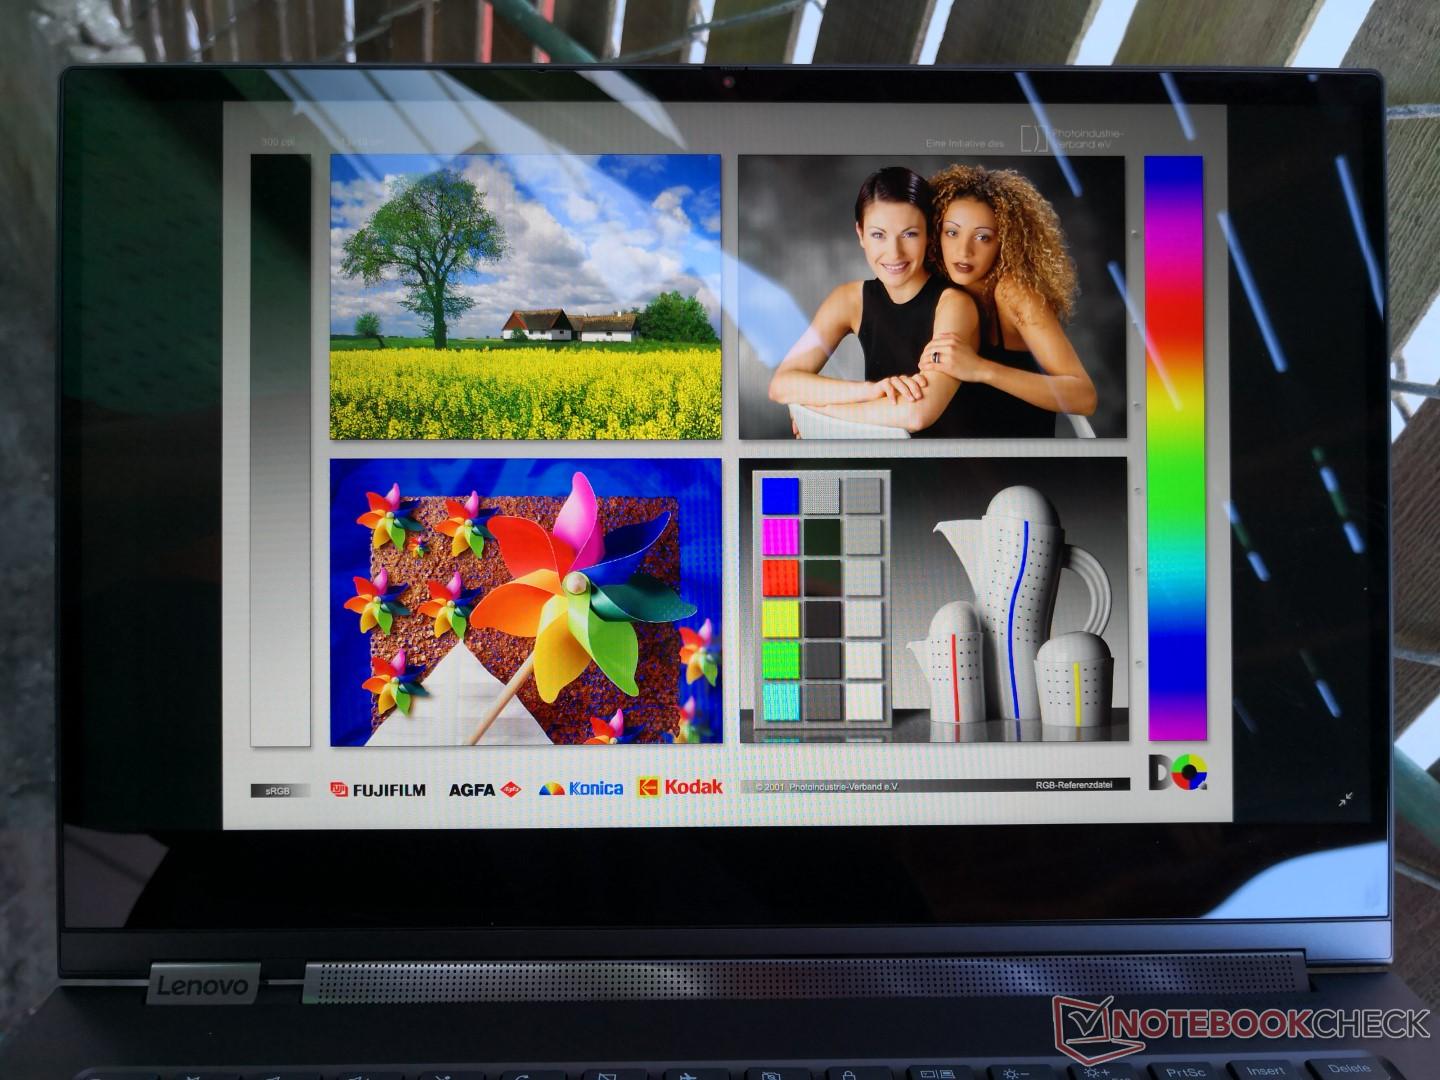
Outdoor visibility is average under shade but somewhat disappointing overall. A brighter backlight would have made the Yoga C930 an even better convertible when on-the-go. Viewing angles are still excellent with no extreme color or contrast degradation from obtuse angles.


Performance


Processor
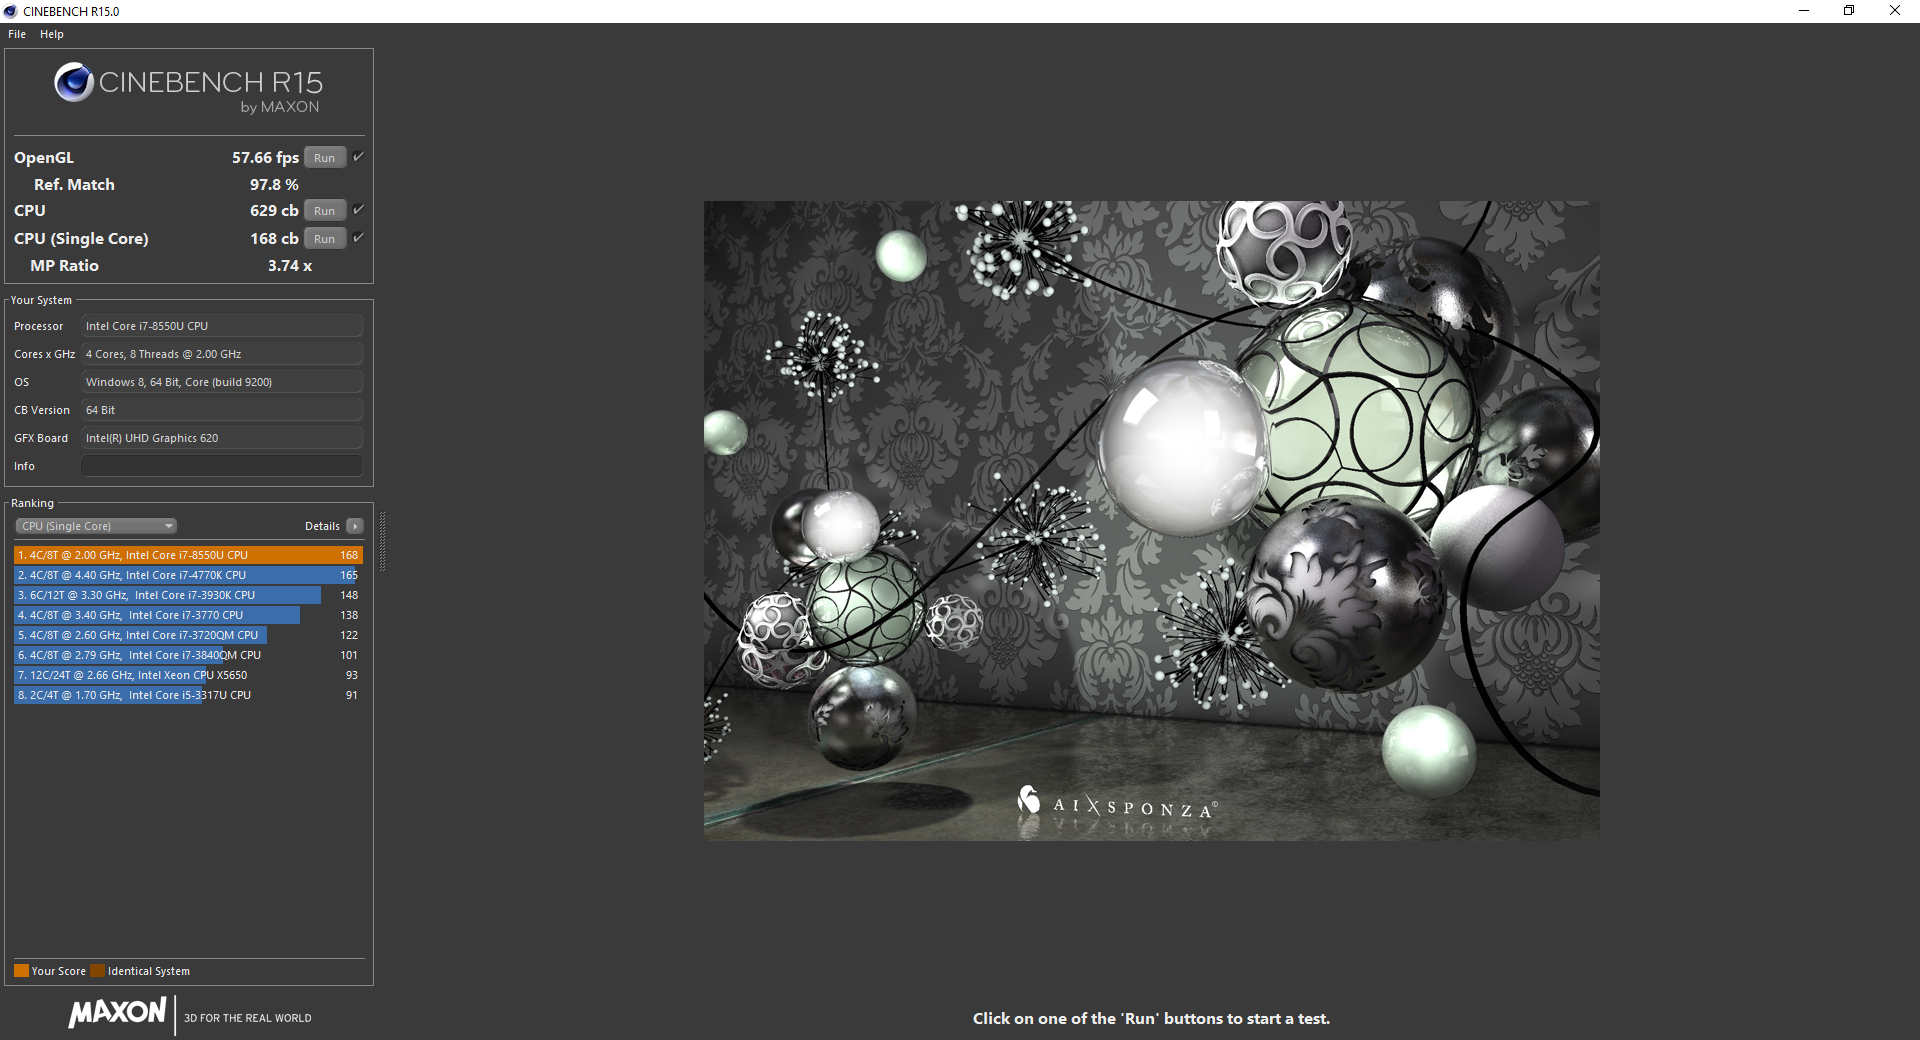
The CineBench R15 Multi-Thread score for our Core i7 SKU is only 3 percent higher than the Core i5 SKU. At first glance, this suggests that the pricier Yoga C930 Core i7 option offers almost no performance benefits over the Core i5 option.
The performance delta between the two configurations begins to widen when testing performance sustainability. By running CineBench R15 Multi-Thread in a loop, we can observe how each CPU performs over time. In this case, the Core i7 SKU is able to maintain faster clock rates than the Core i5 SKU when under stress. Our graph below shows a performance leap of almost 20 percent between the Core i5 and Core i7 towards the end of our stress test. In other words, the Yoga C930 Core i5 SKU suffers from steeper performance throttling than its Core i7 alternative.
Users who may need even more CPU performance should consider the ThinkPad performance series with Coffee Lake-H options.
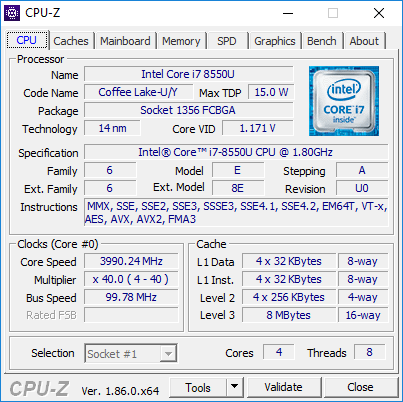
See our dedicated page on the Core i7-8550U for more technical information and benchmark comparisons.
| wPrime 2.10 - 1024m | |
| Lenovo ThinkPad 25 | |
| Lenovo ThinkPad A485-20MU000CGE | |
| Lenovo Yoga 920-13IKB-80Y7 | |
| Average Intel Core i7-8550U (258 - 435, n=11) | |
* ... smaller is better
System Performance
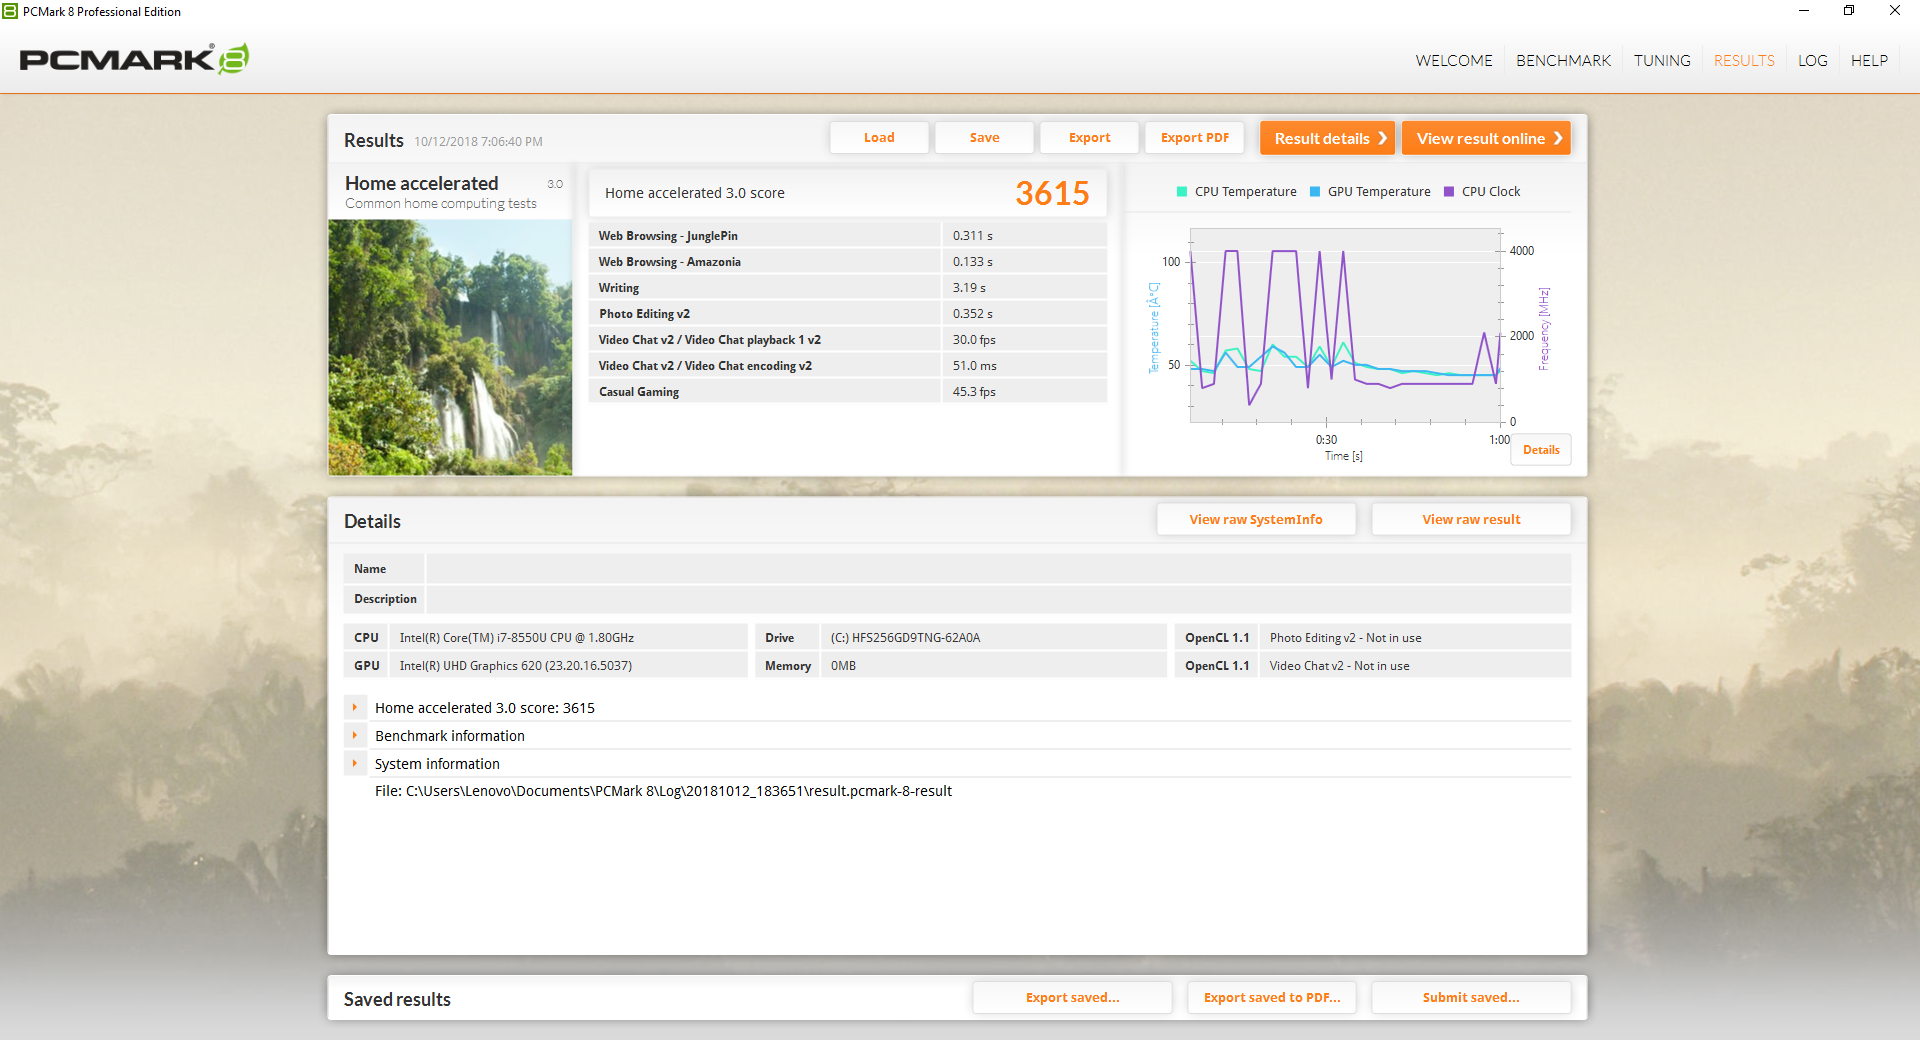
PCMark benchmarks are significantly higher than the Core i5 Yoga C930 SKU by as much as 56 percent. The PCMark score is unusually low and well below average for the Core i5 configuration likely due to unforeseen background activity. Navigation and performance are otherwise smooth and without any hitches or issues on the Core i7 Yoga C930.
A potential bug on our test unit prevents the system from waking properly when put into Sleep mode. We repeated the action several times and the system would always fail to wake each time. We did not experience this on our i5-8250U SKU, so hopefully it is not a widespread problem.


| PCMark 10 - Score | |
| Lenovo Yoga C930-13IKB 81C4 | |
| Lenovo Yoga 920-13IKB-80Y7 | |
| Dell XPS 13 9370 i7 UHD | |
| Average Intel Core i7-8550U, Intel UHD Graphics 620 (2629 - 4072, n=31) | |
| Lenovo Yoga C930-13IKB | |
| PCMark 8 Home Score Accelerated v2 | 3615 points | |
| PCMark 8 Work Score Accelerated v2 | 5110 points | |
| PCMark 10 Score | 4072 points | |
Help | ||
Storage Devices
Our second Lenovo Yoga C930 test unit uses the same 256 GB SK Hynix SSD as our first unit and performance is about the same according to AS SSD. It's unfortunate that Lenovo is not using the Samsung PM961 from the Yoga 920 as it is the faster drive. It's possible that the 512 GB and 1 TB SKUs of the Yoga C930 could have SSDs from different OEMs like Toshiba or Samsung.
See our table of HDDs and SSDs for more benchmark comparisons.


| Lenovo Yoga C930-13IKB 81C4 SK hynix PC401 HFS256GD9TNG | Dell XPS 13 9370 i7 UHD Toshiba XG5 KXG50ZNV512G | Lenovo Yoga 920-13IKB-80Y7 Samsung PM961 MZVLW256HEHP | Lenovo Yoga 910-13IKB-80VF004CGE Samsung PM951 NVMe MZVLV512 | HP Spectre x360 13-ae048ng Toshiba NVMe THNSN51T02DUK | Lenovo Yoga C930-13IKB SK hynix PC401 HFS256GD9TNG | |
|---|---|---|---|---|---|---|
| AS SSD | 29% | 58% | 38% | -48% | 7% | |
| Copy Game MB/s | 533 | 503 -6% | 319.2 -40% | 856 61% | 340 -36% | |
| Copy Program MB/s | 540 | 570 6% | 463.3 -14% | 281.8 -48% | 209.7 -61% | |
| Copy ISO MB/s | 628 | 585 -7% | 1341 114% | 1205 92% | 539 -14% | |
| Score Total | 1394 | 1911 37% | 2536 82% | 1865 34% | 455 -67% | 1373 -2% |
| Score Write | 466 | 596 28% | 608 30% | 611 31% | 42 -91% | 427 -8% |
| Score Read | 628 | 926 47% | 1316 110% | 850 35% | 305 -51% | 657 5% |
| Access Time Write * | 0.51 | 0.055 89% | 0.028 95% | 0.028 95% | 2.391 -369% | 0.056 89% |
| Access Time Read * | 0.46 | 0.059 87% | 0.044 90% | 0.034 93% | 0.044 90% | 0.069 85% |
| 4K-64 Write | 305.1 | 444.8 46% | 391.3 28% | 422.2 38% | 2.09 -99% | 266.3 -13% |
| 4K-64 Read | 466.4 | 678 45% | 1039 123% | 671 44% | 115.6 -75% | 434.3 -7% |
| 4K Write | 106.5 | 107.4 1% | 128.1 20% | 132.9 25% | 1.73 -98% | 95 -11% |
| 4K Read | 39.16 | 29.36 -25% | 48.46 24% | 39.92 2% | 31.73 -19% | 38.04 -3% |
| Seq Write | 544 | 435.8 -20% | 885 63% | 560 3% | 377.1 -31% | 661 22% |
| Seq Read | 1228 | 2205 80% | 2282 86% | 1389 13% | 1574 28% | 1850 51% |
* ... smaller is better

GPU Performance
The integrated UHD Graphics 620 holds no surprises as it is a very common on Ultrabooks. When compared to the average UHD Graphics 620 in our database, the Yoga C930 is about 15 percent faster due to improved Turbo Boost sustainability. In practice, however, the performance gap is hardly noticeable. Discrete Nvidia options like the MX130 or MX150 continue to be out of reach.
See our dedicated page on the UHD Graphics 620 for more technical information and benchmark comparisons.


| 3DMark 11 Performance | 2149 points | |
| 3DMark Cloud Gate Standard Score | 9459 points | |
Help | ||
| low | med. | high | ultra | |
| BioShock Infinite (2013) | 58.6 | 33.8 | 30.3 | 9.6 |
Stress Test
We stress the system with synthetic loads to identify for any potential throttling or stability issues. When subjected to Prime95, we can observe the CPU running at up to 3.7 GHz for the first few seconds before reaching a core temperature of 95 C. Thereafter, clock rate drops and stabilizes at 2.5 GHz for a cooler core temperature of 77 C. Since the base clock rate of the i7-8550U is 1.8 GHz, the Yoga C930 is able to sustain a Turbo Boost of +700 MHz which is impressive for a sub 14-inch convertible. Running both Prime95 and FurMark simultaneously throttles the CPU to just 1.0 GHz.
Running on battery power will not dramatically impact CPU or GPU performance. A 3DMark 11 run on batteries returns Physics and Graphics scores of 7530 and 1810 points, respectively, compared to 7890 and 1911 points when on mains.
Note that the latest version of GPU-Z (2.12.0) is unable to retrieve correct readings of the GPU.


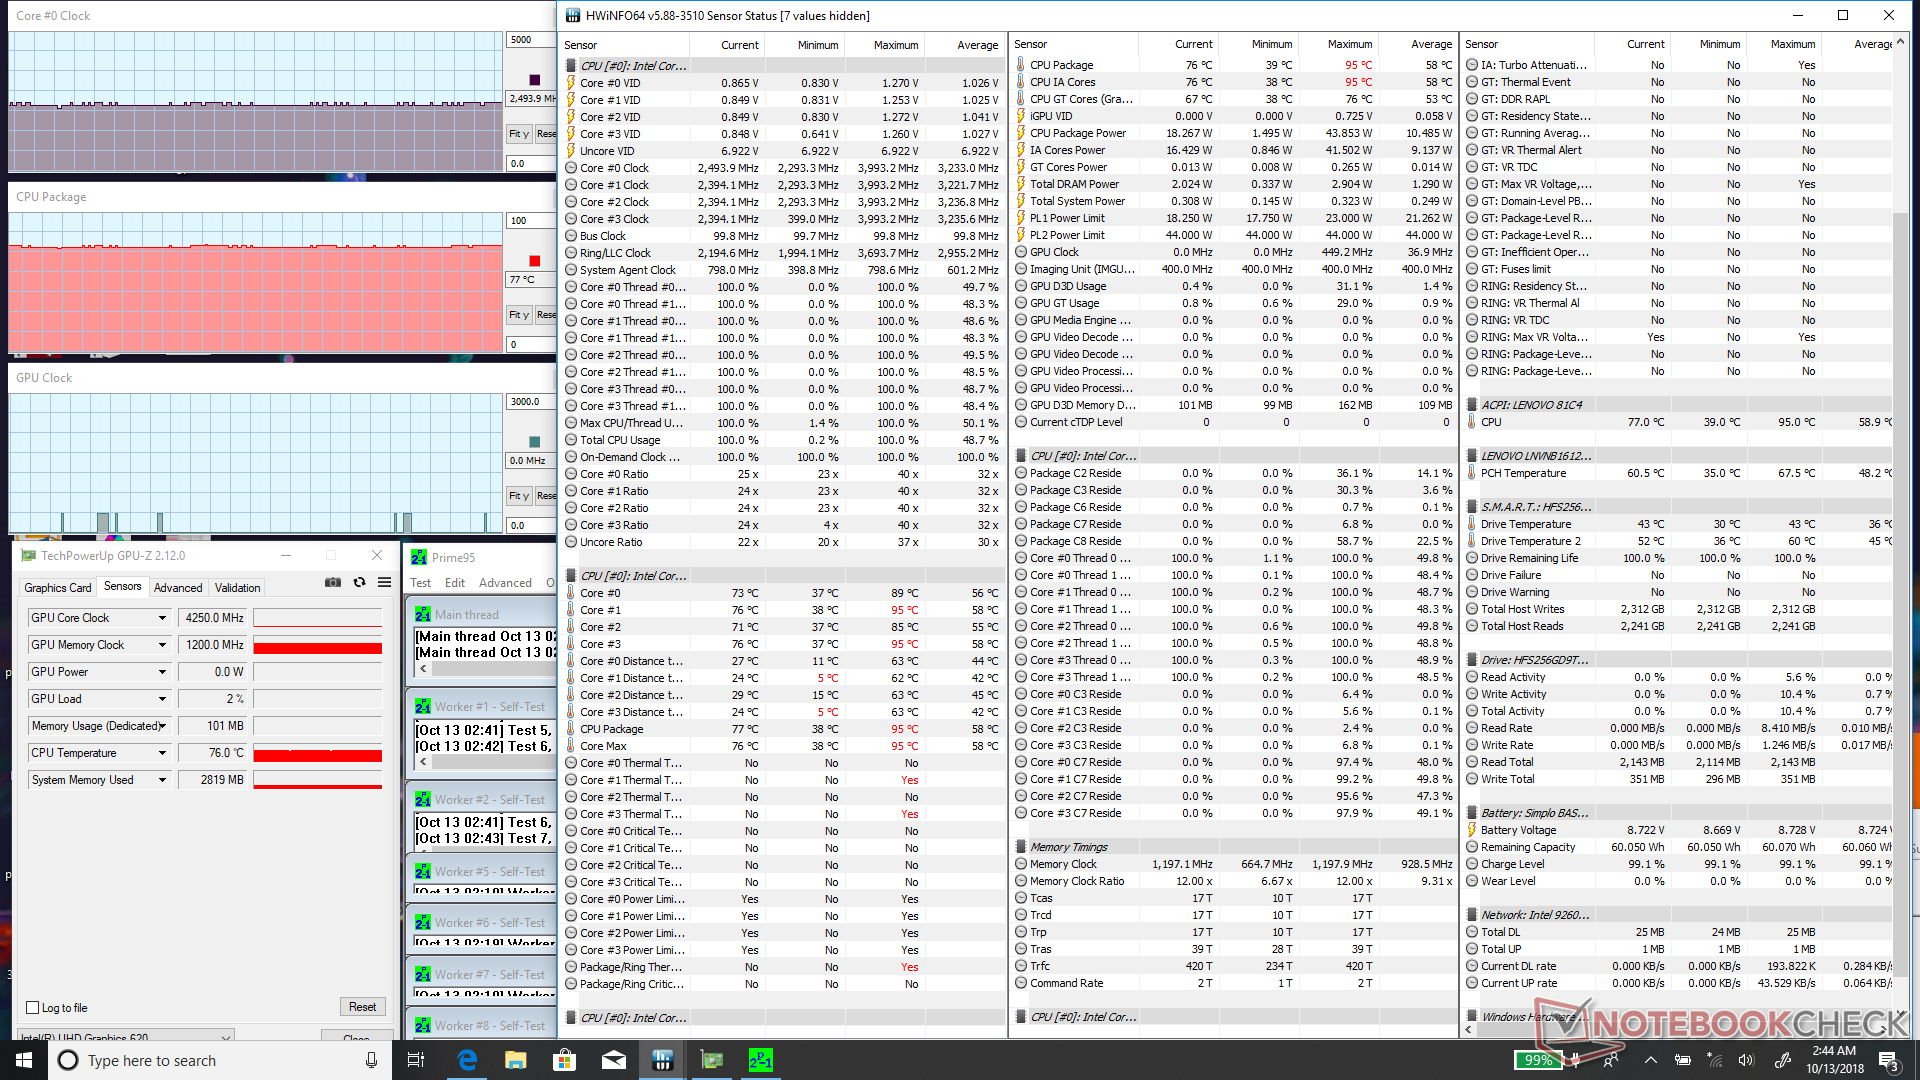

| CPU Clock (GHz) | GPU Clock (MHz) | Average CPU Temperature (°C) | |
| System Idle | -- | -- | 43 |
| Prime95 Stress | 2.5 | -- | 77 |
| Prime95 + FurMark Stress | 1.0 | 798 | 68 |
Emissions
System Noise

Fan noise is similar to the Yoga C930 Core i5 SKU when under low to medium loads. When under extreme load, however, the Core i7 SKU will be significantly louder at almost 40 dB(A) compared to just 33 dB(A) on the slower configuration. The extra horsepower from the Core i7 CPU comes at the cost of louder fan noise when under very high loads.
We can notice no electronic noise or coil whine from our test unit.
Noise Level
| Idle |
| 27.9 / 27.9 / 29.3 dB(A) |
| Load |
| 32 / 39.3 dB(A) |
 | ||
30 dB silent 40 dB(A) audible 50 dB(A) loud |
||
min: | ||
| Lenovo Yoga C930-13IKB 81C4 UHD Graphics 620, i5-8550U, SK hynix PC401 HFS256GD9TNG | Dell XPS 13 9370 i7 UHD UHD Graphics 620, i5-8550U, Toshiba XG5 KXG50ZNV512G | Lenovo Yoga 920-13IKB-80Y7 UHD Graphics 620, i5-8550U, Samsung PM961 MZVLW256HEHP | Asus VivoBook Flip 14 TP412UA-DB51T UHD Graphics 620, i5-8250U, Micron 1100 MTFDDAV256TBN | HP Spectre x360 13-ae048ng UHD Graphics 620, i5-8550U, Toshiba NVMe THNSN51T02DUK | Acer Spin 3 SP314-51-548L UHD Graphics 620, i5-8250U, Micron 1100 MTFDDAV256TBN | Lenovo Yoga C930-13IKB UHD Graphics 620, i5-8250U, SK hynix PC401 HFS256GD9TNG | |
|---|---|---|---|---|---|---|---|
| Noise | -1% | -0% | -2% | -3% | -10% | 0% | |
| off / environment * | 27.9 | 28 -0% | 28 -0% | 28.4 -2% | 30.13 -8% | 30 -8% | 29.3 -5% |
| Idle Minimum * | 27.9 | 28 -0% | 28 -0% | 28.4 -2% | 30.13 -8% | 30 -8% | 29.3 -5% |
| Idle Average * | 27.9 | 28 -0% | 28.8 -3% | 28.4 -2% | 30 -8% | 30 -8% | 29.3 -5% |
| Idle Maximum * | 29.3 | 28 4% | 30.3 -3% | 28.4 3% | 30.13 -3% | 30 -2% | 29.7 -1% |
| Load Average * | 32 | 32.5 -2% | 34.5 -8% | 35.7 -12% | 33.4 -4% | 38.5 -20% | 31.8 1% |
| Load Maximum * | 39.3 | 42.2 -7% | 34.3 13% | 39 1% | 33 16% | 44 -12% | 32.7 17% |
* ... smaller is better
Temperature
Surface temperatures are warmest towards the center of the keyboard in a roughly symmetrical gradient. Palm rests remain relatively cool at all times no matter the load, but some keyboard keys can be over 40 C when under very high loads. Overall results are quite similar to the last generation Yoga 920.
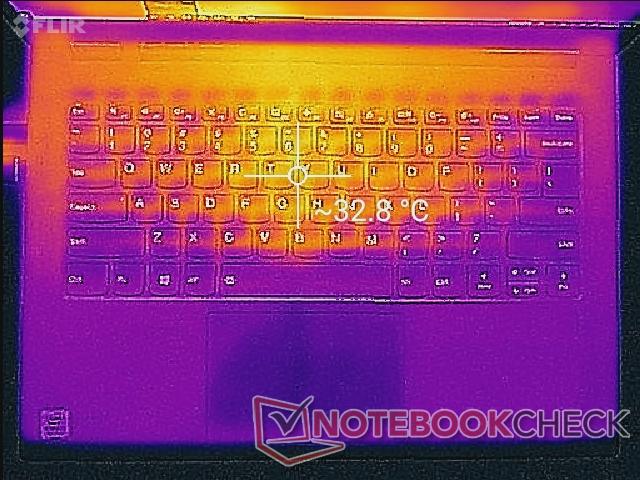


(-) The maximum temperature on the upper side is 45.4 °C / 114 F, compared to the average of 35.3 °C / 96 F, ranging from 19.6 to 55.7 °C for the class Convertible.
(±) The bottom heats up to a maximum of 44.2 °C / 112 F, compared to the average of 36.7 °C / 98 F
(+) In idle usage, the average temperature for the upper side is 29.3 °C / 85 F, compared to the device average of 30.2 °C / 86 F.
(+) The palmrests and touchpad are reaching skin temperature as a maximum (33.2 °C / 91.8 F) and are therefore not hot.
(-) The average temperature of the palmrest area of similar devices was 28.1 °C / 82.6 F (-5.1 °C / -9.2 F).
Speakers

Energy Management
Power Consumption
Power consumption is slightly higher than on the Core i5 SKU likely due to the faster performance and louder fans of the Core i7 SKU. Power demand when under load is also much higher than on the Yoga 920 because of the reduction in CPU throttling.
The small (~10.9 x 4.9 x 3 cm) 65 W AC adapter is sufficient for the notebook since it is unable to sustain maximum Turbo Boost anyway. The adapter can be used to fast charge smartphones with USB Type-C as well.

| Off / Standby | |
| Idle | |
| Load |
|
| Lenovo Yoga C930-13IKB 81C4 i5-8550U, UHD Graphics 620, SK hynix PC401 HFS256GD9TNG, IPS, 1920x1080, 13.90 | Dell XPS 13 9370 i7 UHD i5-8550U, UHD Graphics 620, Toshiba XG5 KXG50ZNV512G, IPS, 3840x2160, 13.30 | Lenovo Yoga 920-13IKB-80Y7 i5-8550U, UHD Graphics 620, Samsung PM961 MZVLW256HEHP, IPS, 1920x1080, 13.90 | Asus VivoBook Flip 14 TP412UA-DB51T i5-8250U, UHD Graphics 620, Micron 1100 MTFDDAV256TBN, IPS, 1920x1080, 14.00 | HP Spectre x360 13-ae048ng i5-8550U, UHD Graphics 620, Toshiba NVMe THNSN51T02DUK, IPS, 1920x1080, 13.30 | Acer Spin 3 SP314-51-548L i5-8250U, UHD Graphics 620, Micron 1100 MTFDDAV256TBN, IPS, 1920x1080, 14.00 | Lenovo Yoga C930-13IKB i5-8250U, UHD Graphics 620, SK hynix PC401 HFS256GD9TNG, IPS, 1920x1080, 13.90 | |
|---|---|---|---|---|---|---|---|
| Power Consumption | -1% | 27% | 32% | 26% | 38% | 11% | |
| Idle Minimum * | 3.4 | 5 -47% | 3.1 9% | 3.3 3% | 3.2 6% | 2.9 15% | 3.3 3% |
| Idle Average * | 7.5 | 8.3 -11% | 6.6 12% | 5.2 31% | 6 20% | 5.2 31% | 6.8 9% |
| Idle Maximum * | 11.8 | 8.8 25% | 7 41% | 5.6 53% | 9.2 22% | 5.4 54% | 9.5 19% |
| Load Average * | 47.7 | 46.4 3% | 35.2 26% | 32.9 31% | 29.5 38% | 29.4 38% | 40.8 14% |
| Load Maximum * | 63.2 | 48.6 23% | 34.6 45% | 35.2 44% | 35.6 44% | 29.6 53% | 57 10% |
* ... smaller is better
Battery Life
Expect a real-world runtime of 11 hours to be comparable to the last generation Yoga 920 if not slightly shorter. Battery capacity has actually decreased from 70 Wh to 60 Wh despite the added thickness.
| Lenovo Yoga C930-13IKB 81C4 i5-8550U, UHD Graphics 620, 60 Wh | Dell XPS 13 9370 i7 UHD i5-8550U, UHD Graphics 620, 52 Wh | Lenovo Yoga 920-13IKB-80Y7 i5-8550U, UHD Graphics 620, 70 Wh | Lenovo Yoga 910-13IKB-80VF004CGE i7-7500U, HD Graphics 620, 78 Wh | Asus VivoBook Flip 14 TP412UA-DB51T i5-8250U, UHD Graphics 620, 42 Wh | HP Spectre x360 13-ae048ng i5-8550U, UHD Graphics 620, 60 Wh | Acer Spin 3 SP314-51-548L i5-8250U, UHD Graphics 620, 52.5 Wh | Lenovo Yoga C930-13IKB i5-8250U, UHD Graphics 620, 60 Wh | |
|---|---|---|---|---|---|---|---|---|
| Battery Runtime | -30% | 3% | -3% | -13% | -21% | -25% | -17% | |
| WiFi v1.3 | 664 | 465 -30% | 685 3% | 644 -3% | 578 -13% | 527 -21% | 496 -25% | 550 -17% |
| Reader / Idle | 819 | 1655 | 1069 | 1432 | ||||
| Load | 109 | 140 | 174 | 166 | 124 |
Pros
Cons
Verdict
How much faster is the Yoga C930 Core i7 SKU compared to the Core i5 SKU? Expect a 20 percent increase in raw CPU power at most when both systems are under heavy stress. The Core i7 SKU is better at maintaining faster Turbo Boost clock rates for longer without necessarily impacting battery life for day-to-day tasks like browsing, streaming, or word processing. Users who know they can take advantage of the added horsepower will benefit the most from the pricier configuration.
For everyone else, the performance delta between the Core i5 and Core i7 SKUs is unnoticeable. The Core i5-8250U is more than sufficient for browsing, streaming, and multi-tasking loads. Instead, the weakest aspect of the Yoga C930 is its graphics as the series continues to lack dedicated Nvidia or even Iris options. Owners will be more likely to notice the laptop's limited graphics performance for image or video editing than the comparatively minimal differences between the Core i5 and Core i7.
The Yoga C930 is inching closer to being a consumer-business hybrid convertible with its portable design and unarguably useful active stylus. Basic office or home entertainment tasks will run just as flawlessly on the Core i5 SKU when compared to the Core i7. Users who may want more graphics horsepower, however, should consider the MateBook X Pro, MSI PS42, or the XPS 13 with Iris graphics.
Lenovo Yoga C930-13IKB 81C4
-
10/17/2019 v7
Allen Ngo
Pricecompare
