Deutsch
 English
 Español
 Français
 Italiano
 Nederlands
 Polski
 Português
 Русский
 Türkçe
 Svenska
 Chinese
 Magyar
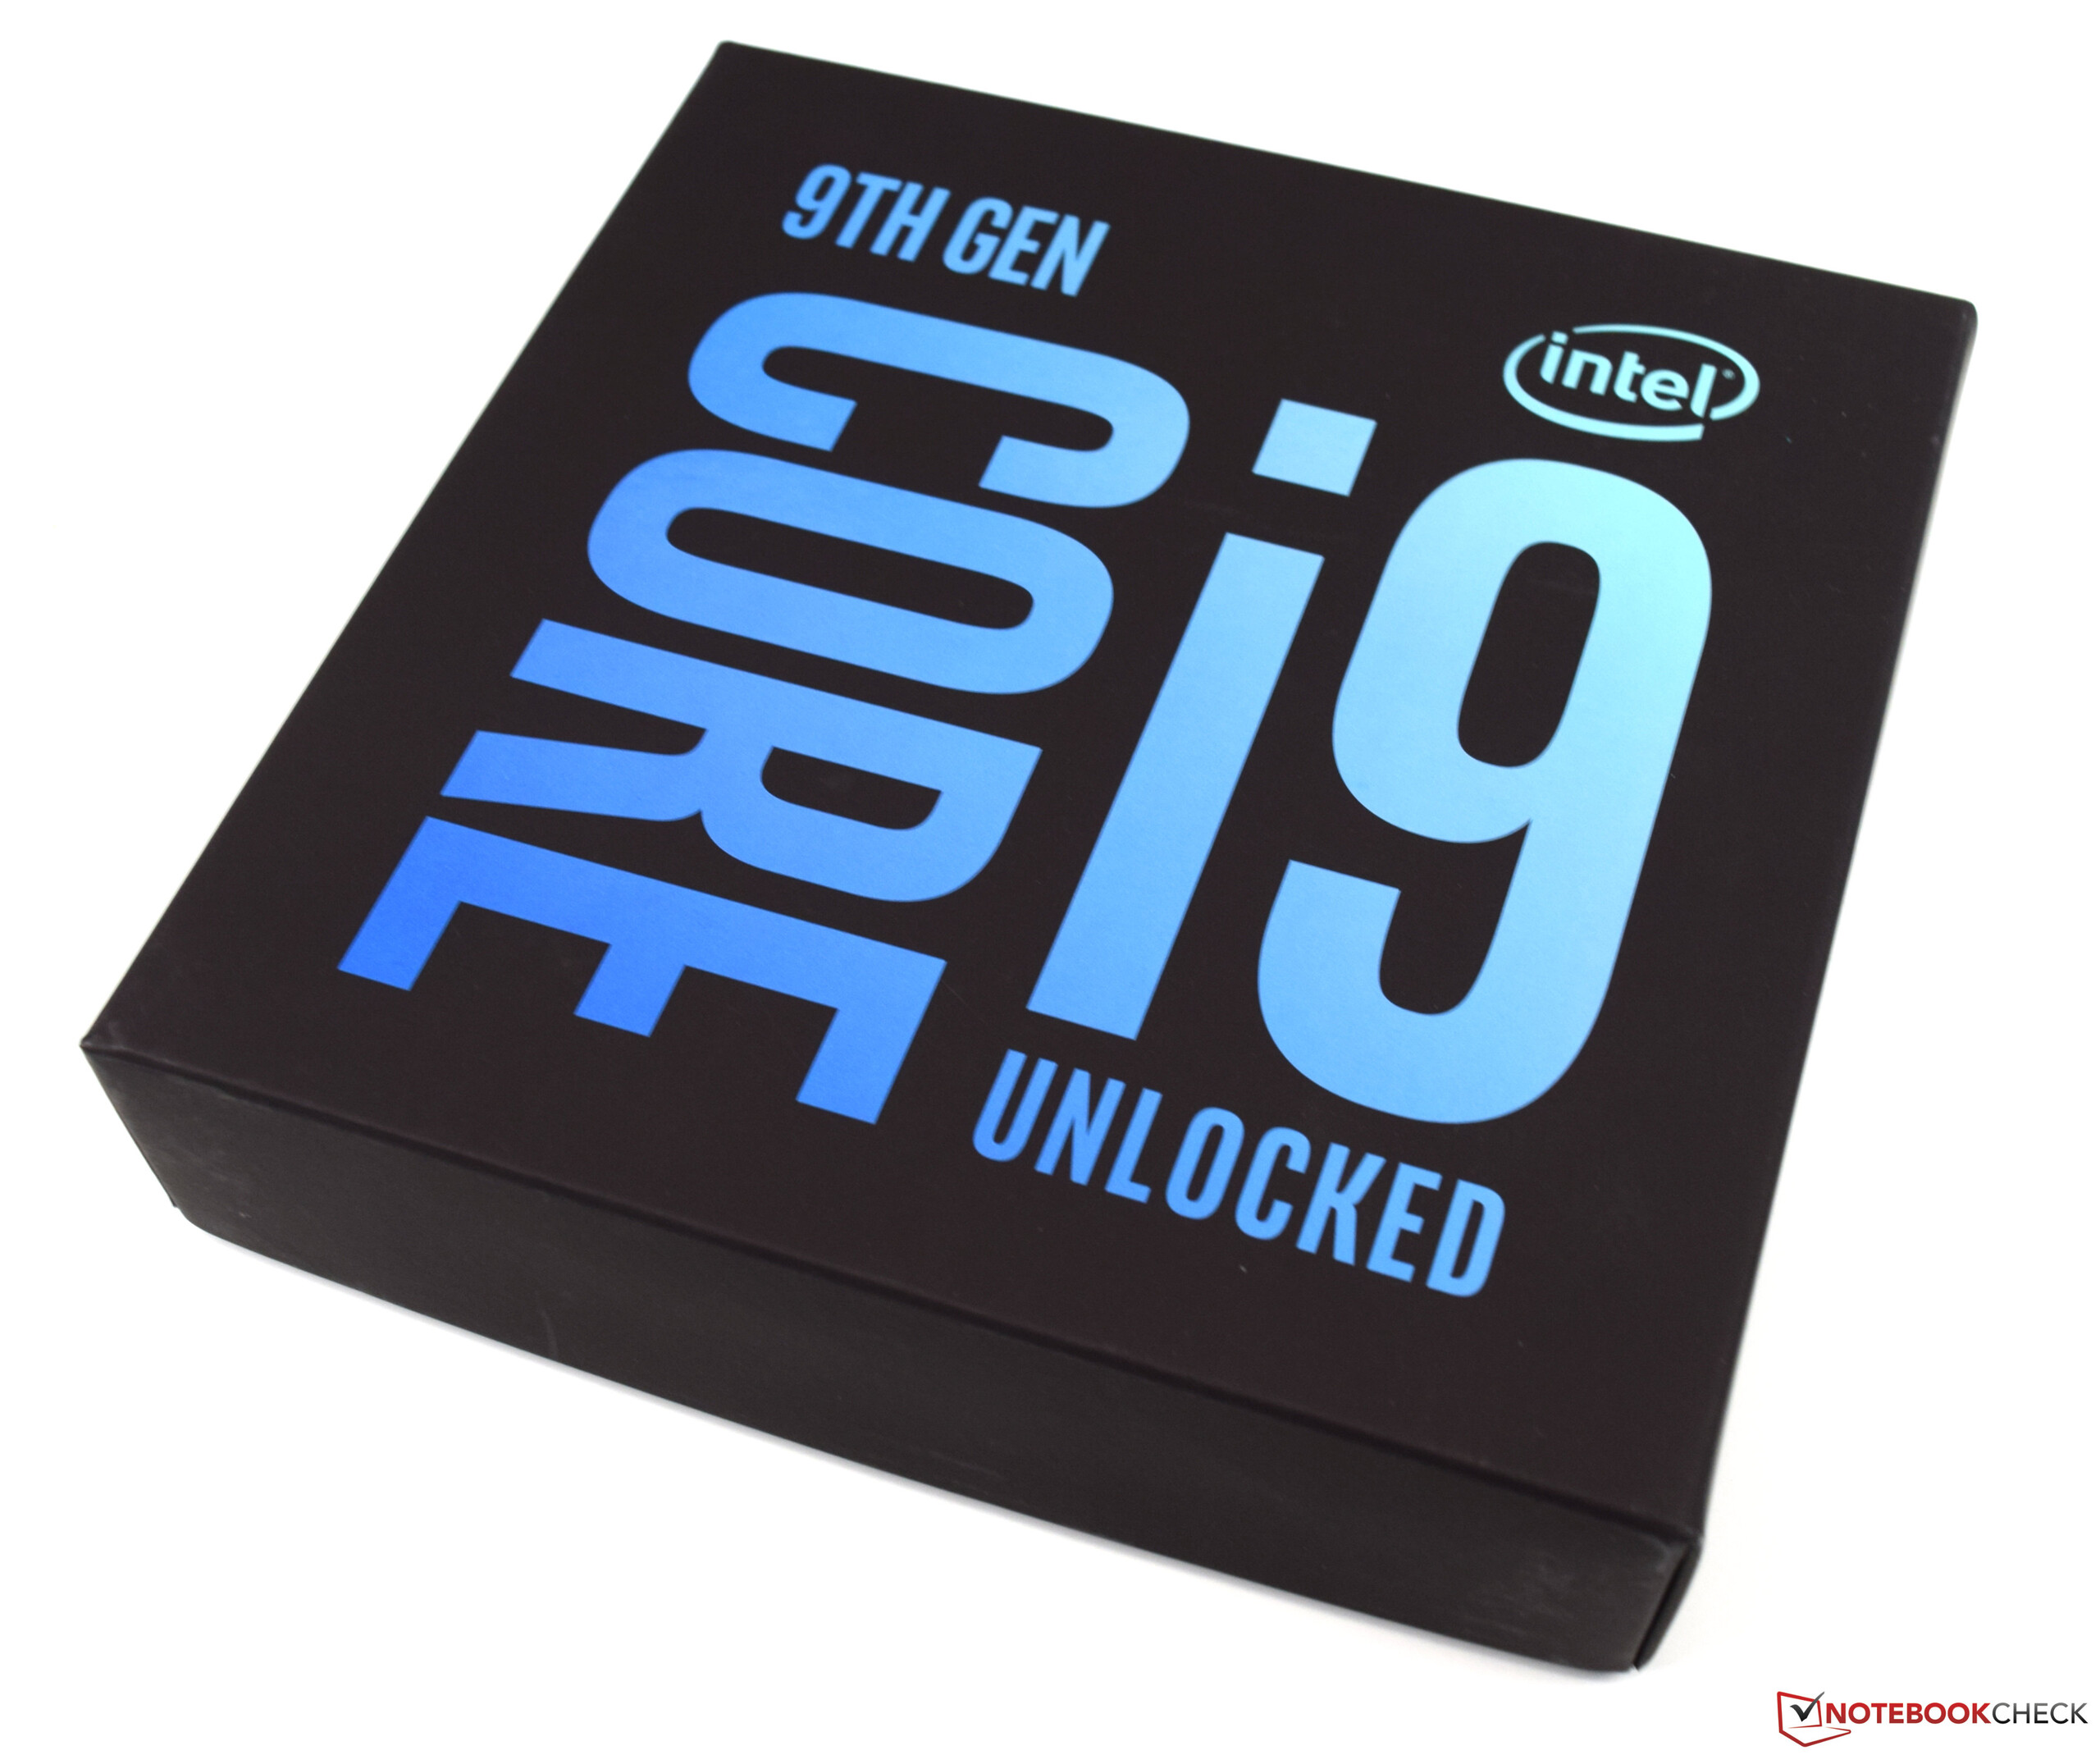
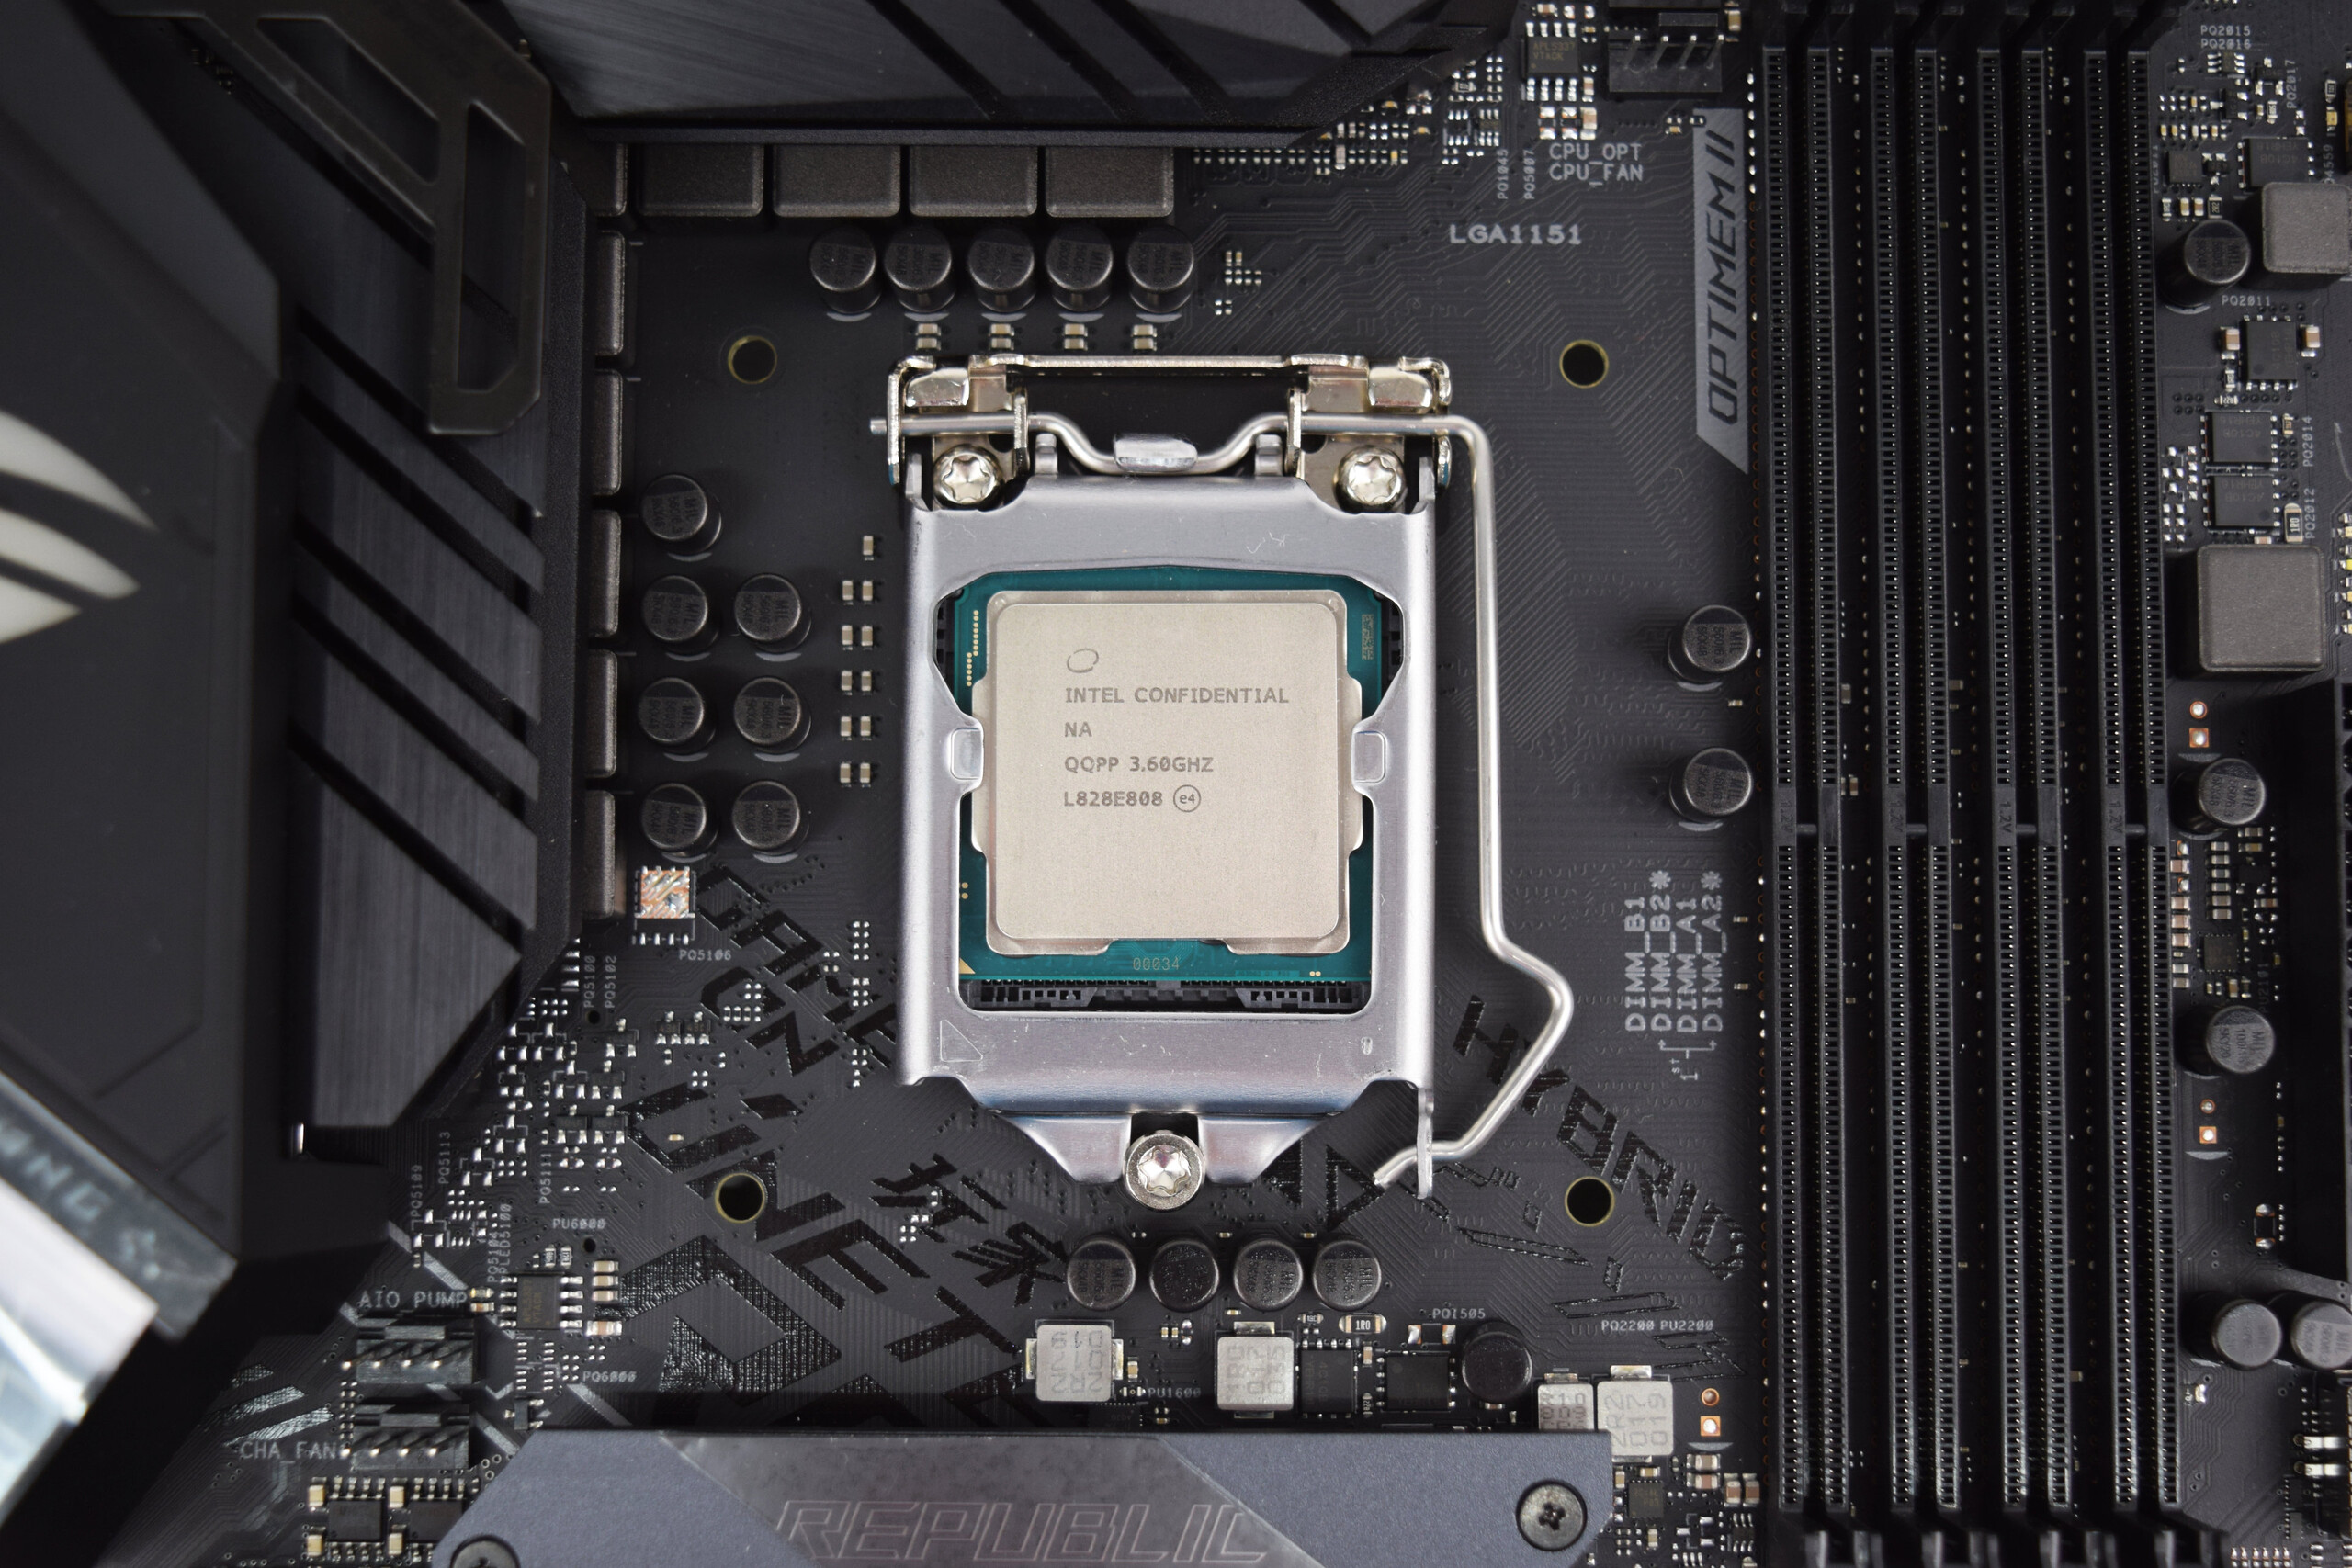
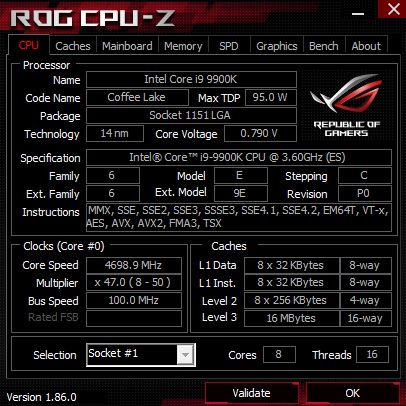
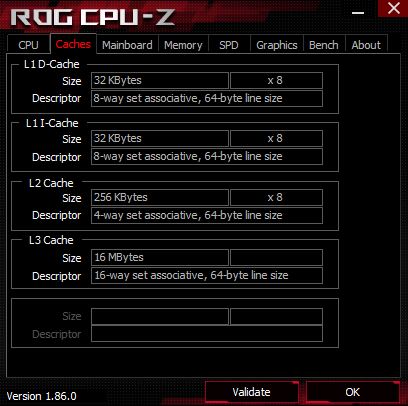
Intel Core i9-9900K (8 cores, 16 threads, 3.6 GHz) Desktop CPU Review
The Core i9-9900K clocks up to 5 GHz
Intel has focussed on gamers for the introduction of its 9th generation Core Desktop processors. AMD’s resurgence has disrupted Intel’s dominance in the recent years, particularly with the release of the octa-core Ryzen 7 2700X earlier this year.
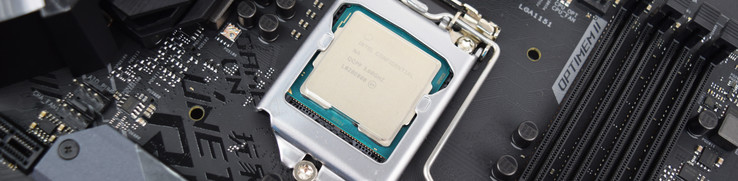
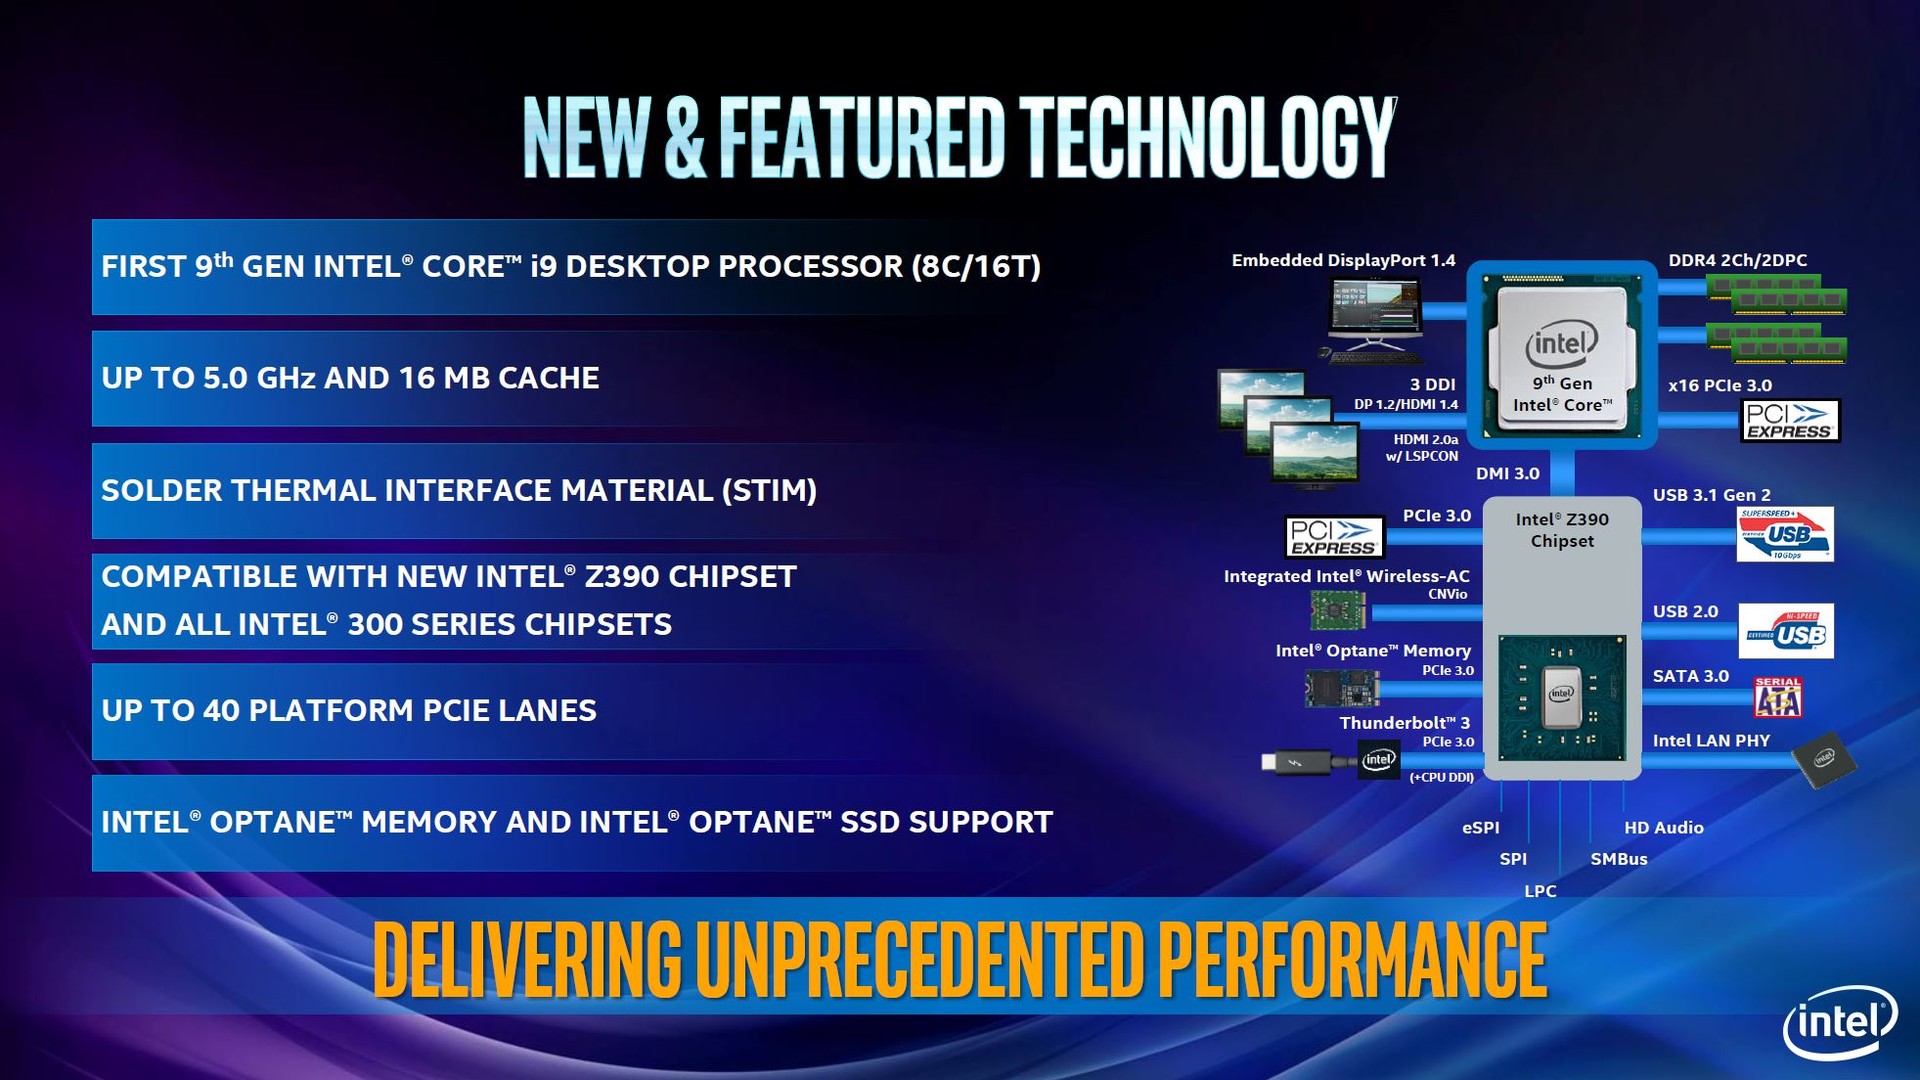
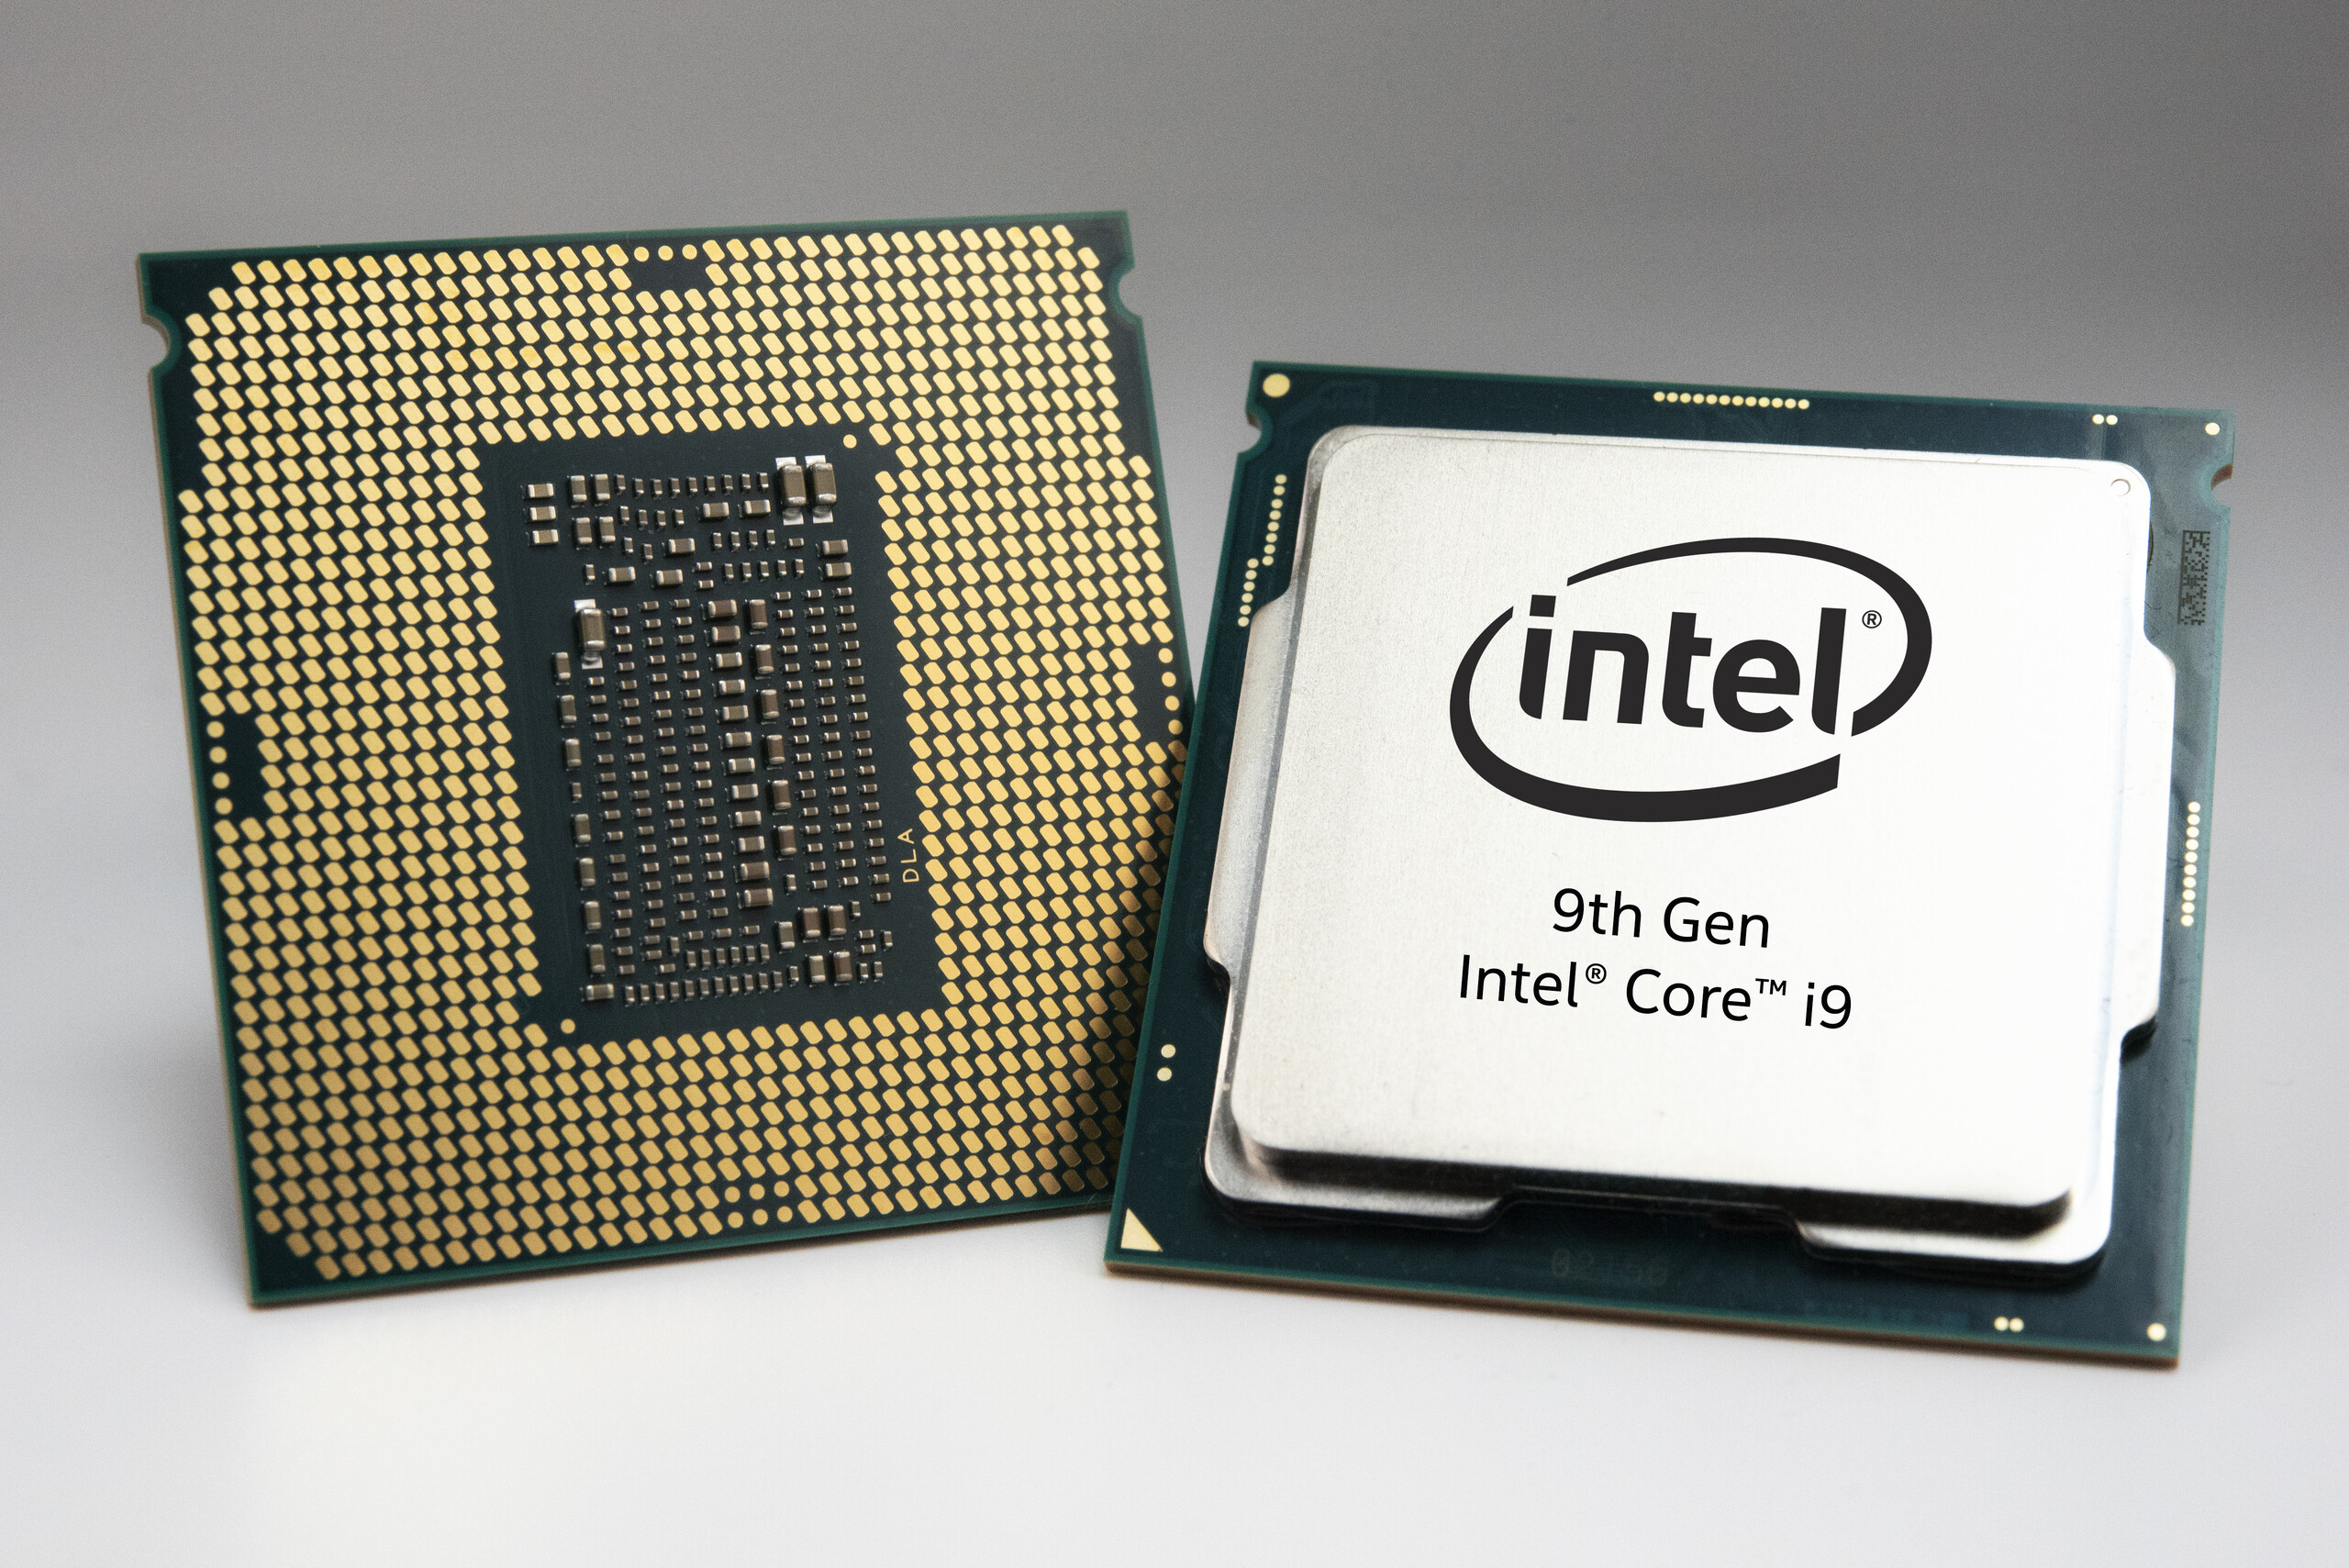
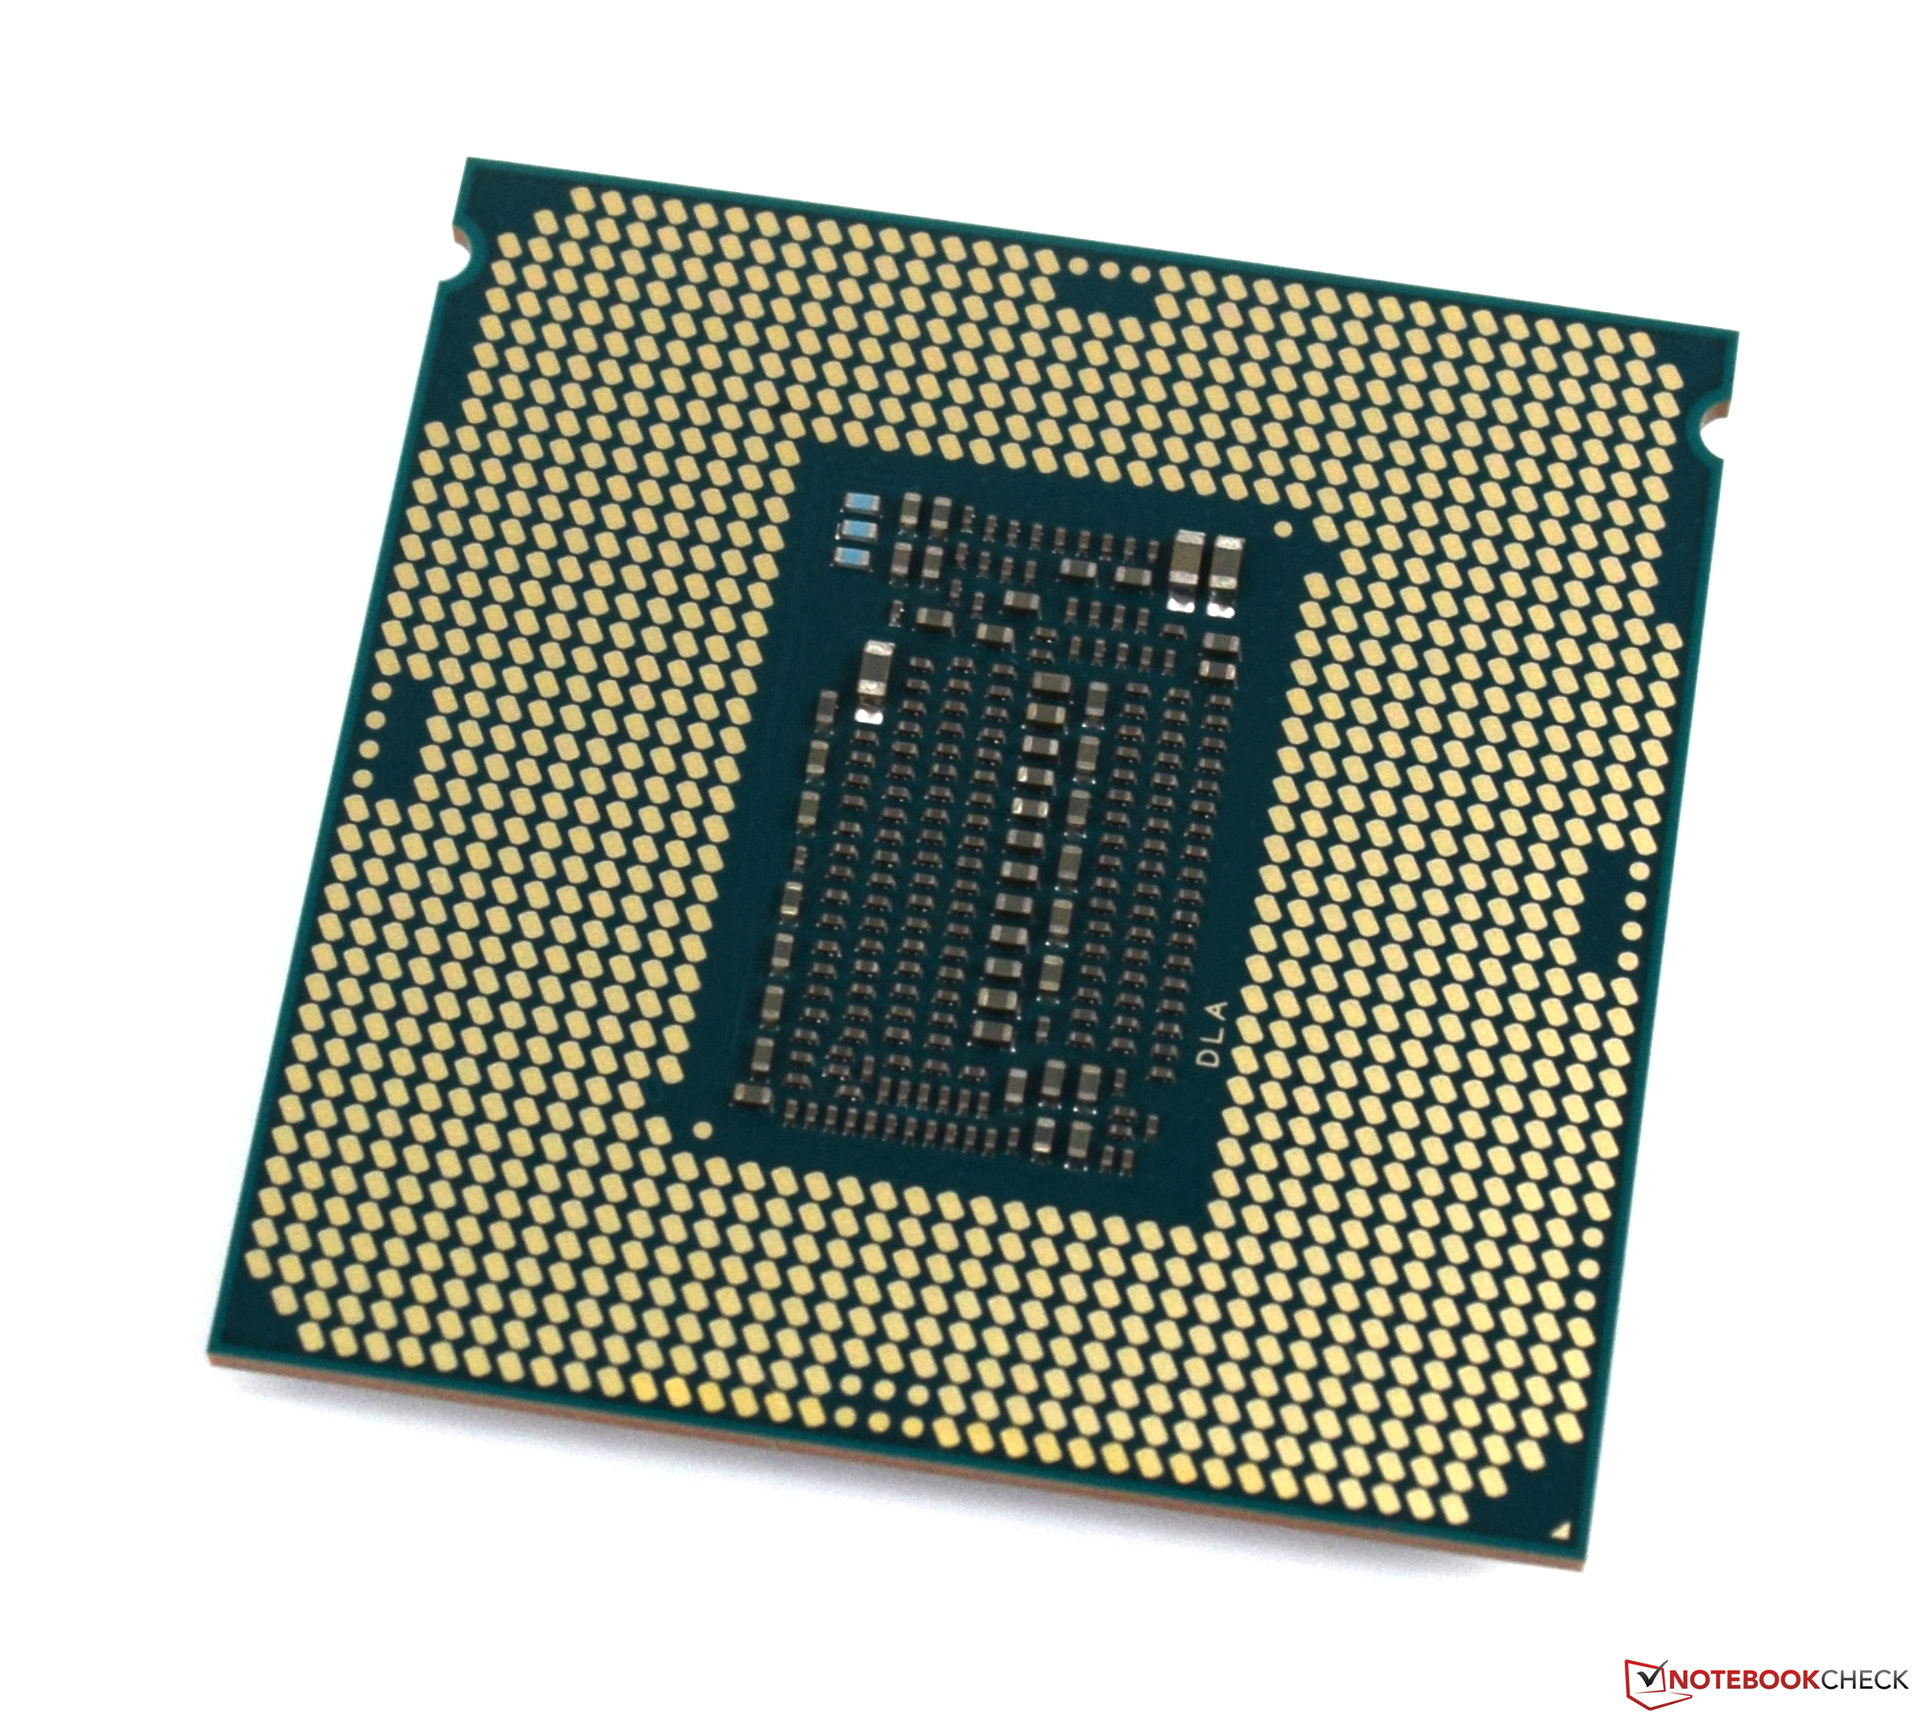
Intel initially countered the Ryzen 7 2700X with the hexa-core Core i7-8700K, but its fewer cores meant that it performed worse in multi-threaded applications. The release of the octa-core Core i9-9900K seeks to address this performance gap and Intel has done more than just increasing the chip’s core count. The company have manufacturered the Core i9-9900K on its new 14 nm ++ FinFET process and has soldered a heat spreader to the chip to dissipate the heat more efficiently and quickly than previous processors could. The Core i9-9900K can also achieve up to a 95-W thermal design power (TDP) according to Intel, although this remains a theoretical value.
Intel has released the Core i9-9900K alongside the Core i7-9700K and the Core i5-9600K, all of which have unlocked multipliers and support manual overclocking with the corresponding motherboard. Your successes at overclocking any of Intel’s new CPUs will differ from what we have achieved though as each CPU is different. The quality of CPUs varies so much that some online shops like Caseking offer pre-selected processors that have good overclocking potential.
All three processors are built on the same die, but Intel has limited its lesser 9th generation chips to create production differentiation. The Core i9-9900K is the only CPU of the three that supports Intel Hyper Threading, for example. In practice, this means that the Core i9-9900K can run up to double the threads in parallel that the octa-core Core i7-9700K can, and ten more than the Core i5-9600K. These differences will be most noticeable in multi-threaded applications, which will perform better with the higher core and thread count.
The 8th and 9th generation Intel Core chips in comparison
| Model | Cores - Threads | Base clock | Turbo on 1/2/4/6/8 Cores | L3-Cache | Graphics | TDP | Launch Price |
|---|---|---|---|---|---|---|---|
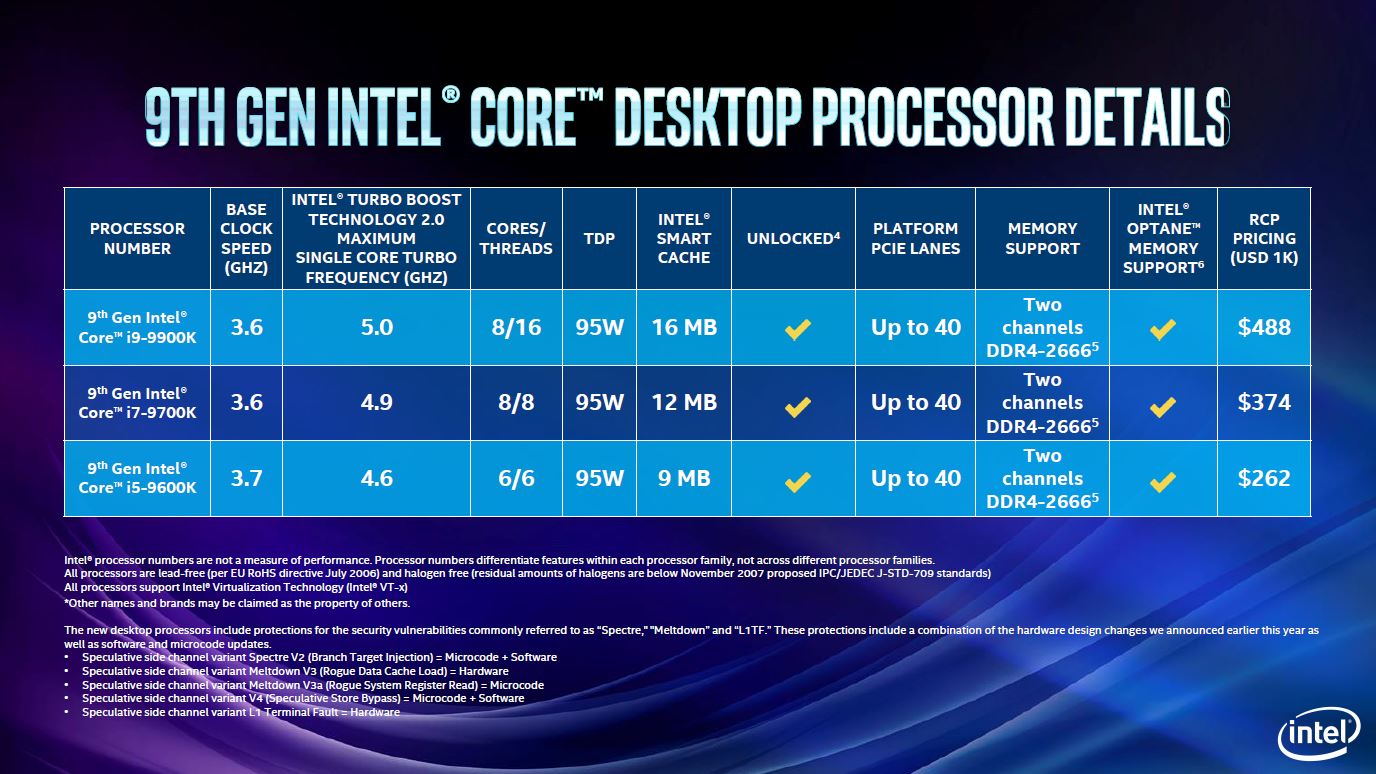
| Intel Core i9-9900K | 8-16 | 3.6 GHz | 5.0/5.0/4.8/4.7/4.7 GHz | 16 MB | UHD 630 | 95 Watt | 488 USD |
| Intel Core i7-9700K | 8-8 | 3.6 GHz | 4.9/4.8/4.7/4.6/4.6 GHz | 12 MB | UHD 630 | 95 Watt | 374 USD |
| Intel Core i5-9600K | 6-6 | 3.7 GHz | 4.6/4.5/4.4/4.3/- GHz | 9 MB | UHD 630 | 95 Watt | 262 USD |
| Intel Core i7-8700K | 6-12 | 3.7 GHz | 4.7/4.6/4.4/4.3/- GHz | 12 MB | UHD 630 | 95 Watt | 359 USD |
| Intel Core i5-8600K | 6-6 | 3.6 GHz | 4.3/4.2/4.2/4.1/- GHz | 9 MB | UHD 630 | 95 Watt | 257 USD |
Pricing & Availability
The new 9th generation Core processors remain pricey primarily because of their limited availability. Intel lists the Core i9-9900K’s recommended consumer pricing at between $488-$499 before taxes, but prices are currently considerably more inflated. We found the processor online for around €670 (~£586/$763) at the time of writing, but this is back-ordered pricing because of low availability. The only suppliers that had inventory in stock currently sell the Core i9-9900K for closer to €1,000 (~£875/$1,140).
The Core i7-9700K and Core i5-9600K are easier to come by and are accordingly cheaper. We would recommend buying the cheaper 9th generation Core processors if you plan on building or upgrading an Intel system, the Core i9-9900K is simply too expensive at the moment for us to recommend buying it.
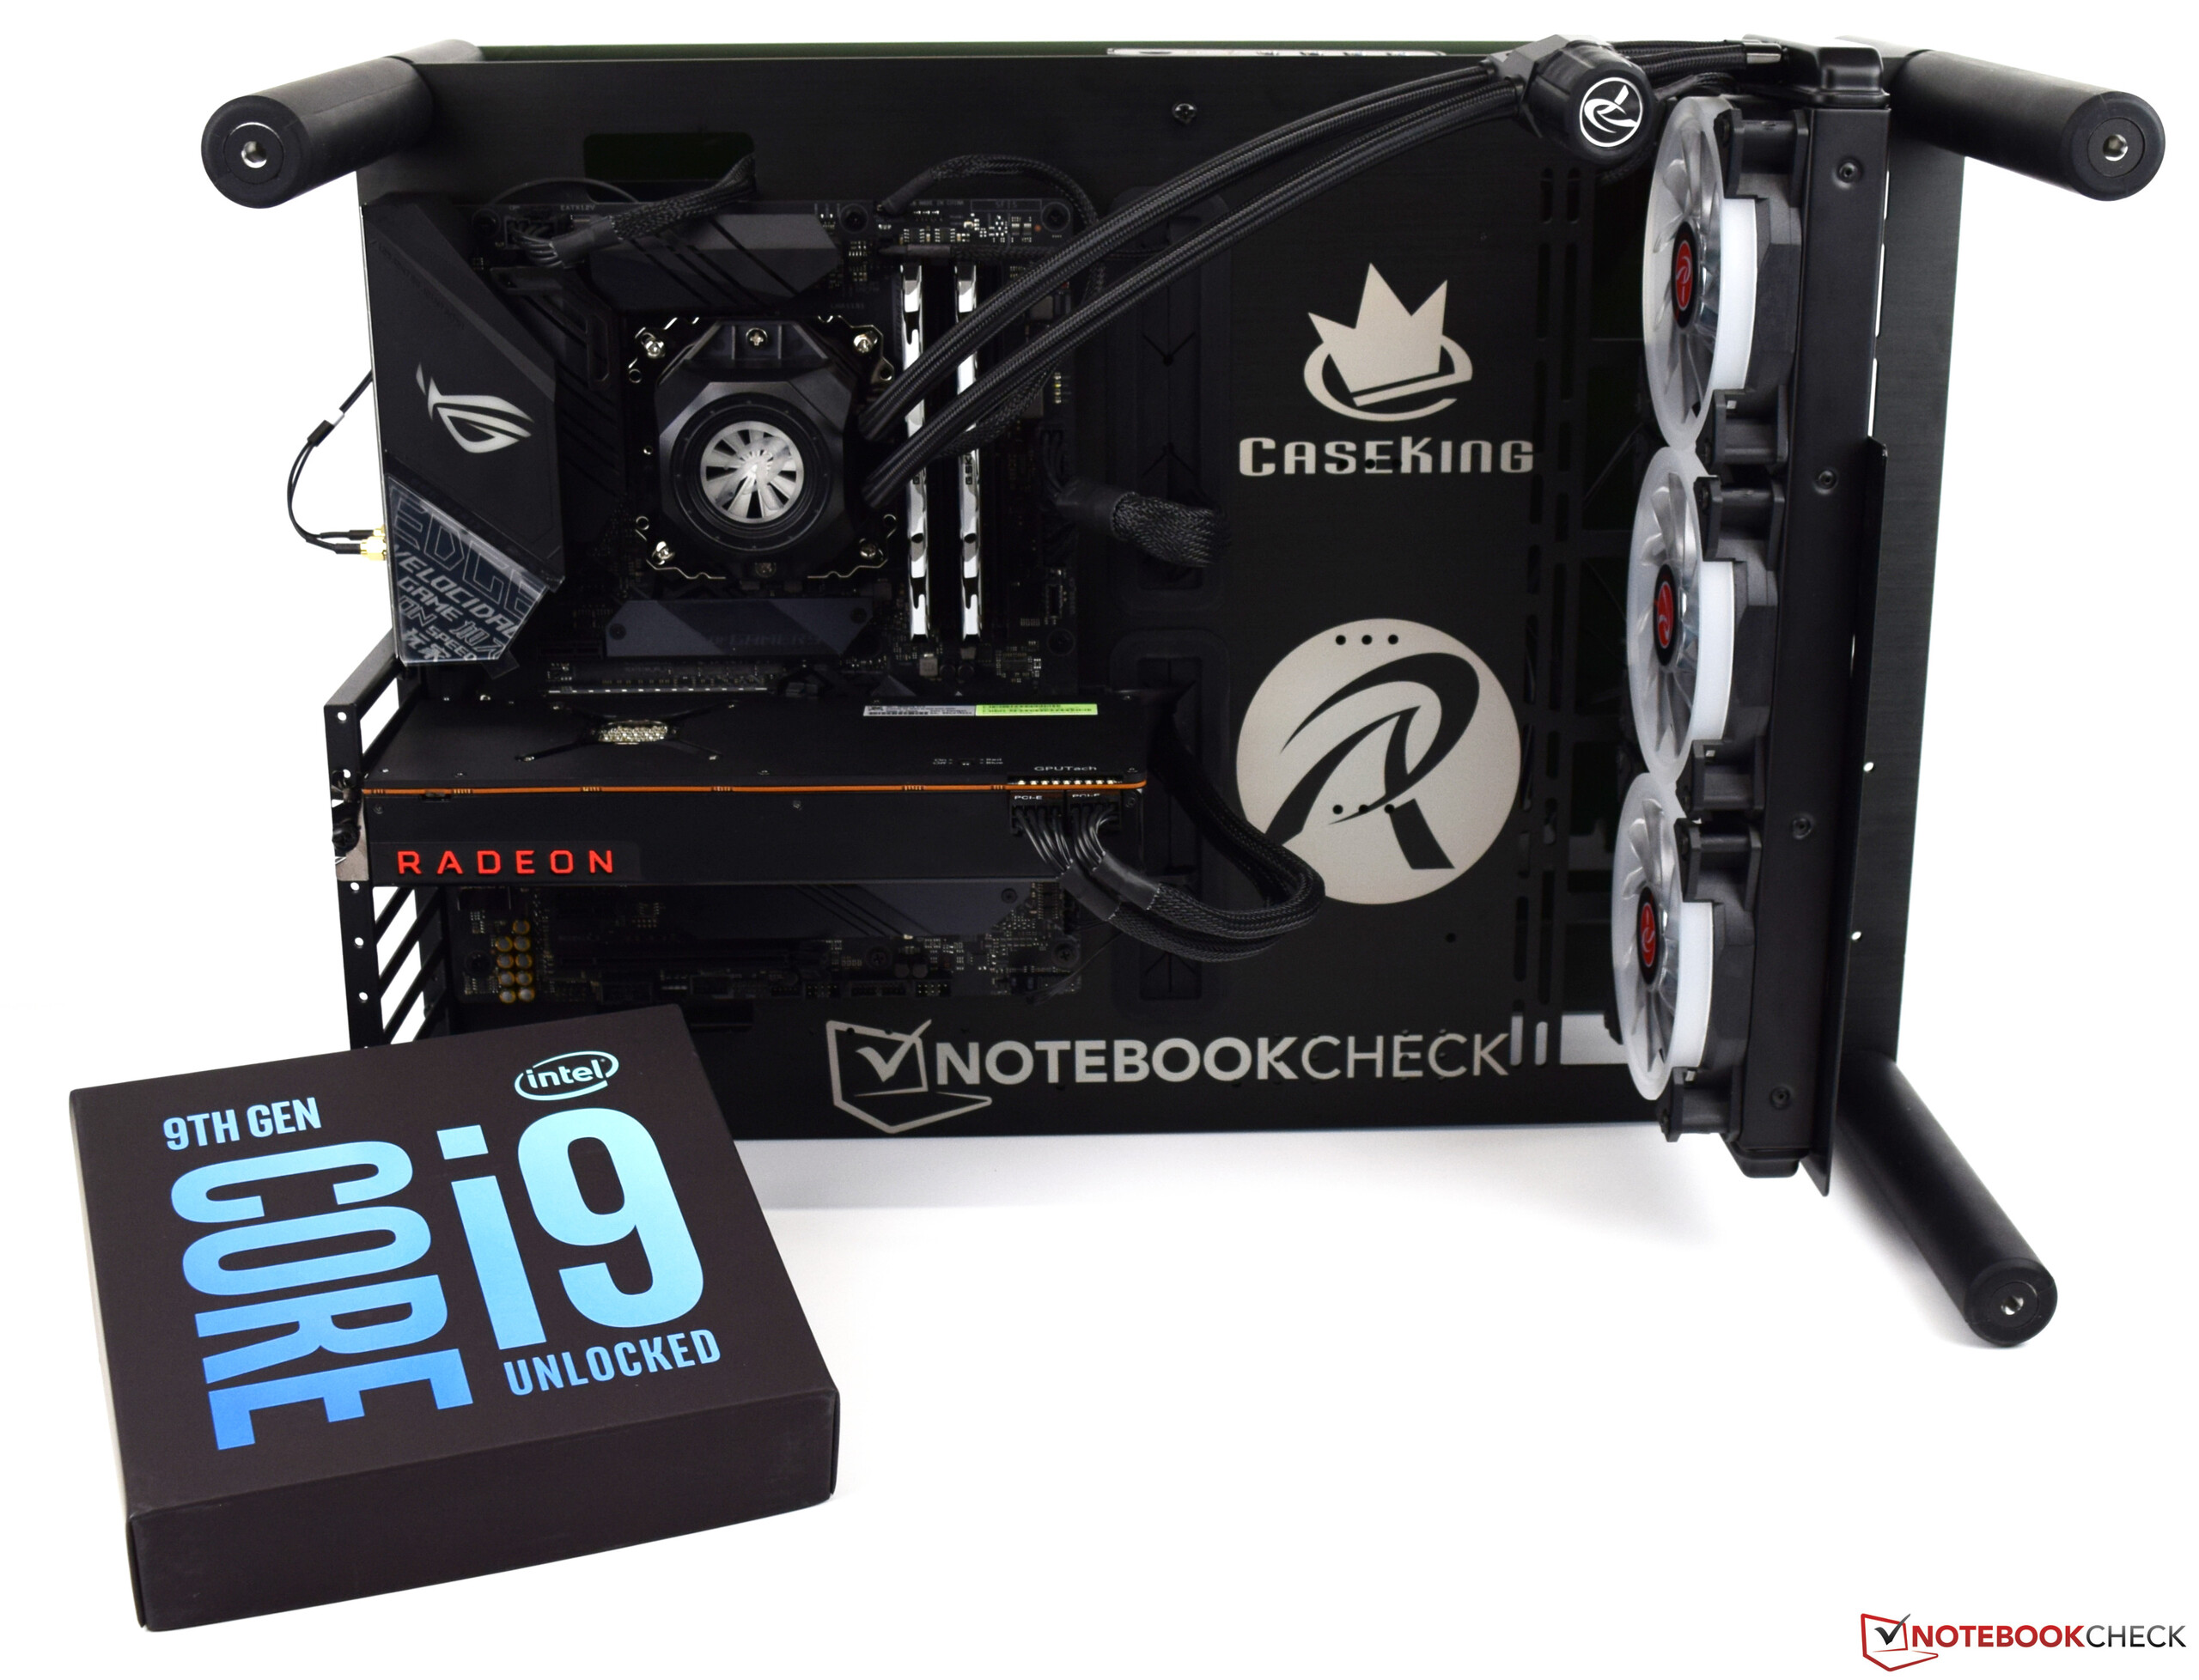
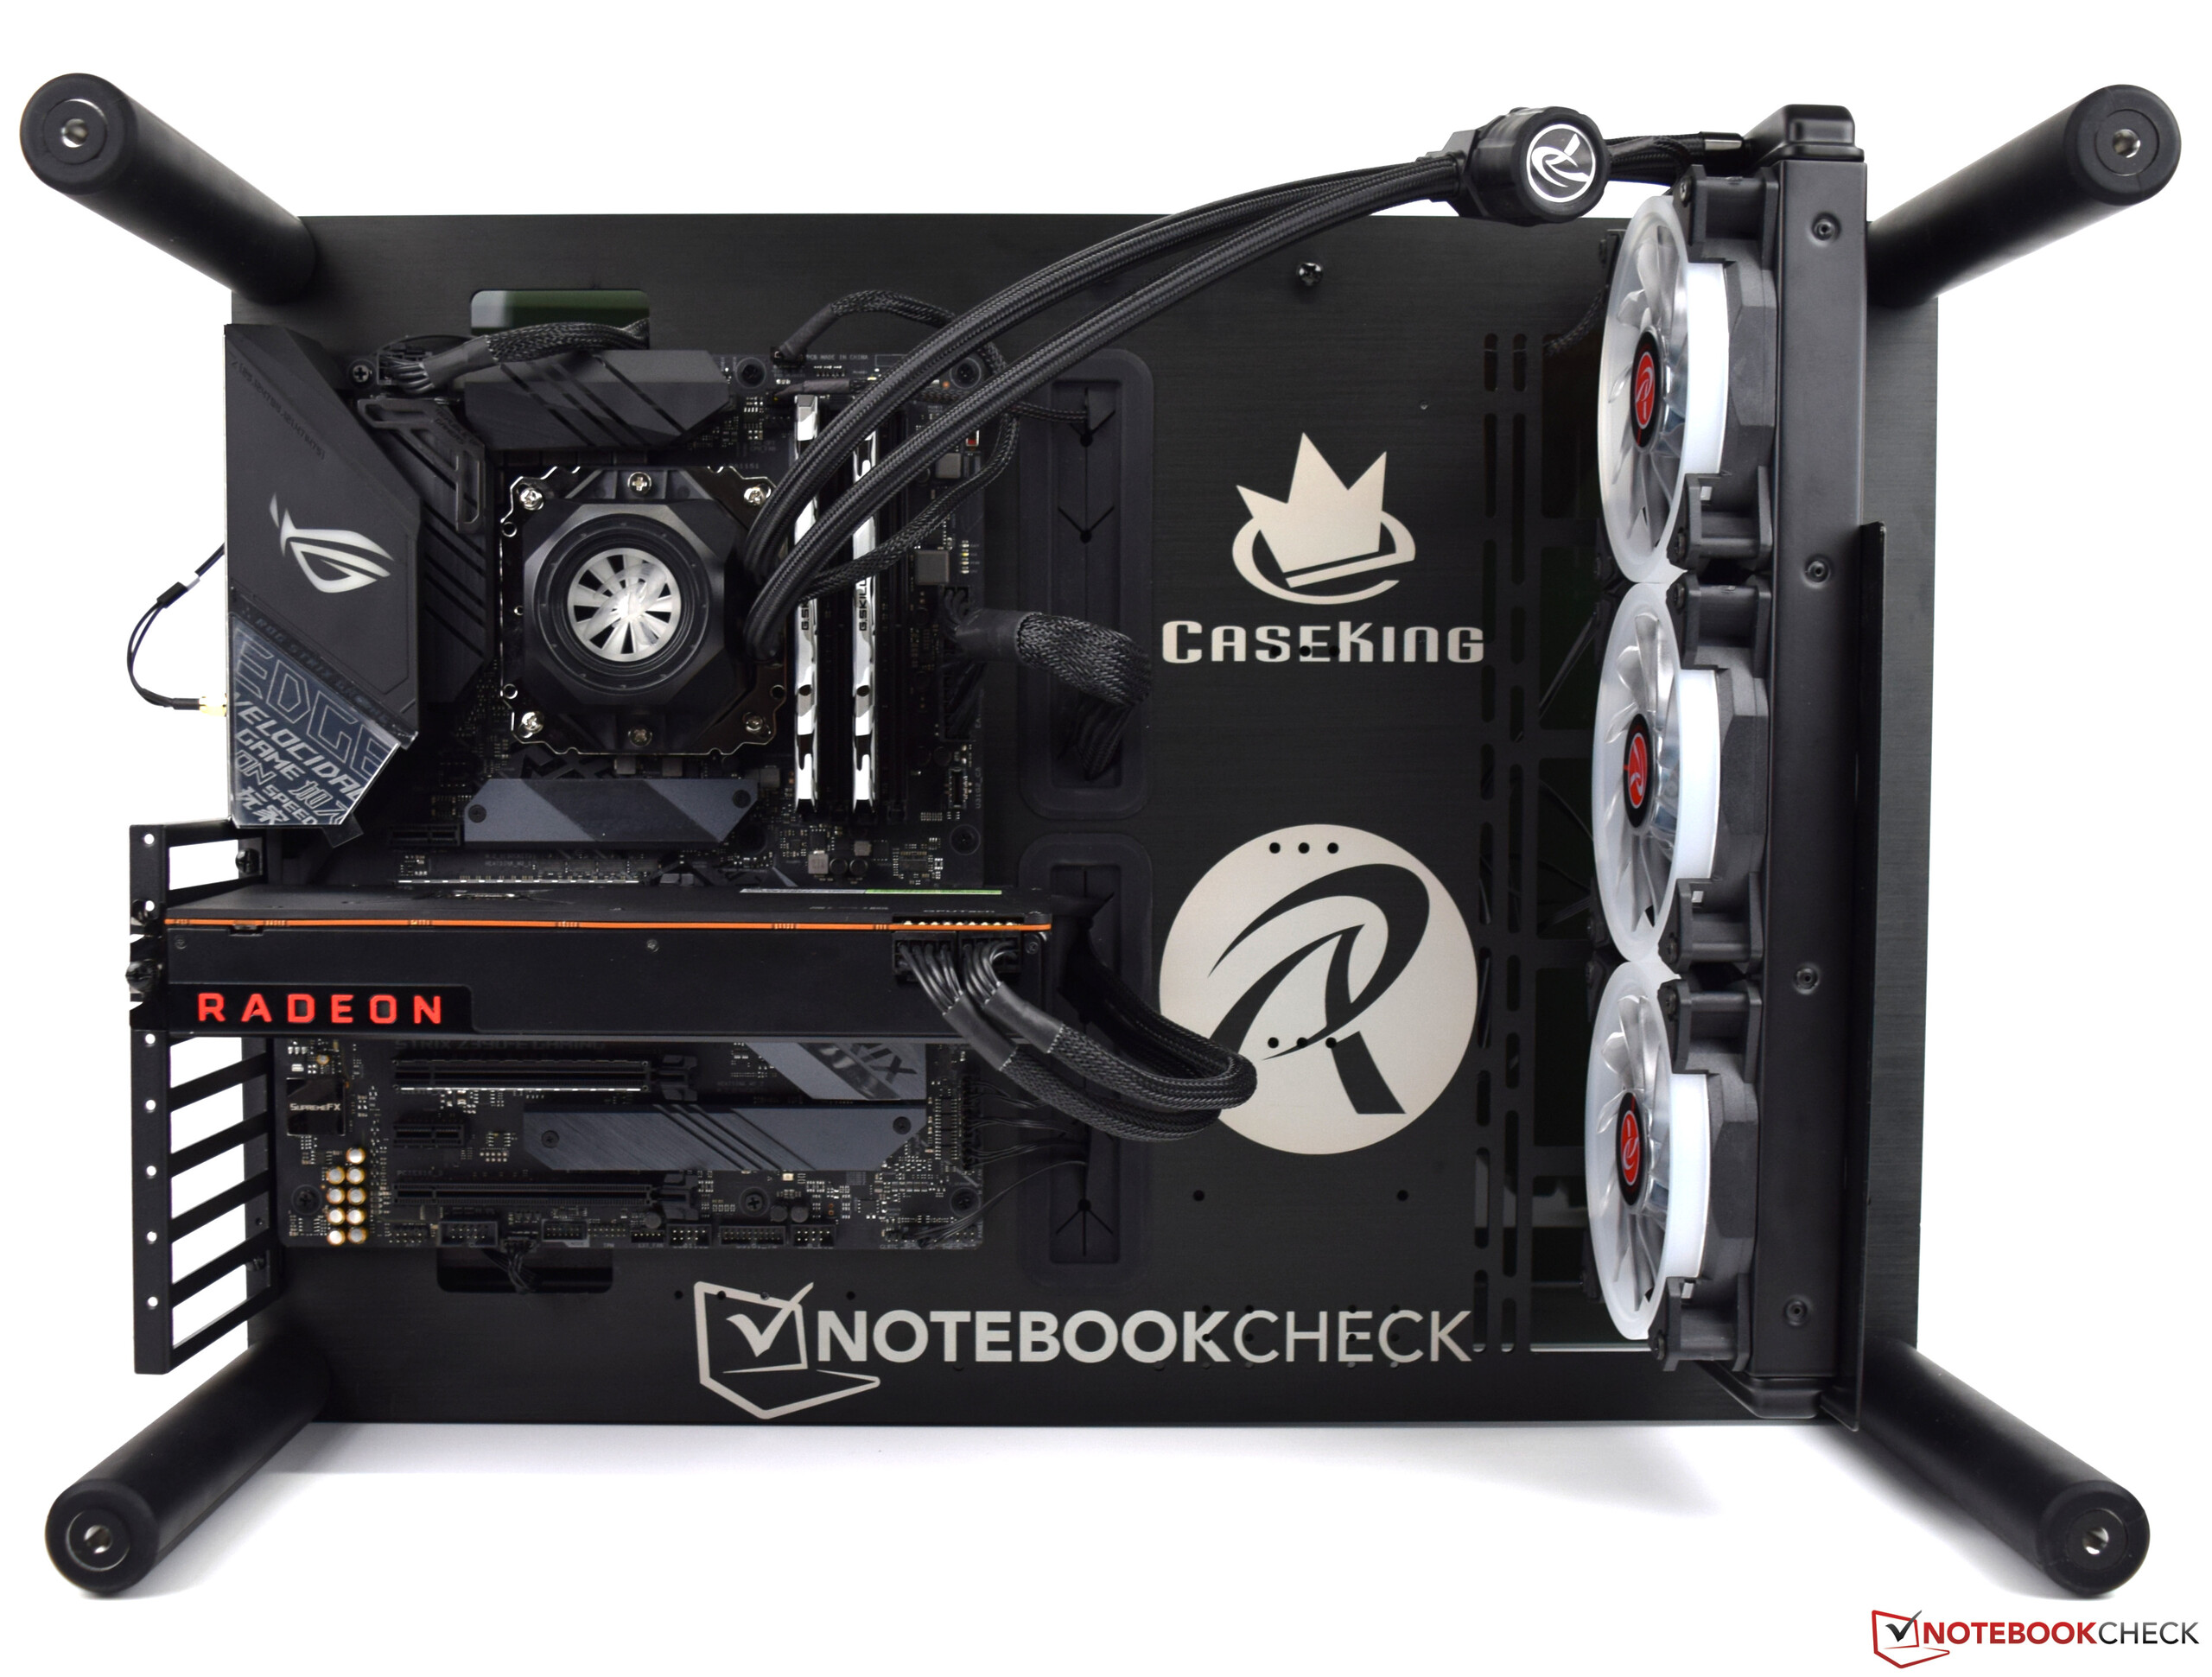
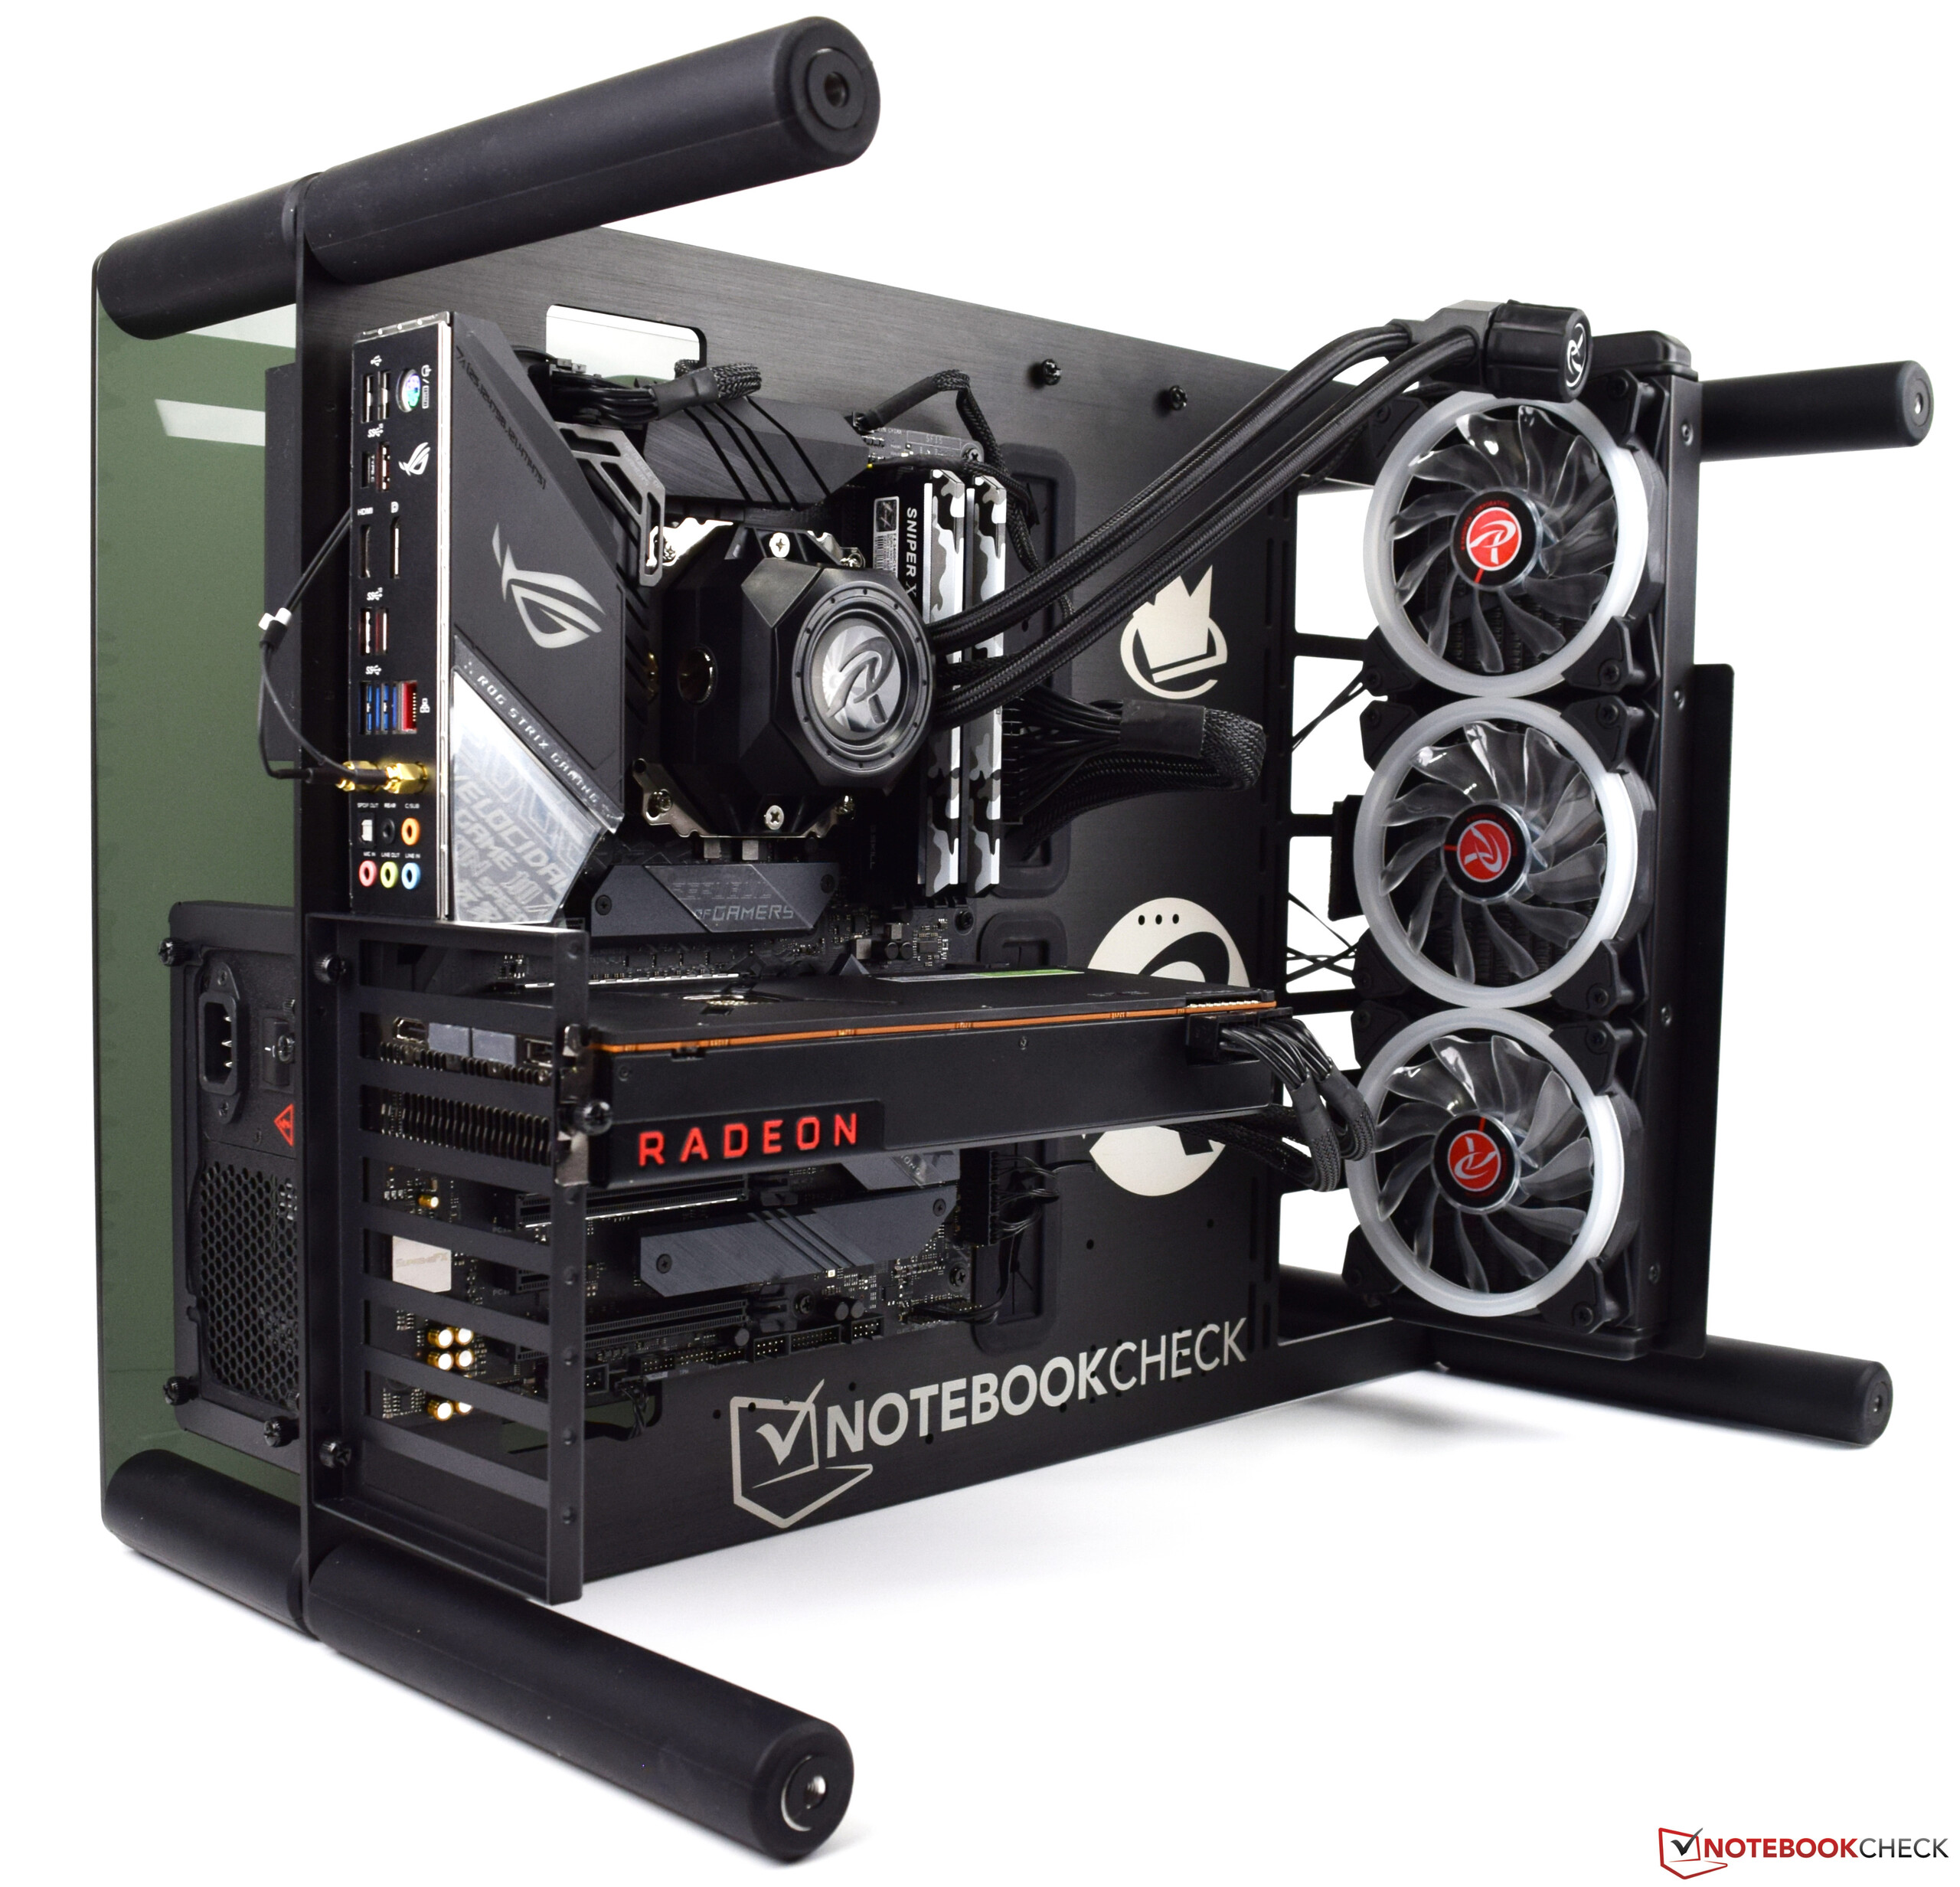
The Test System
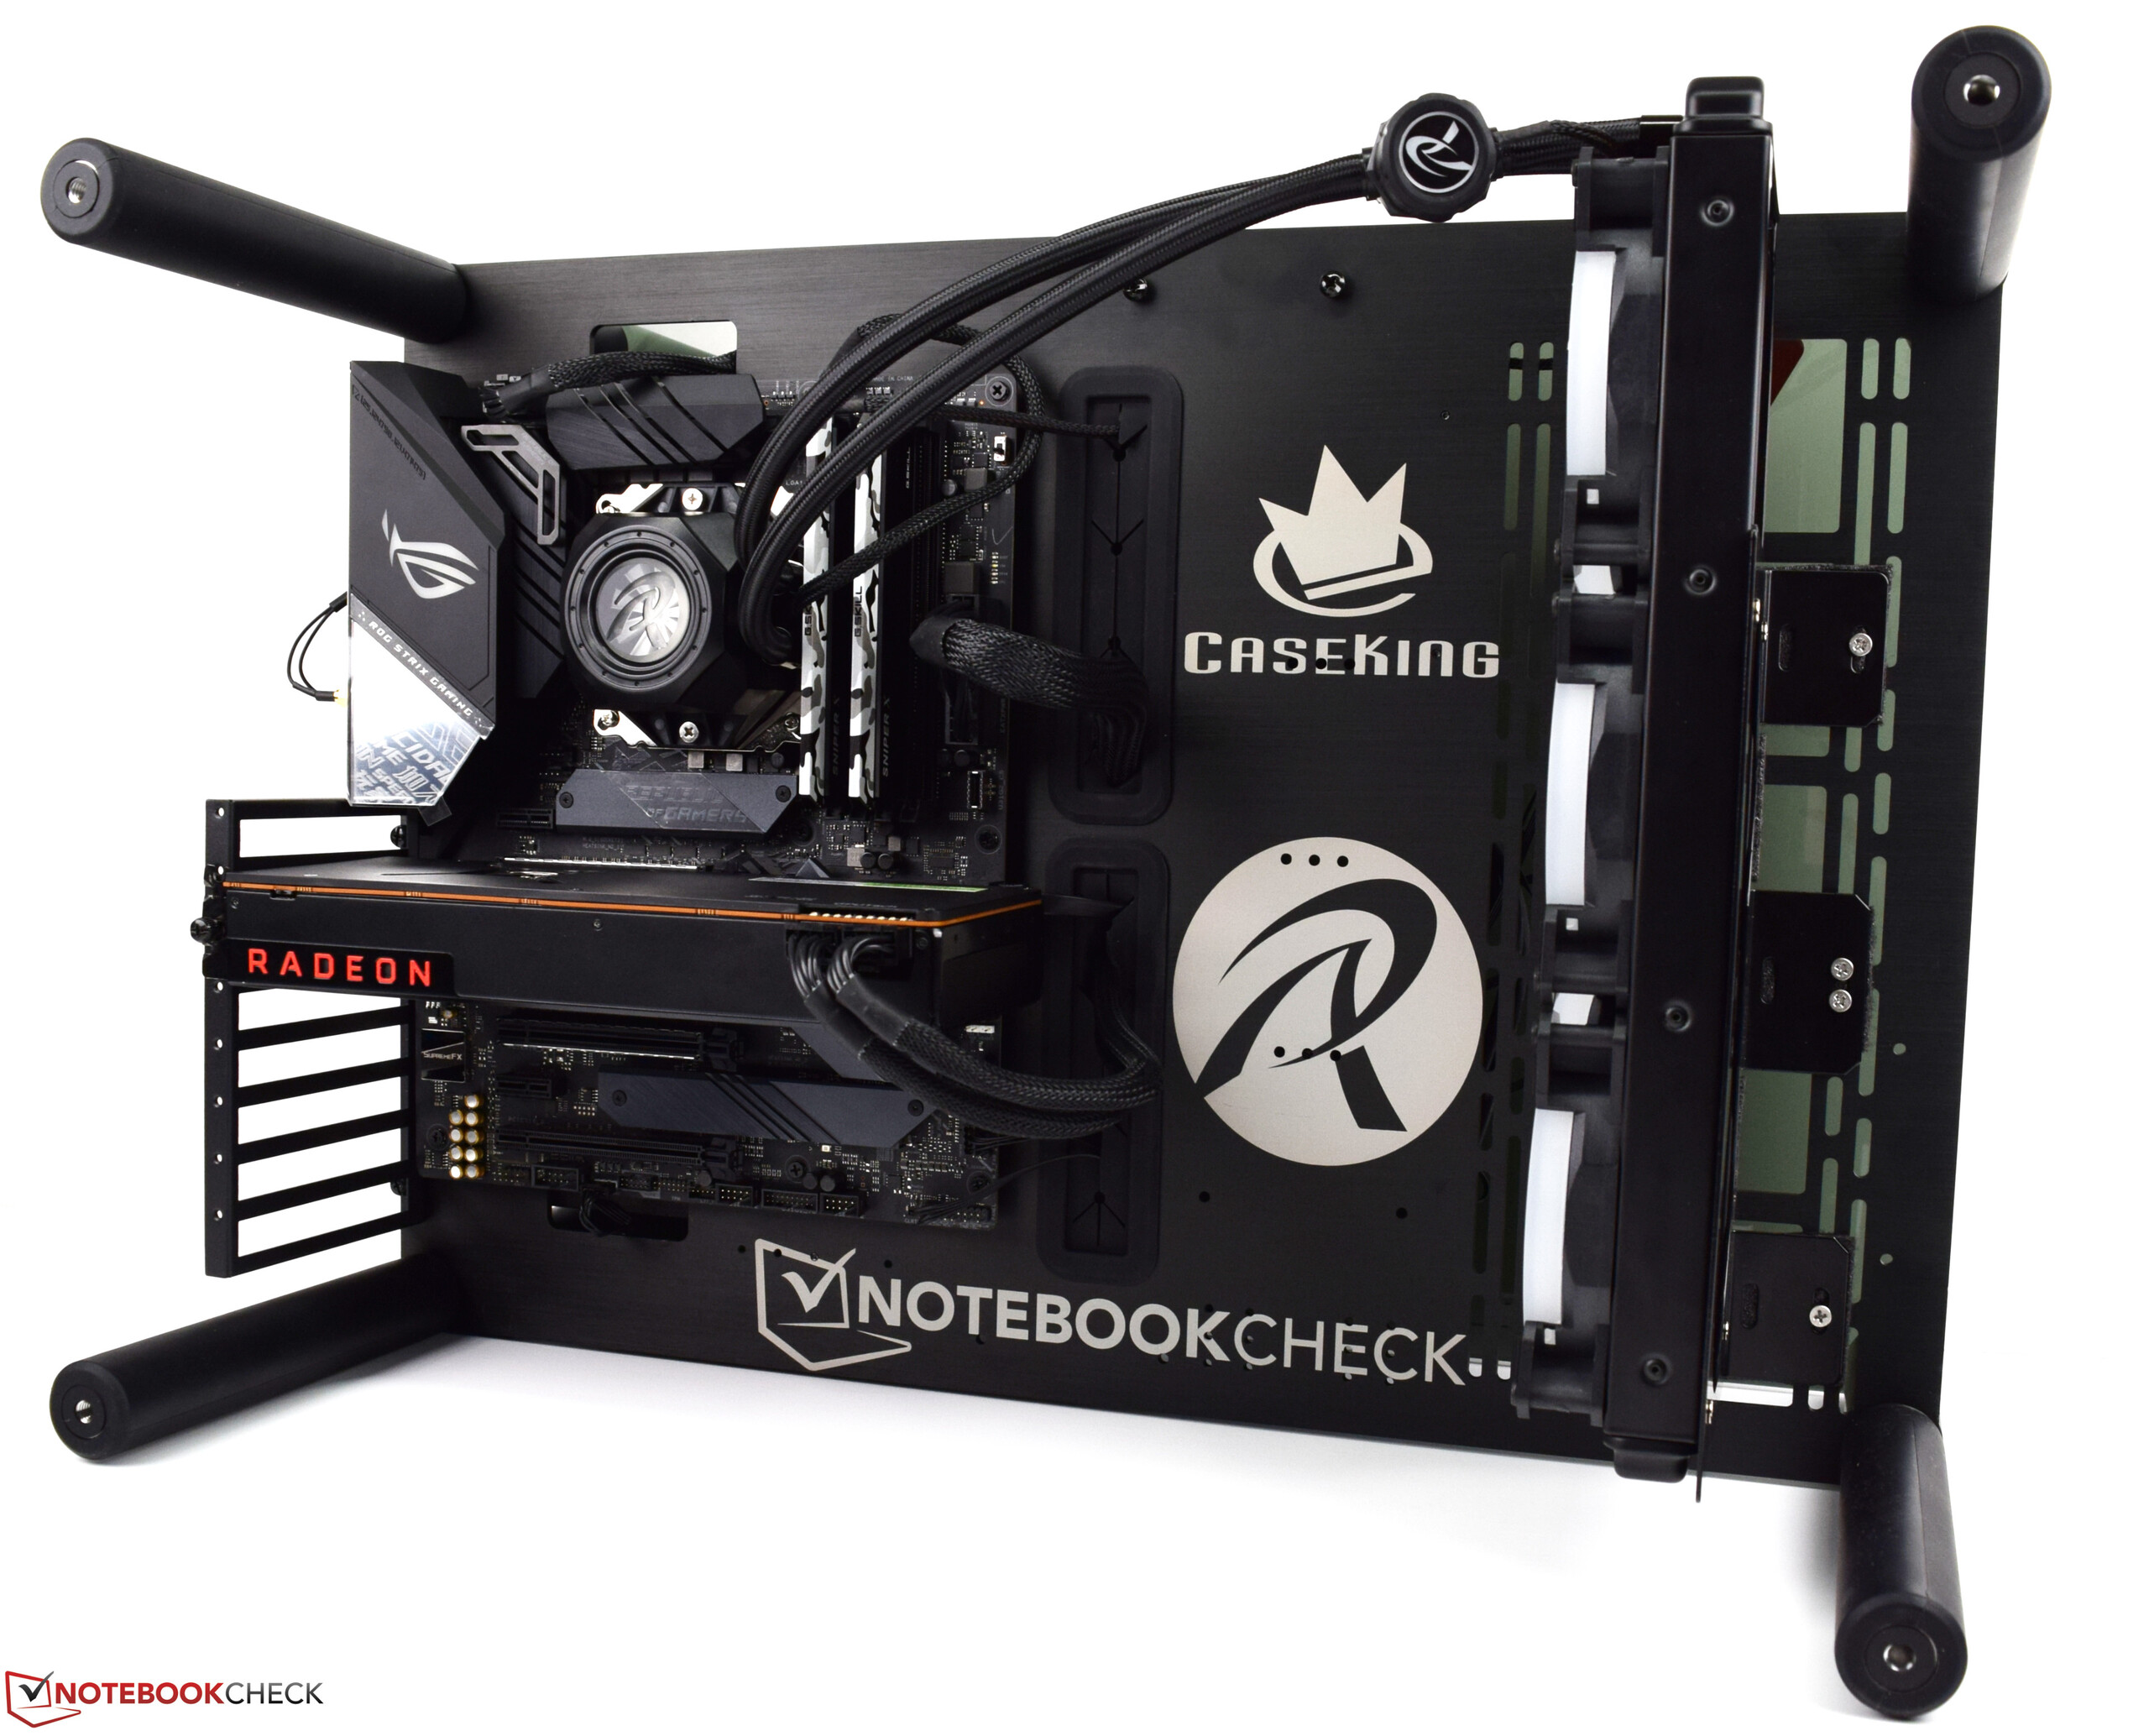
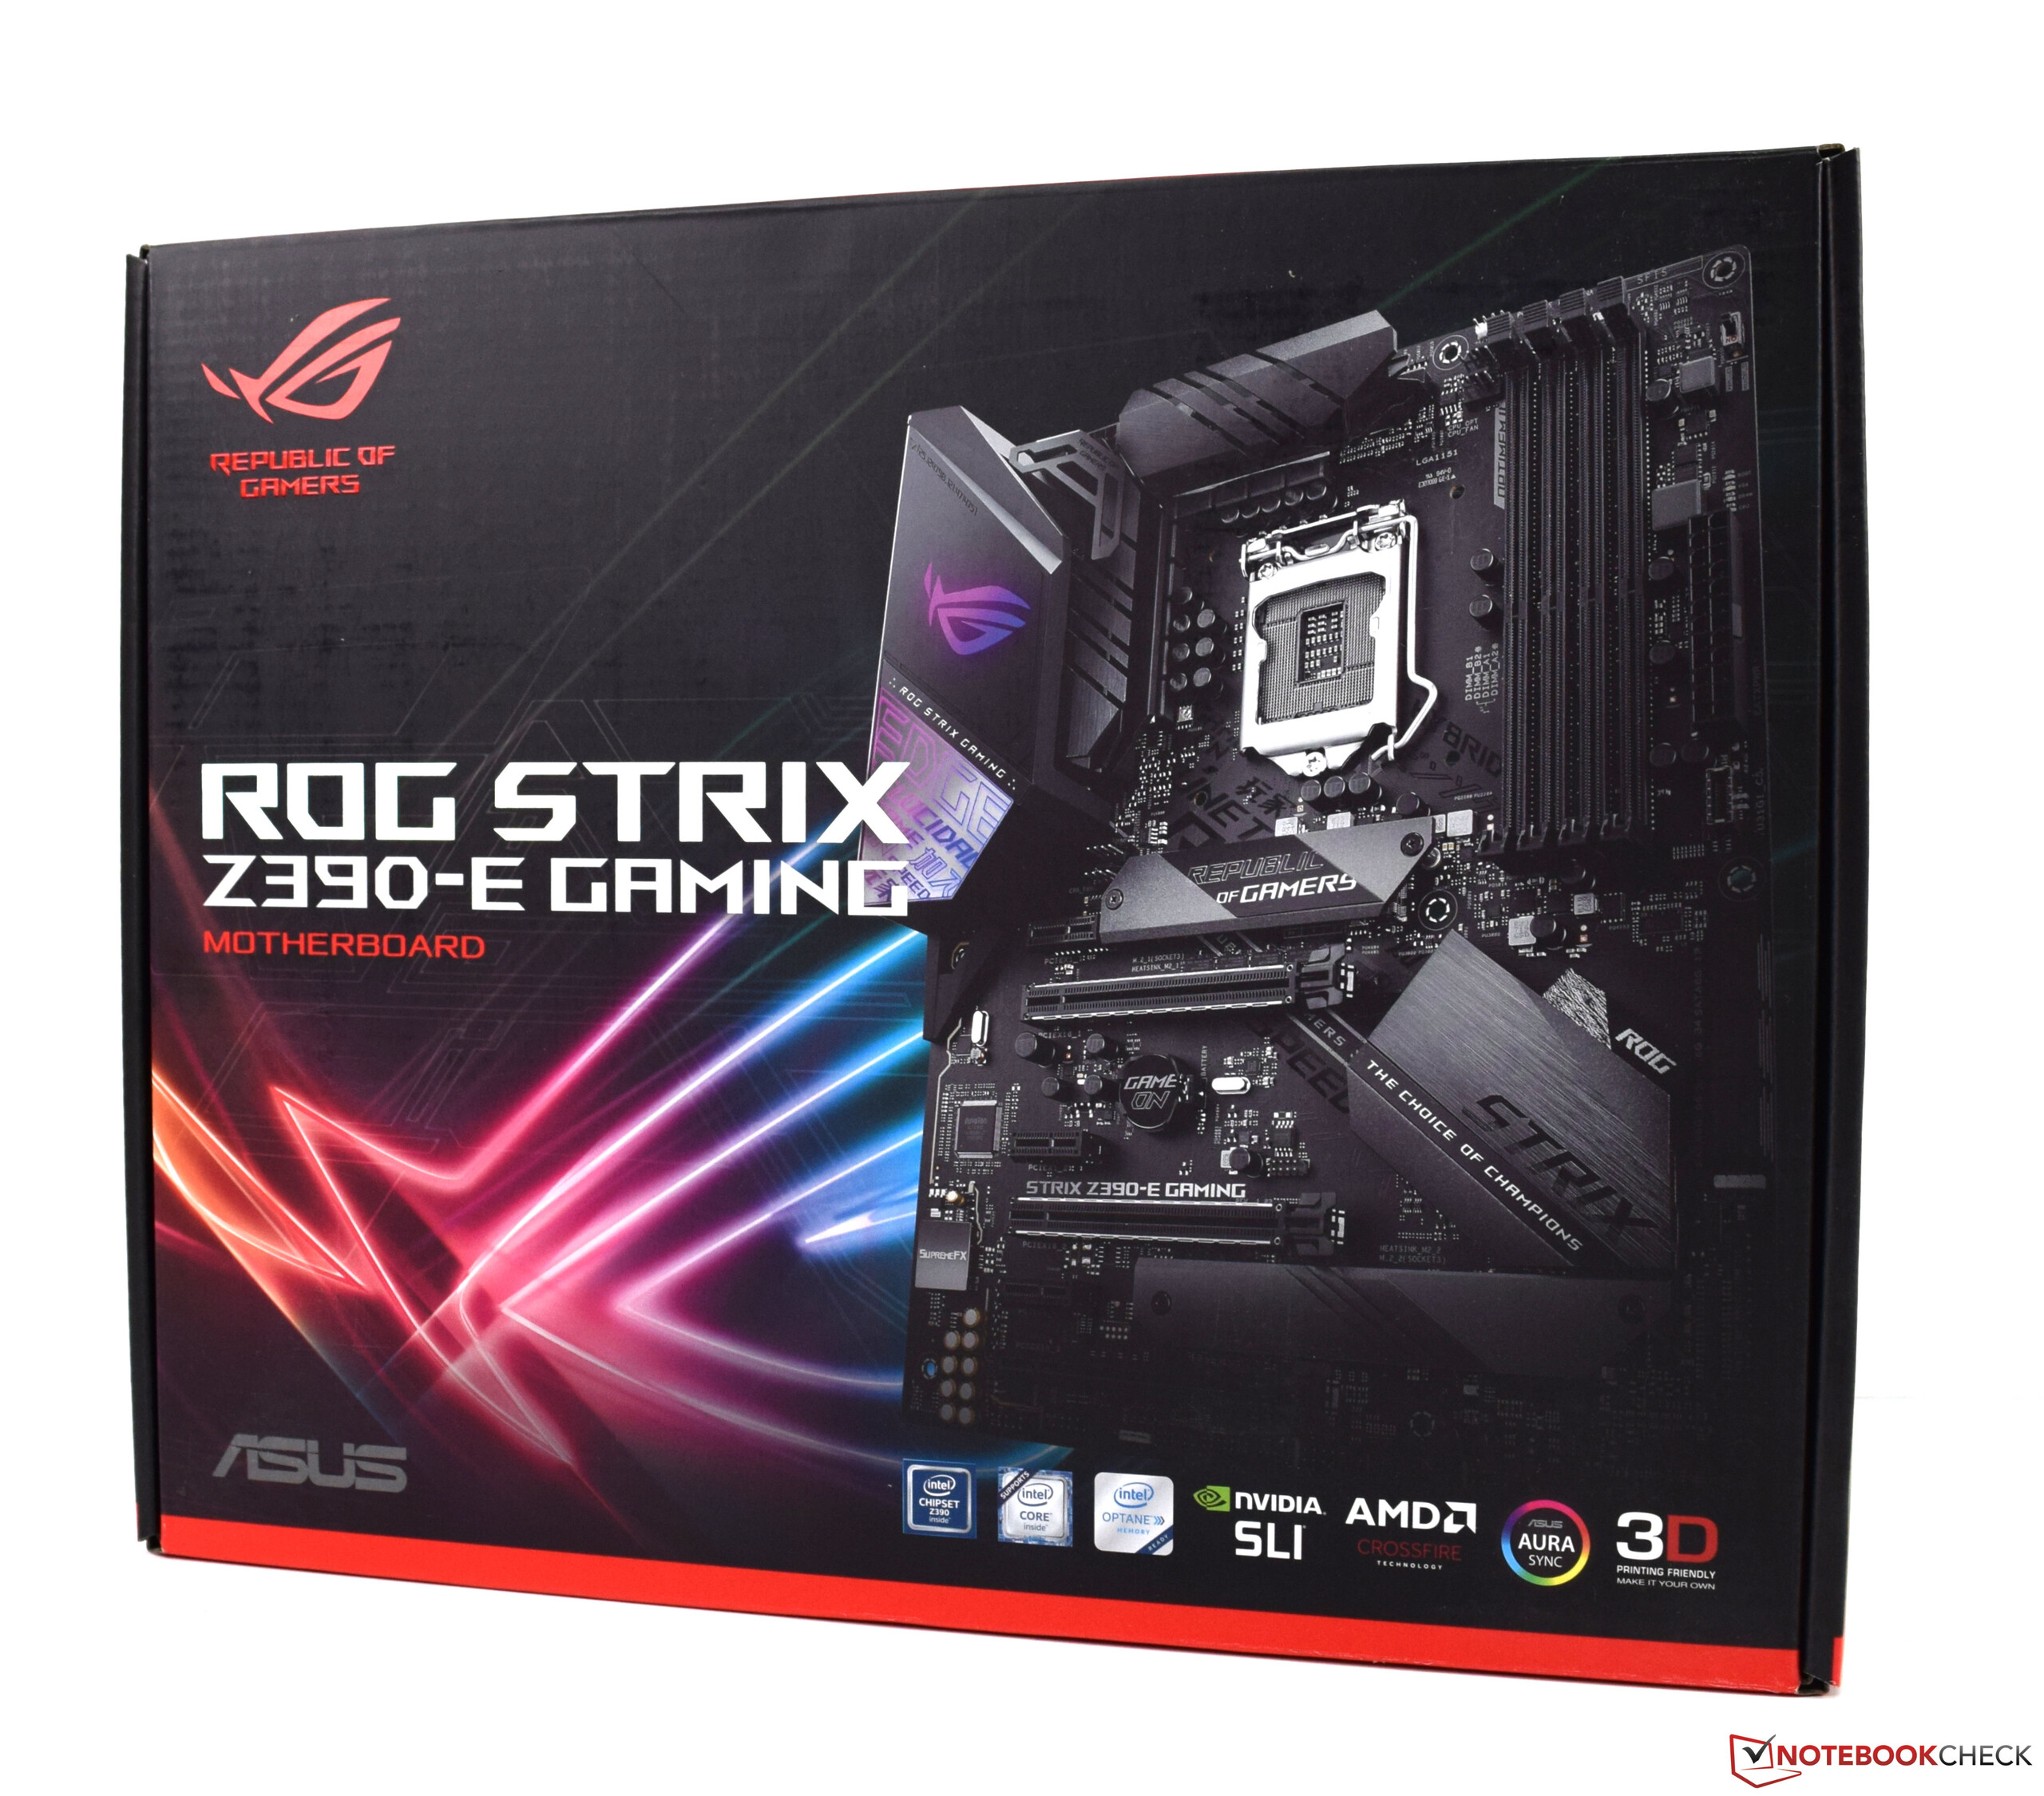
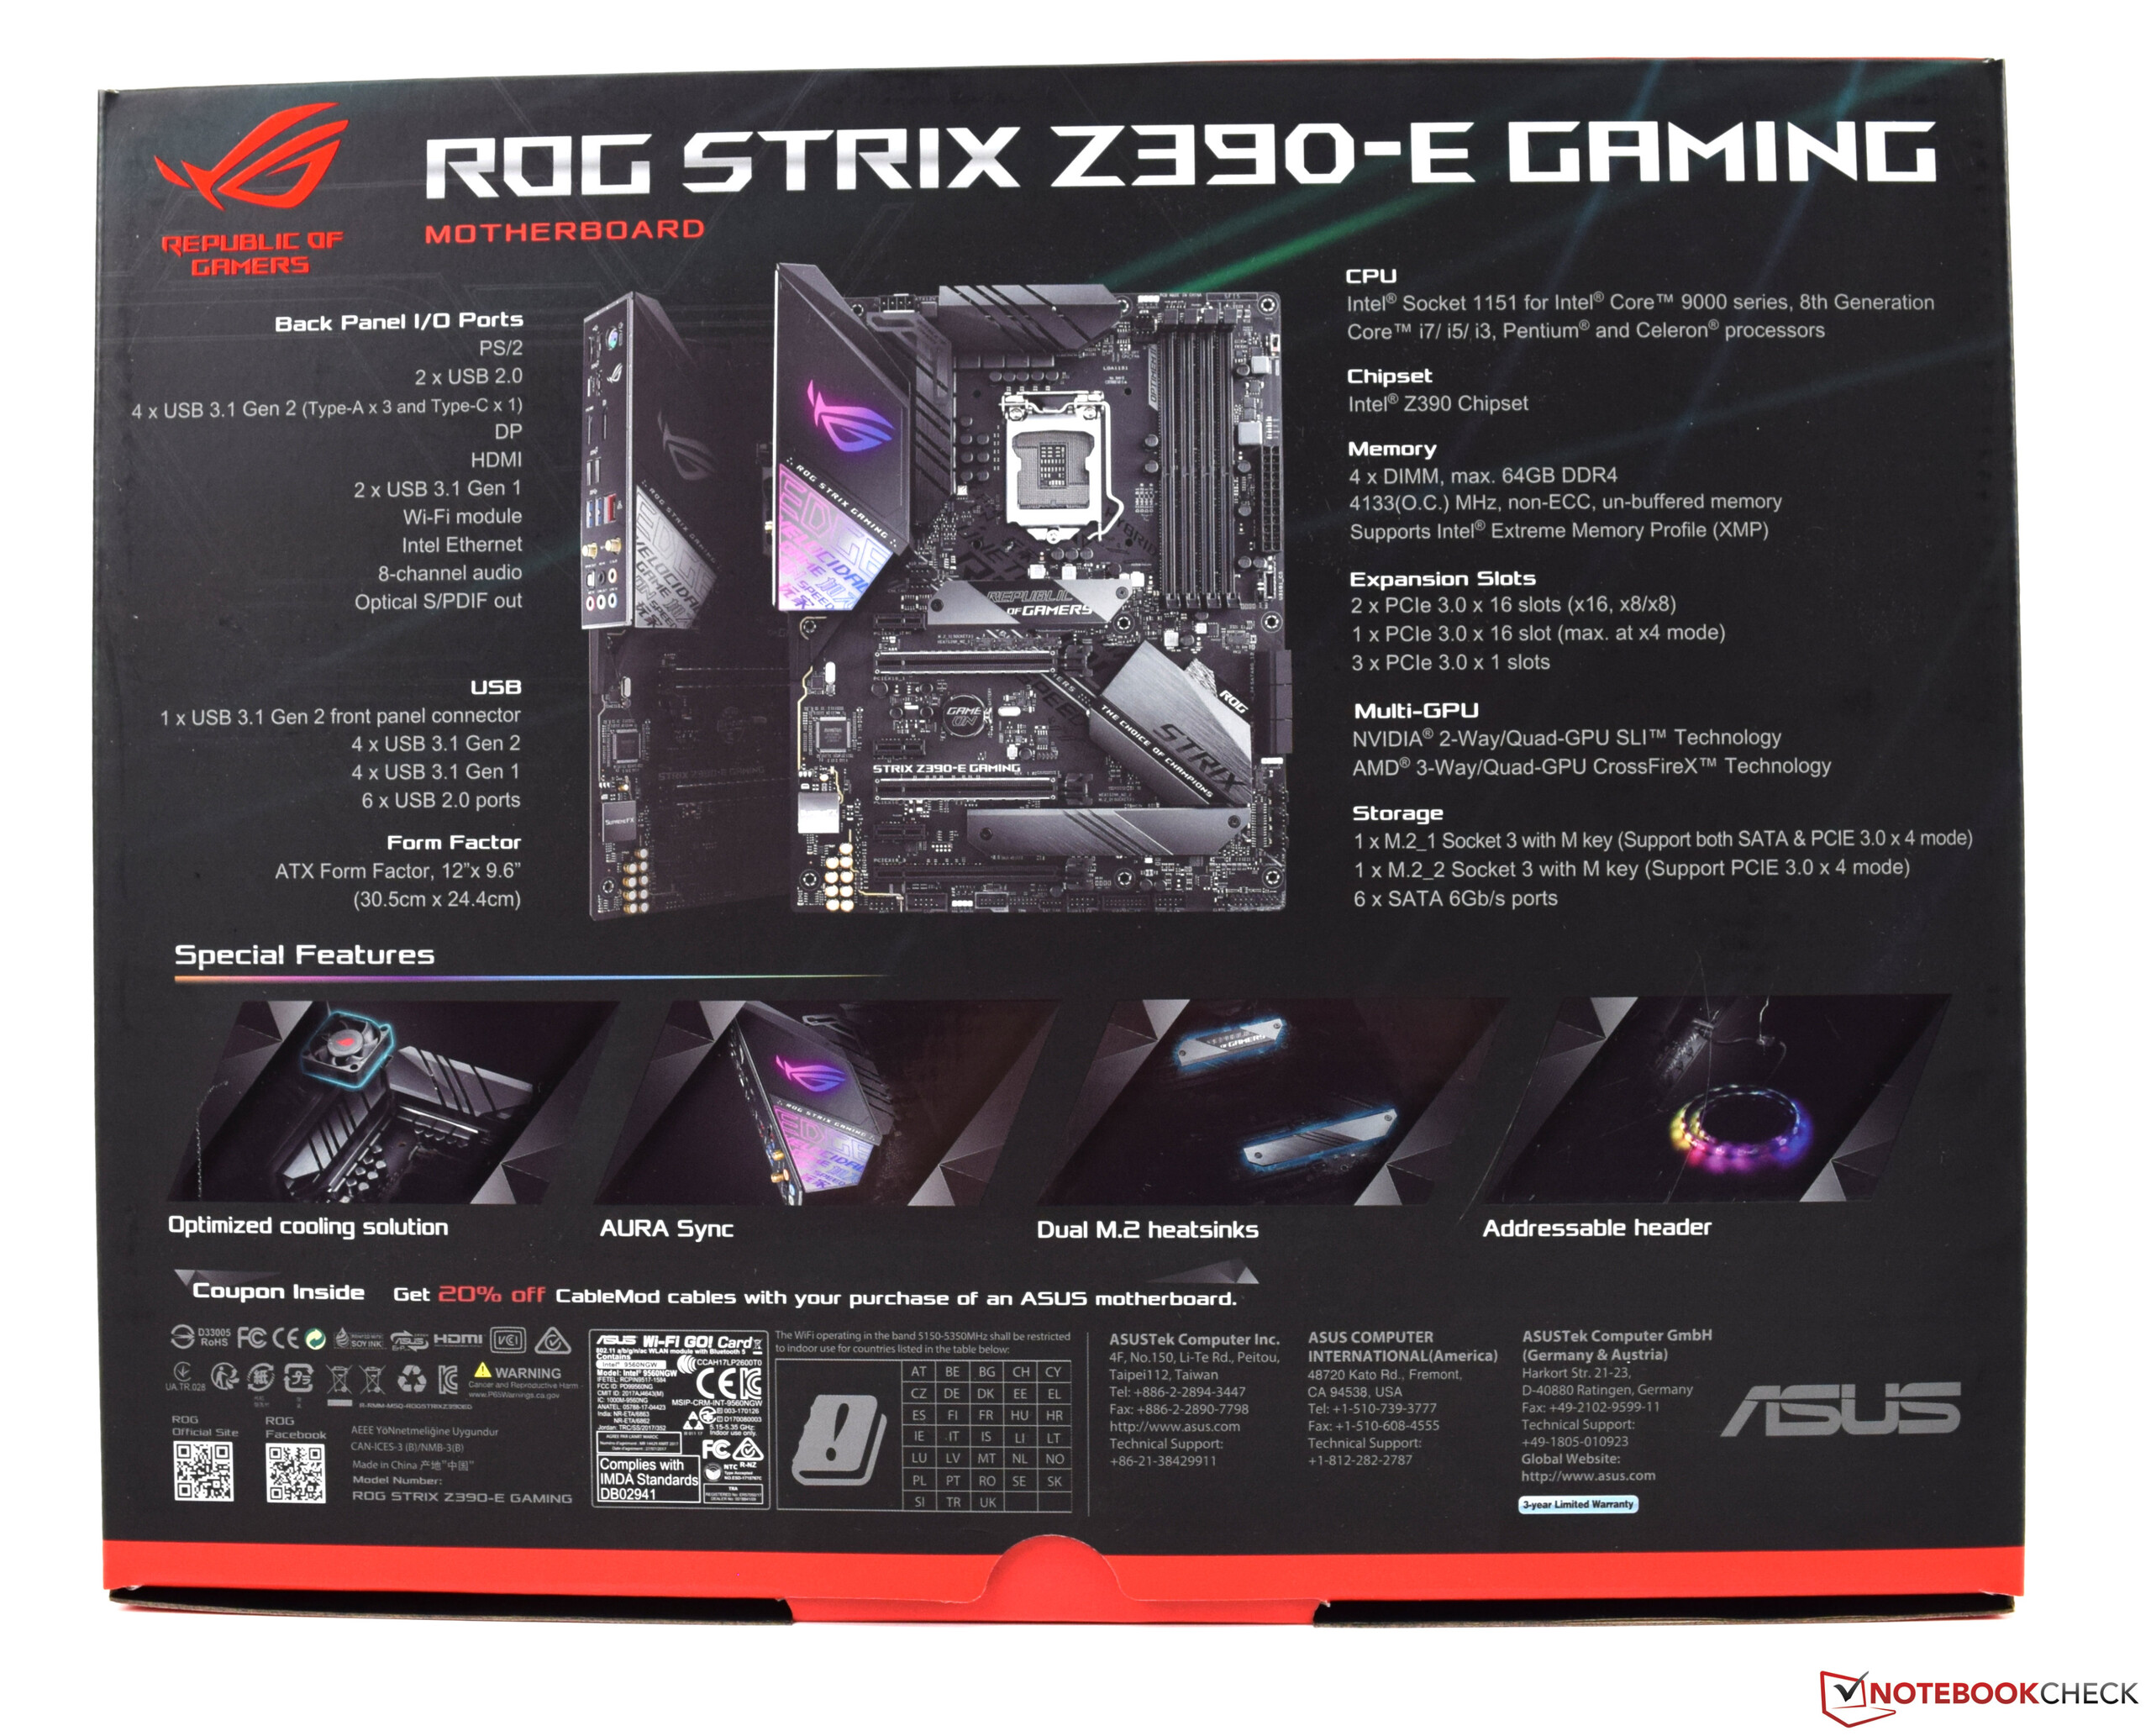
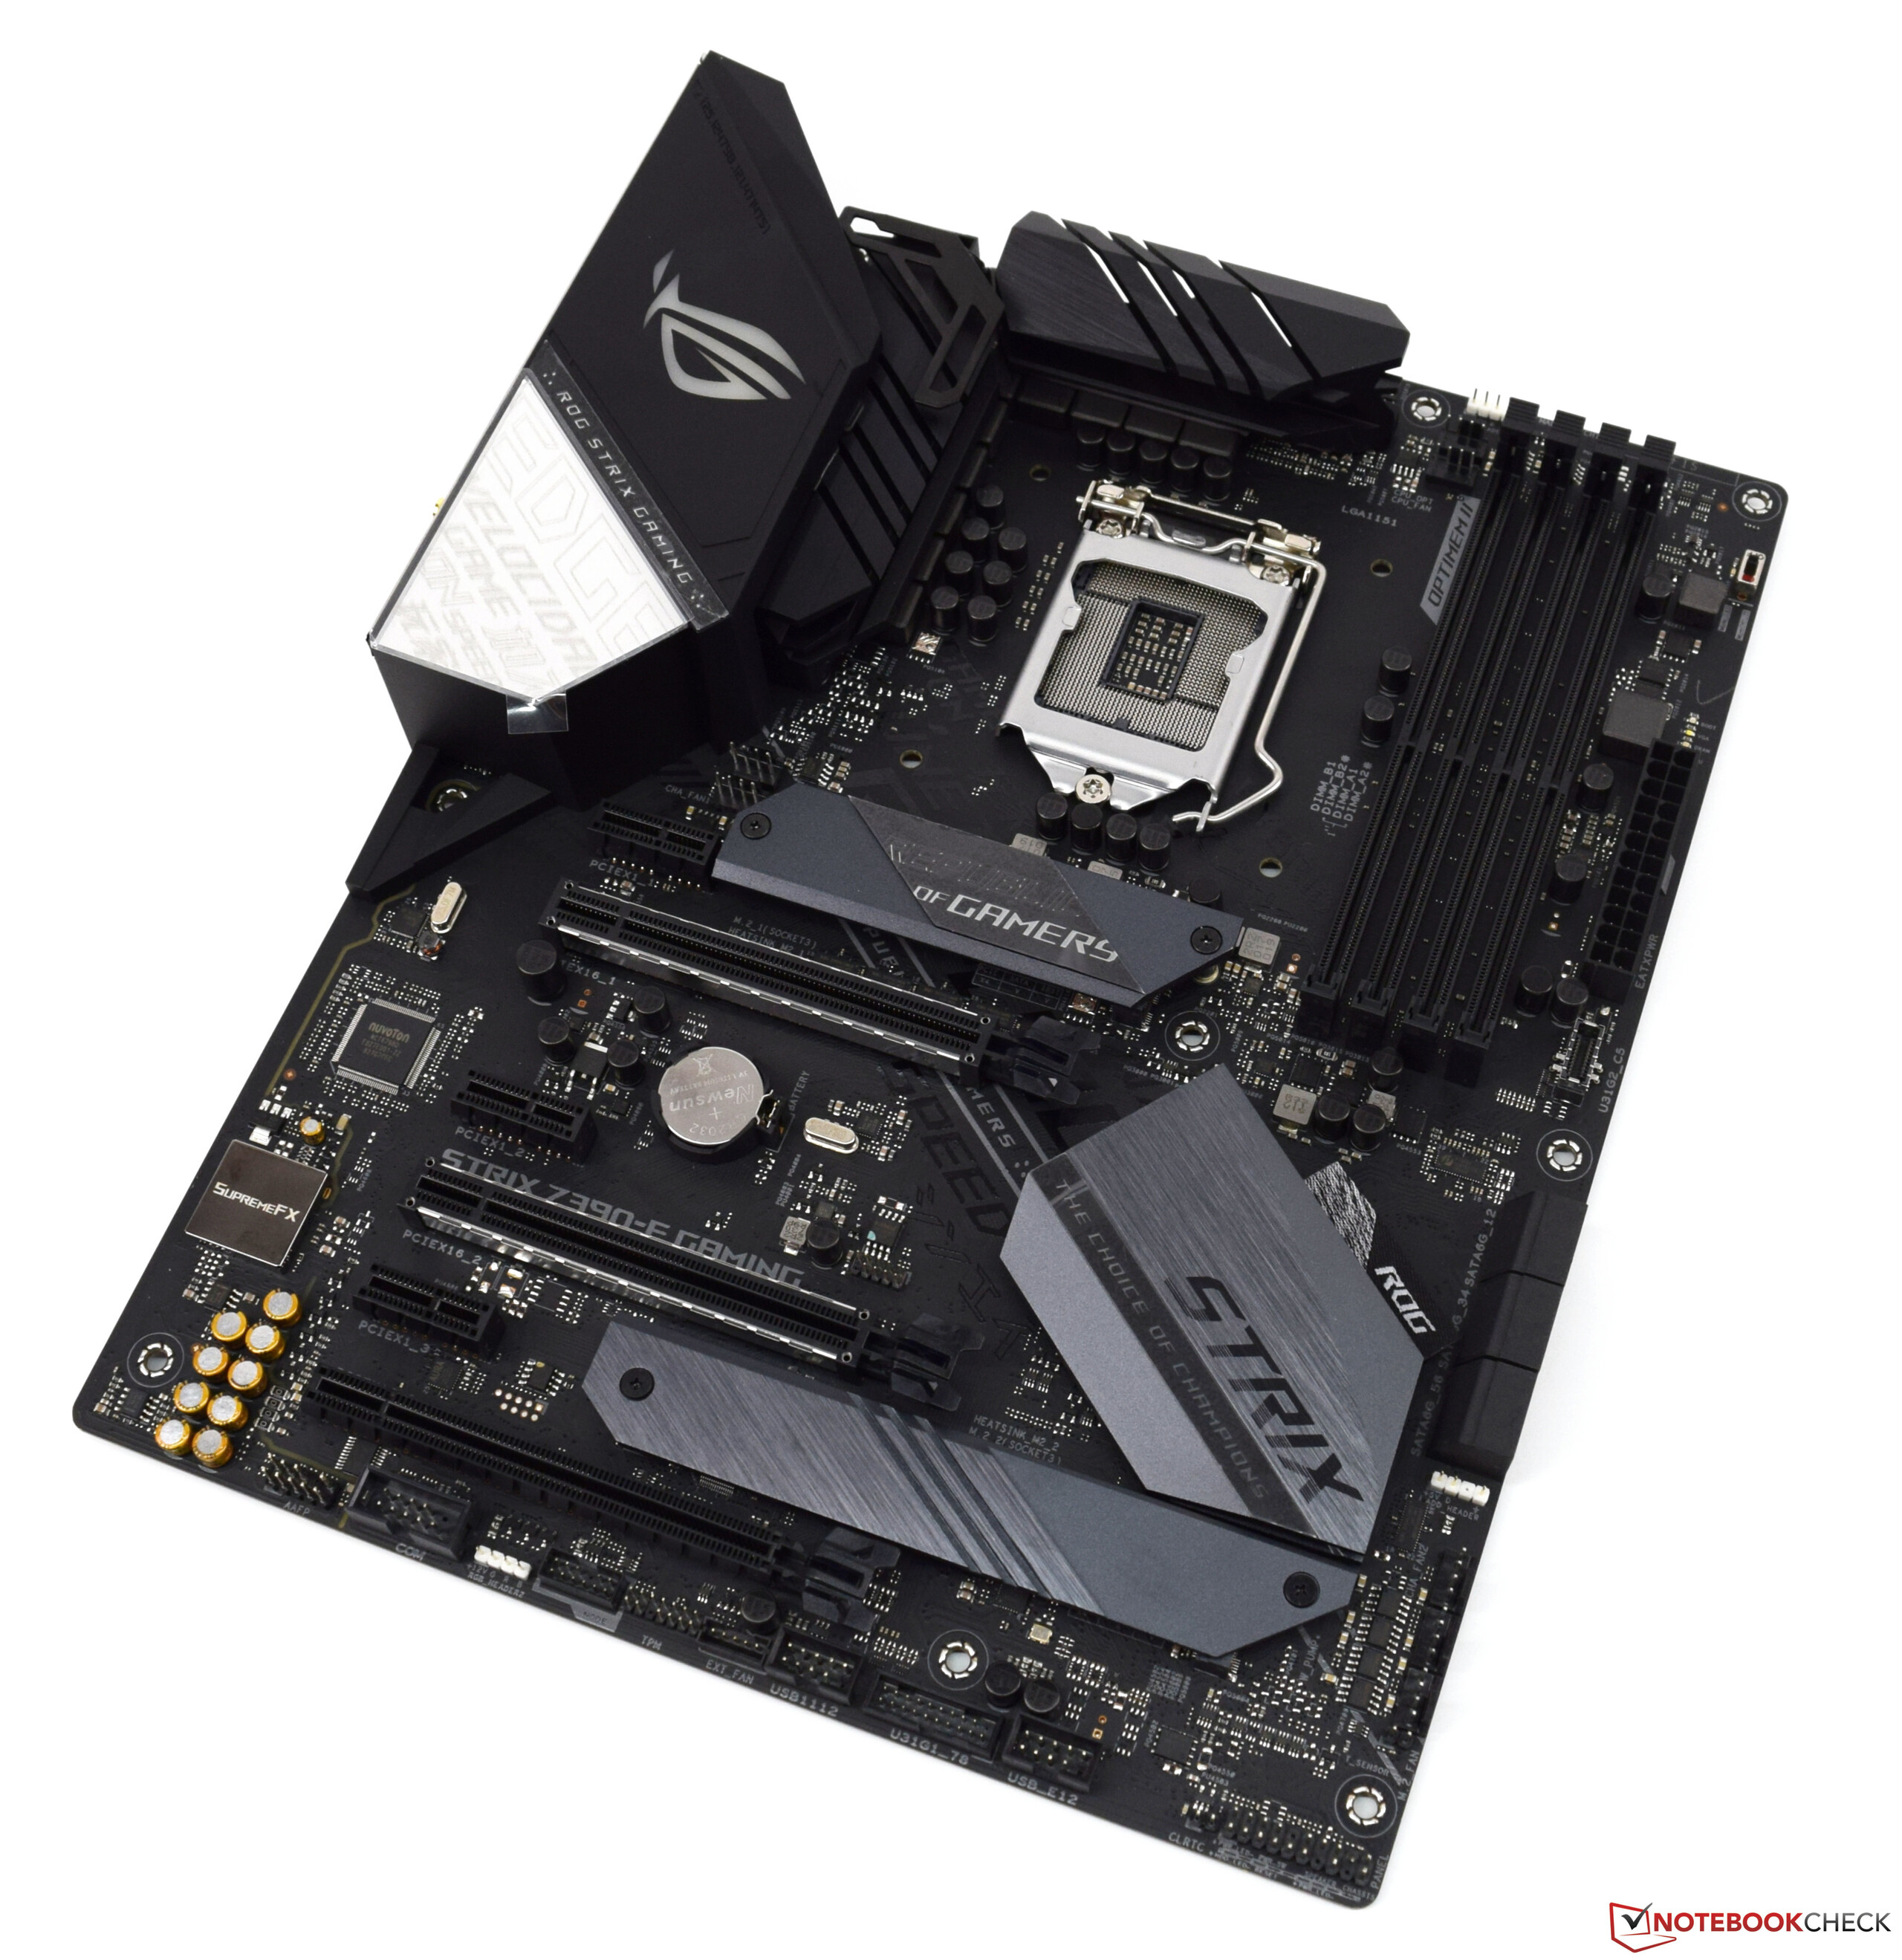
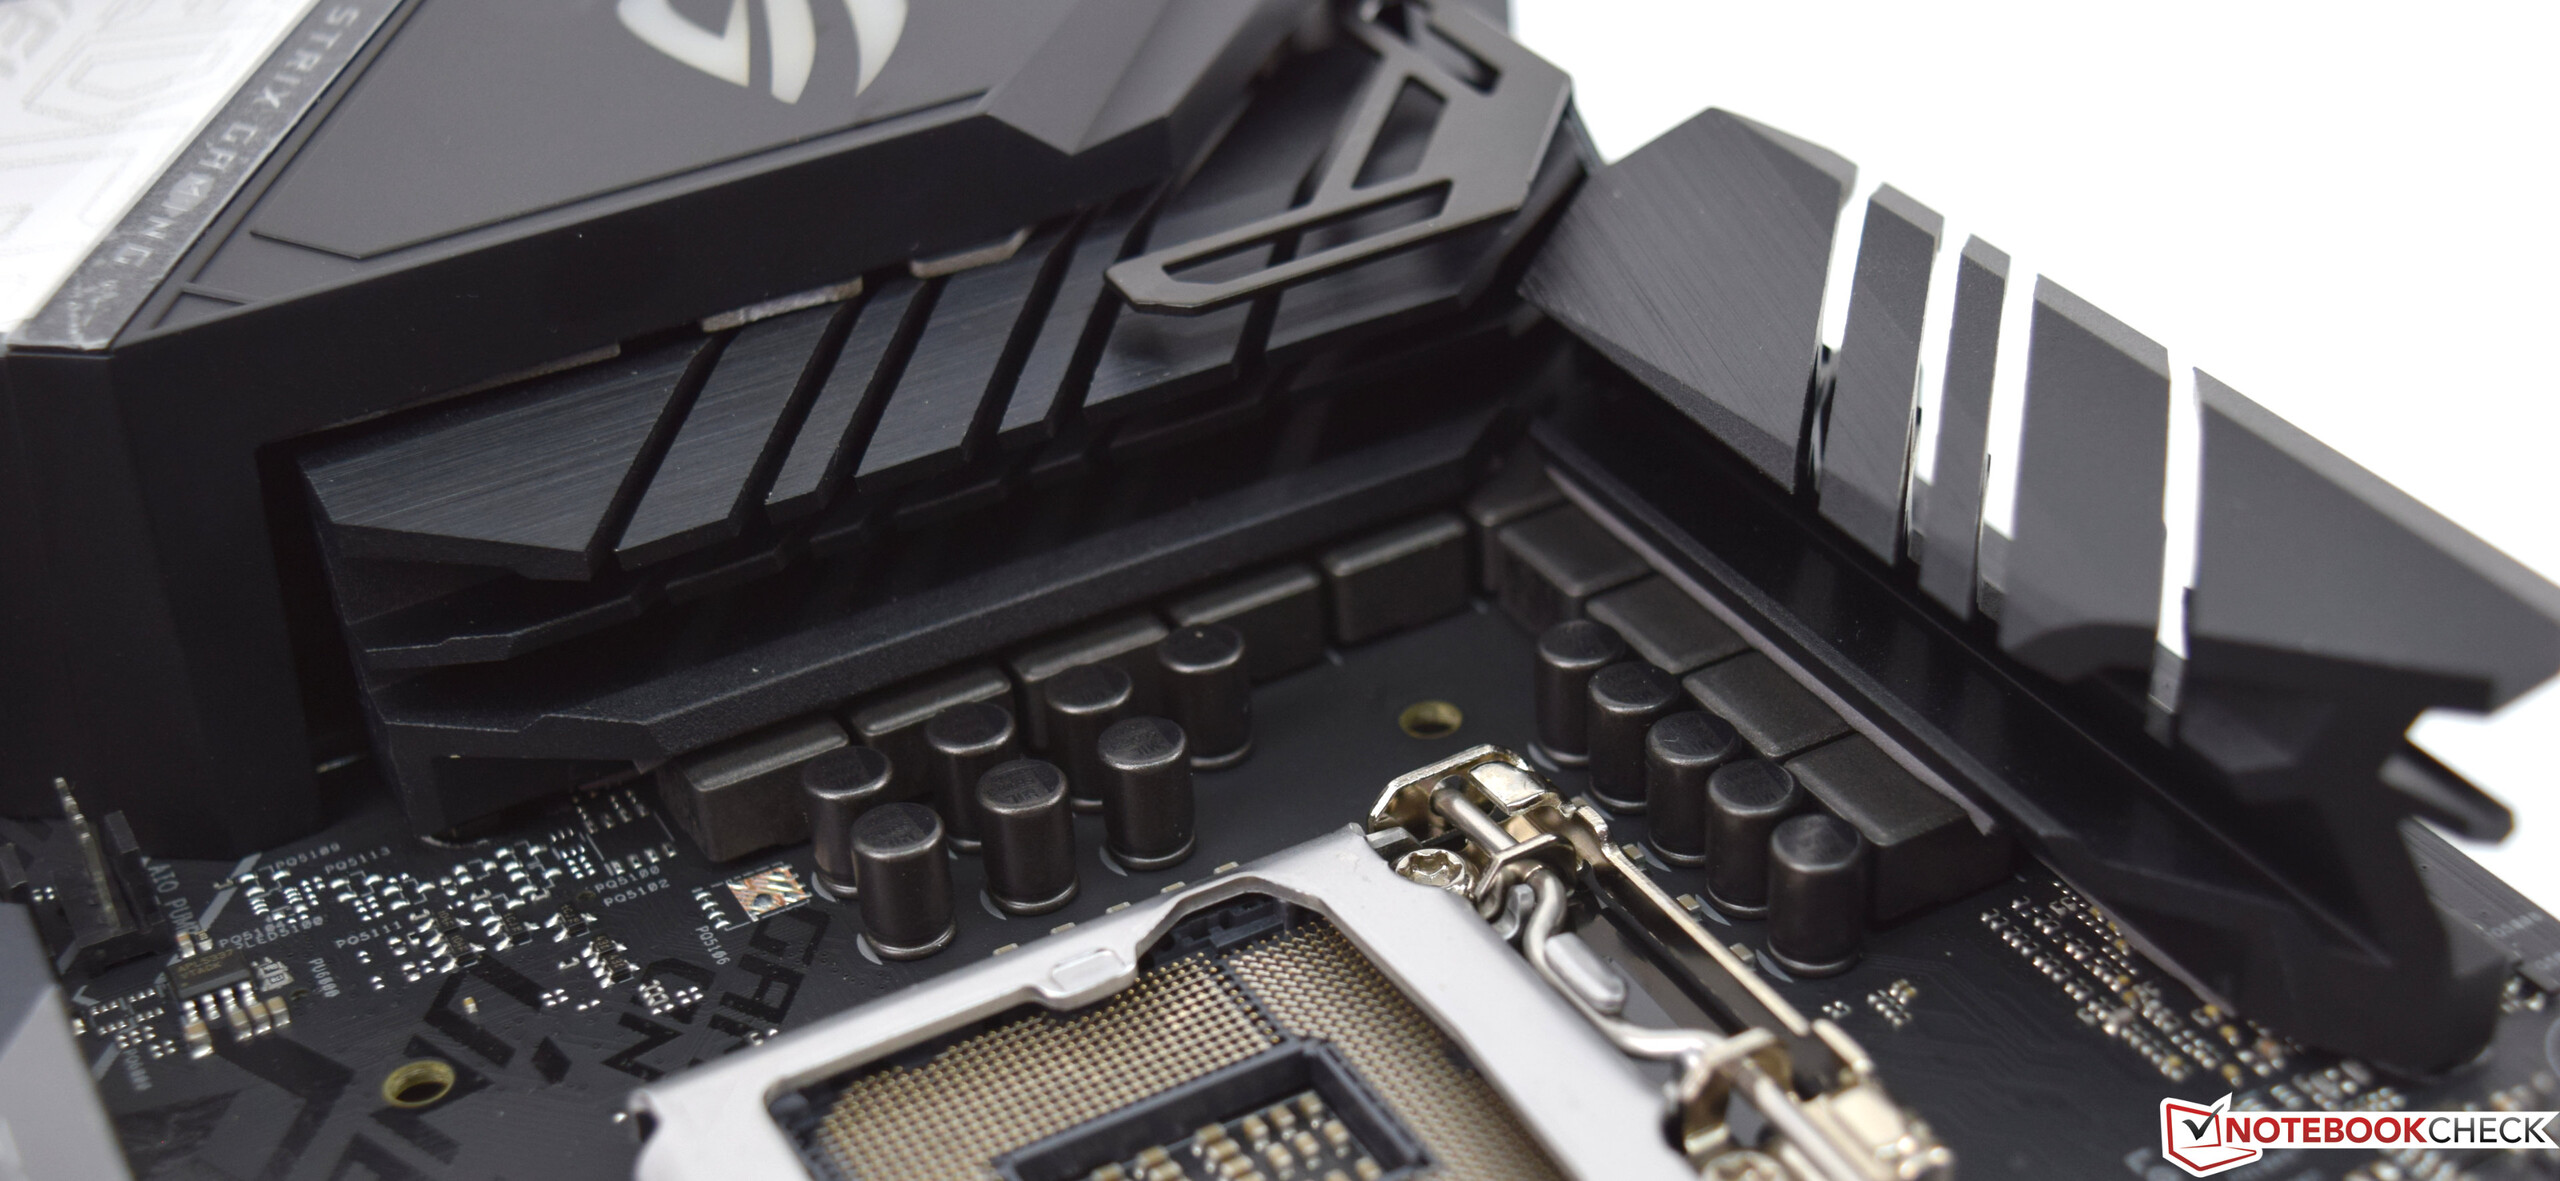
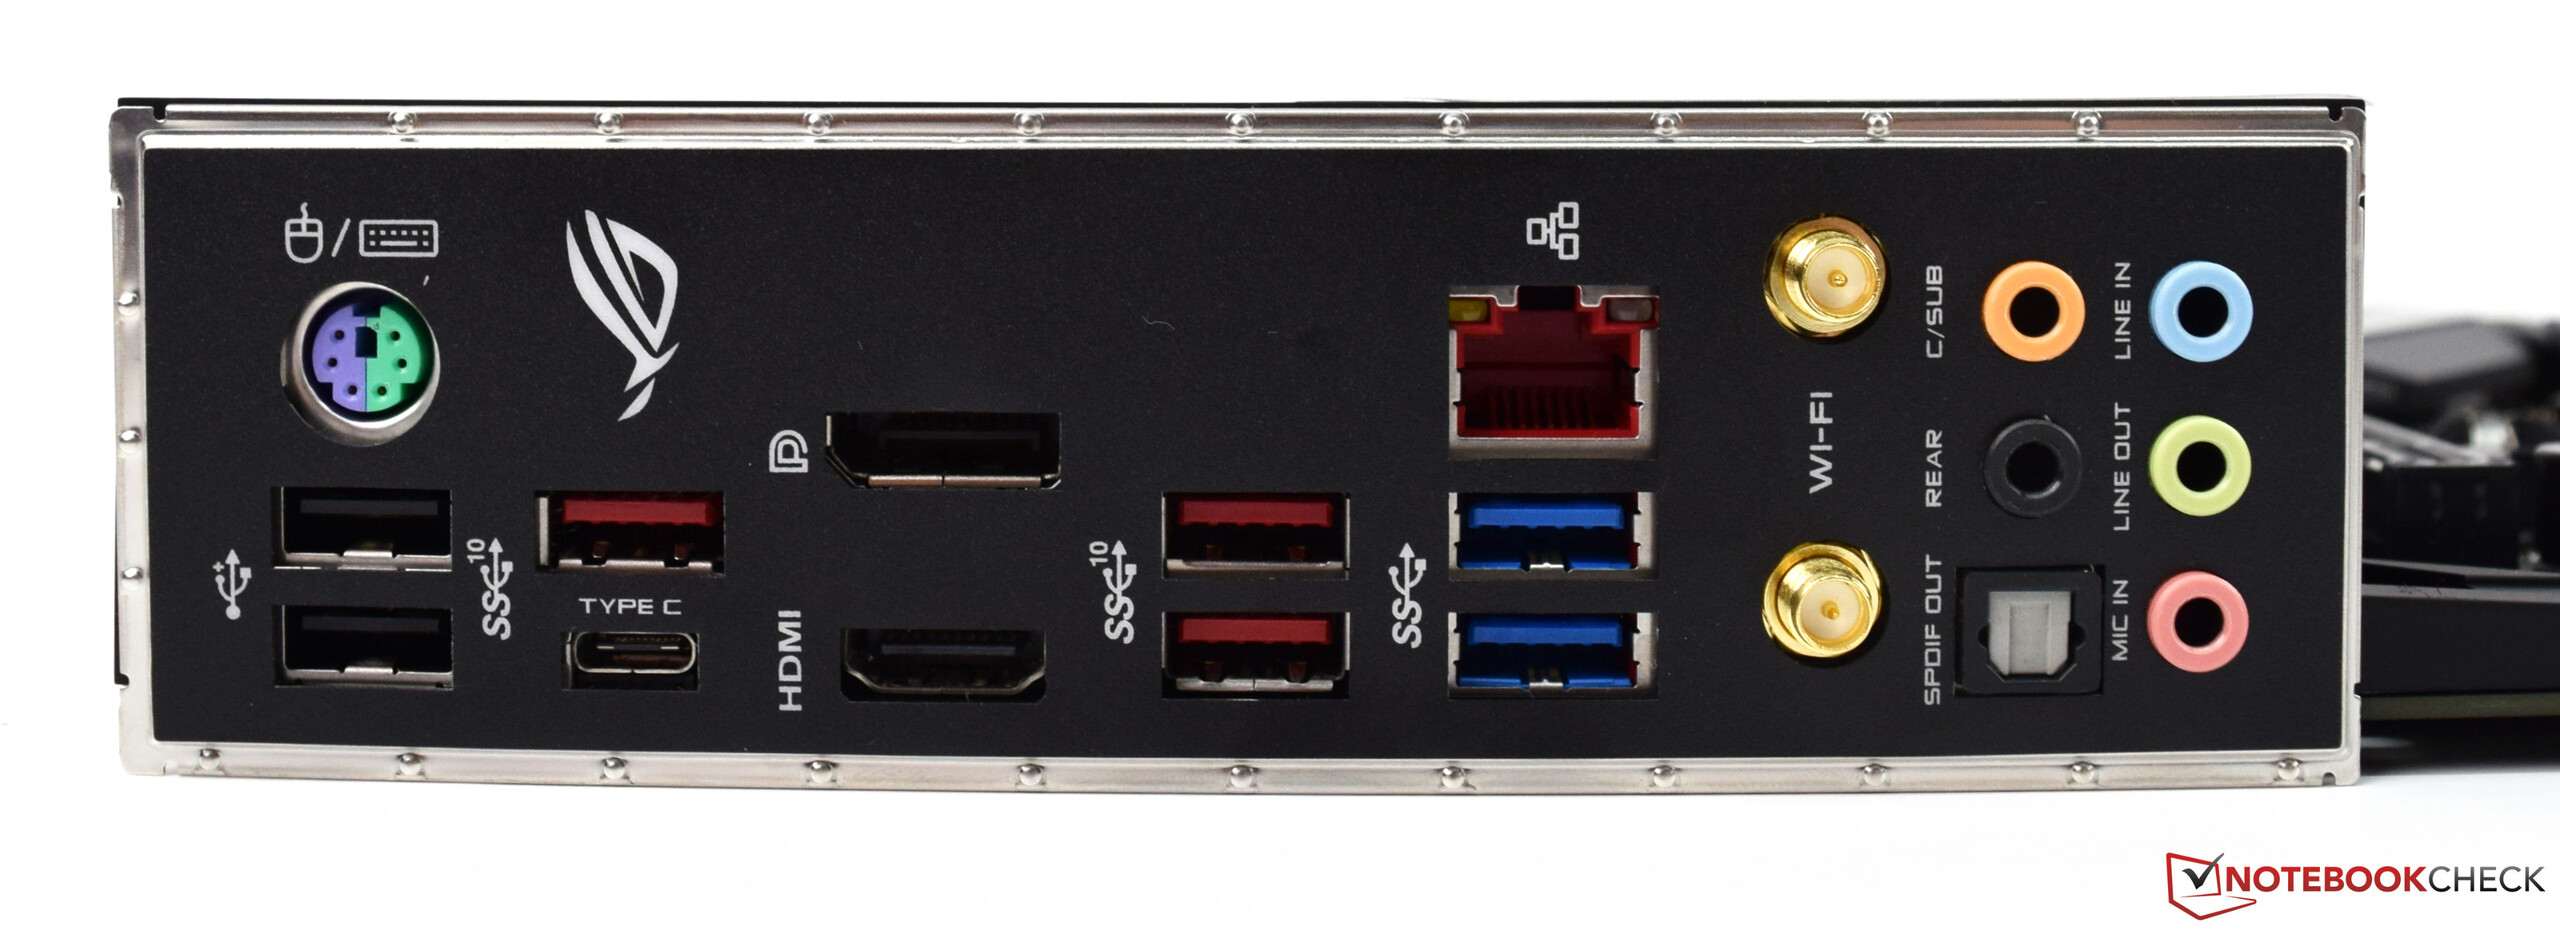
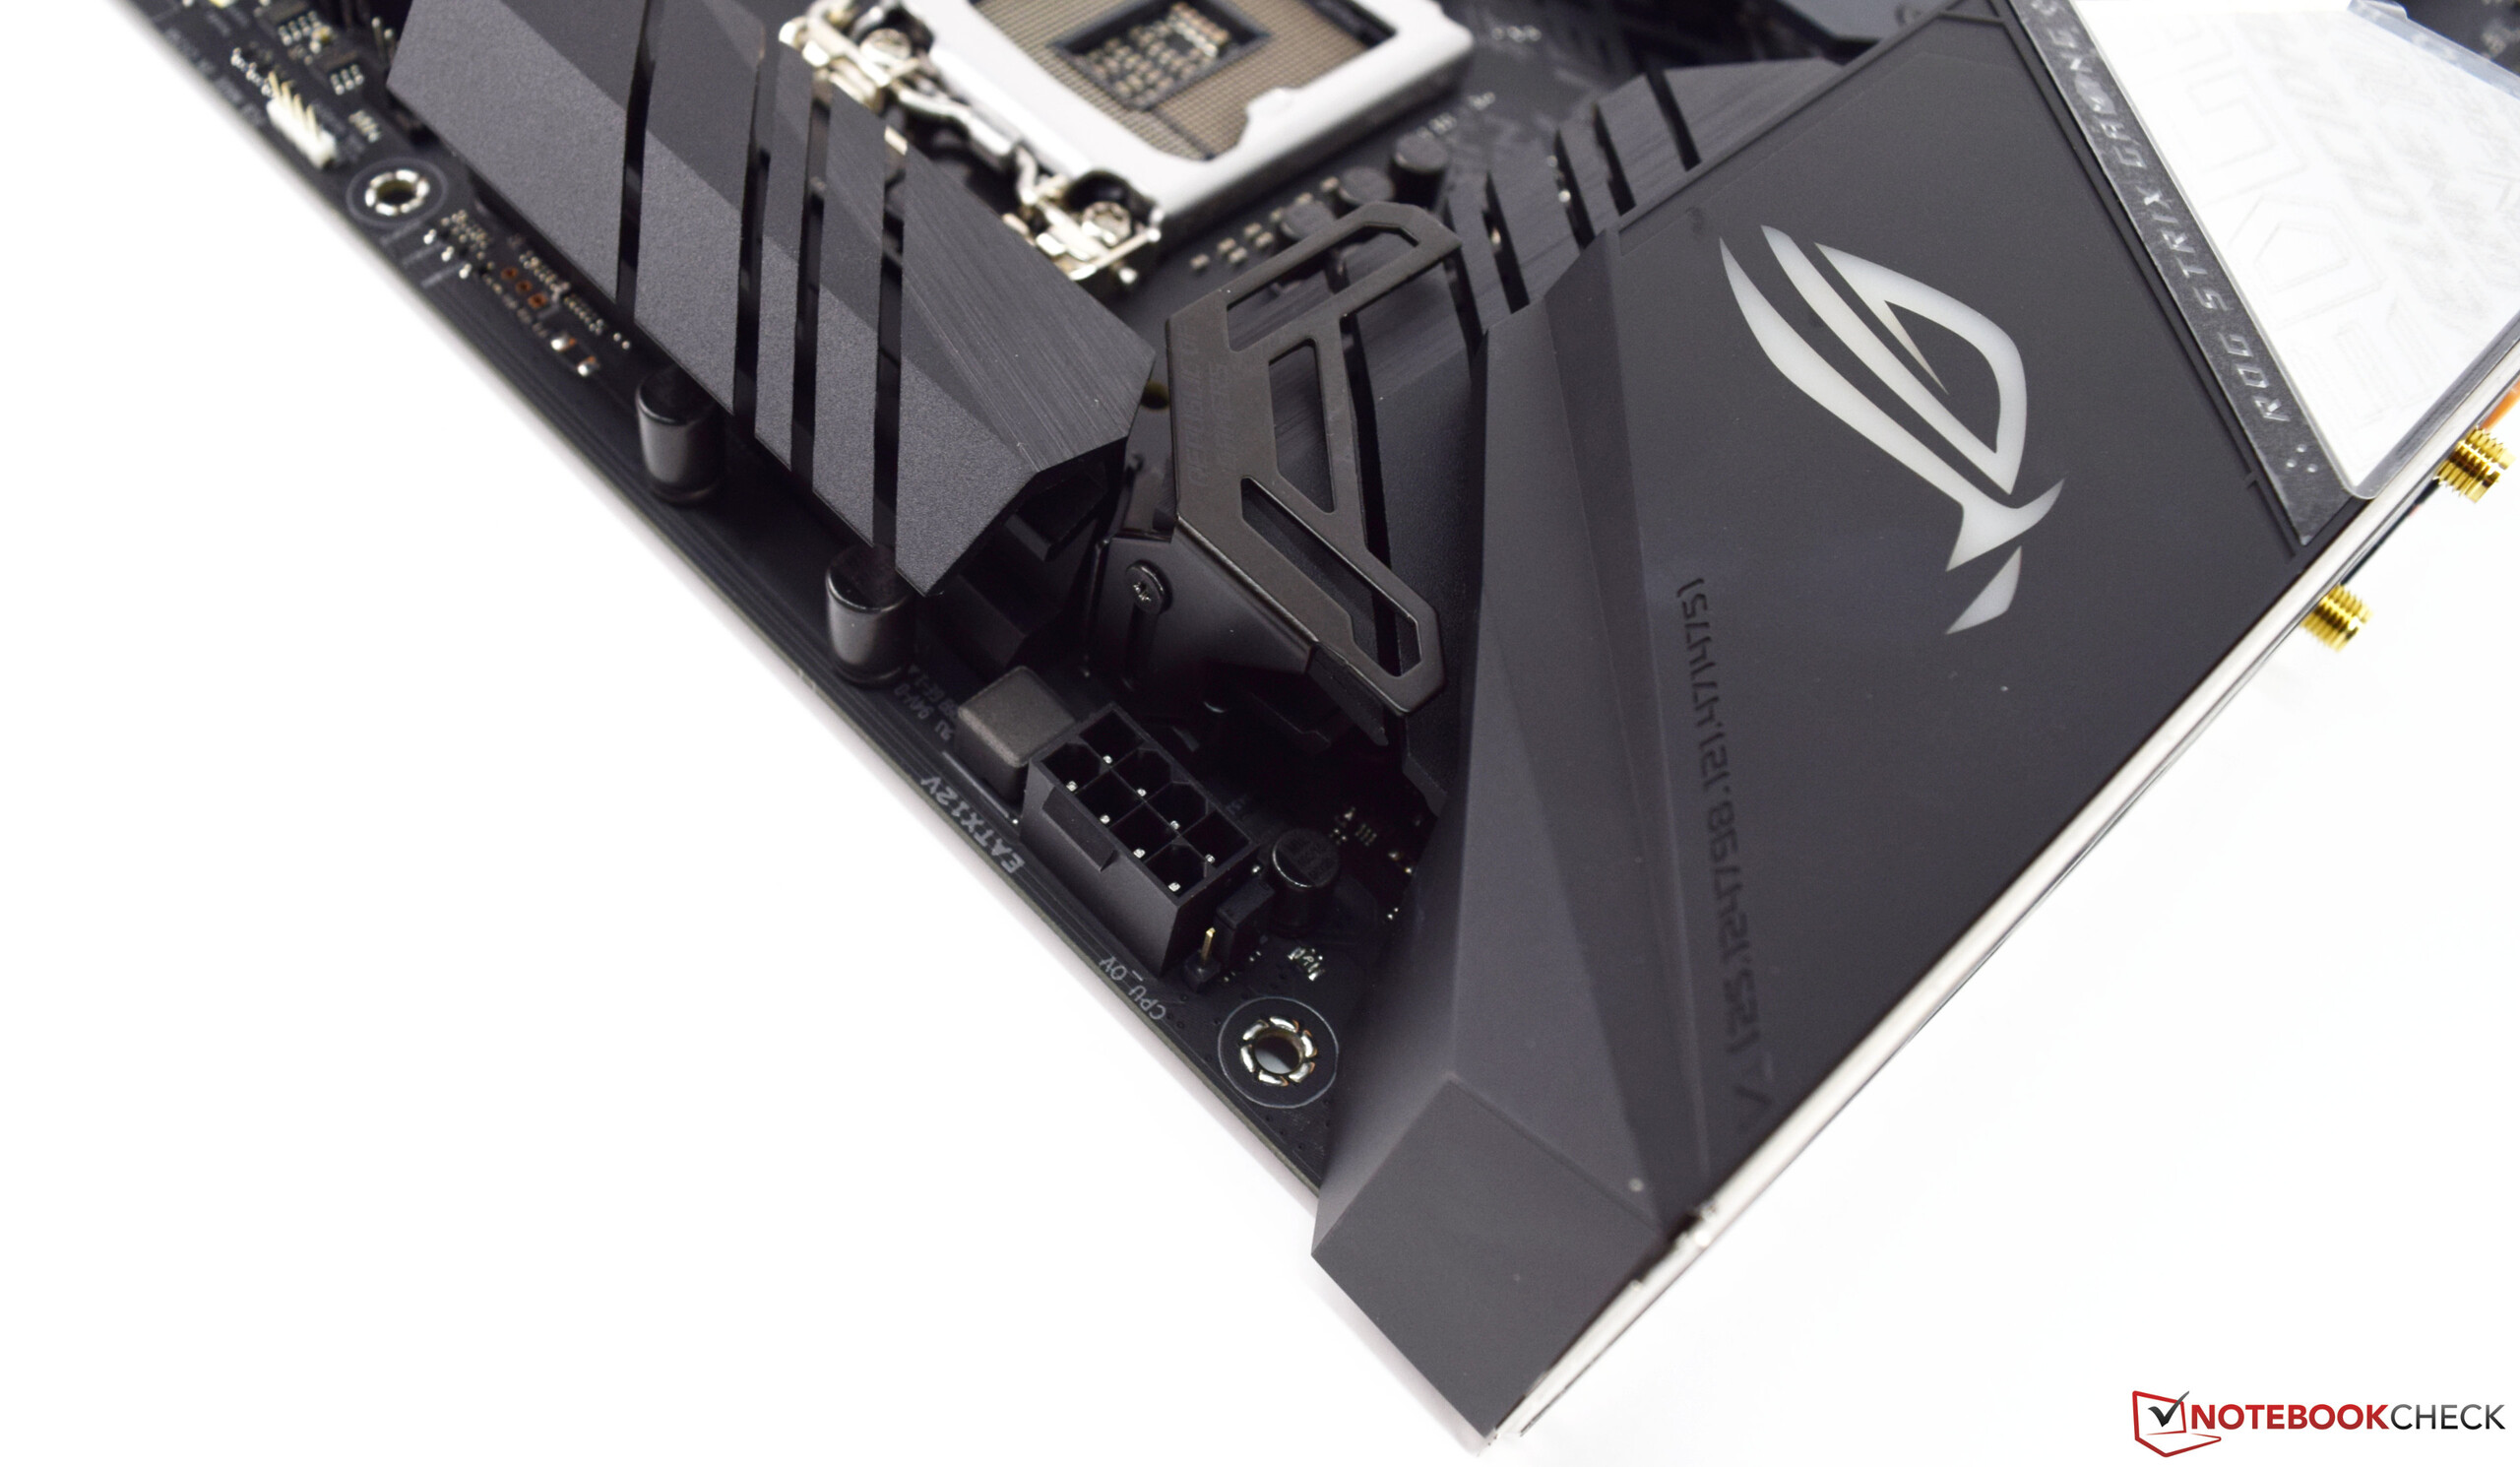
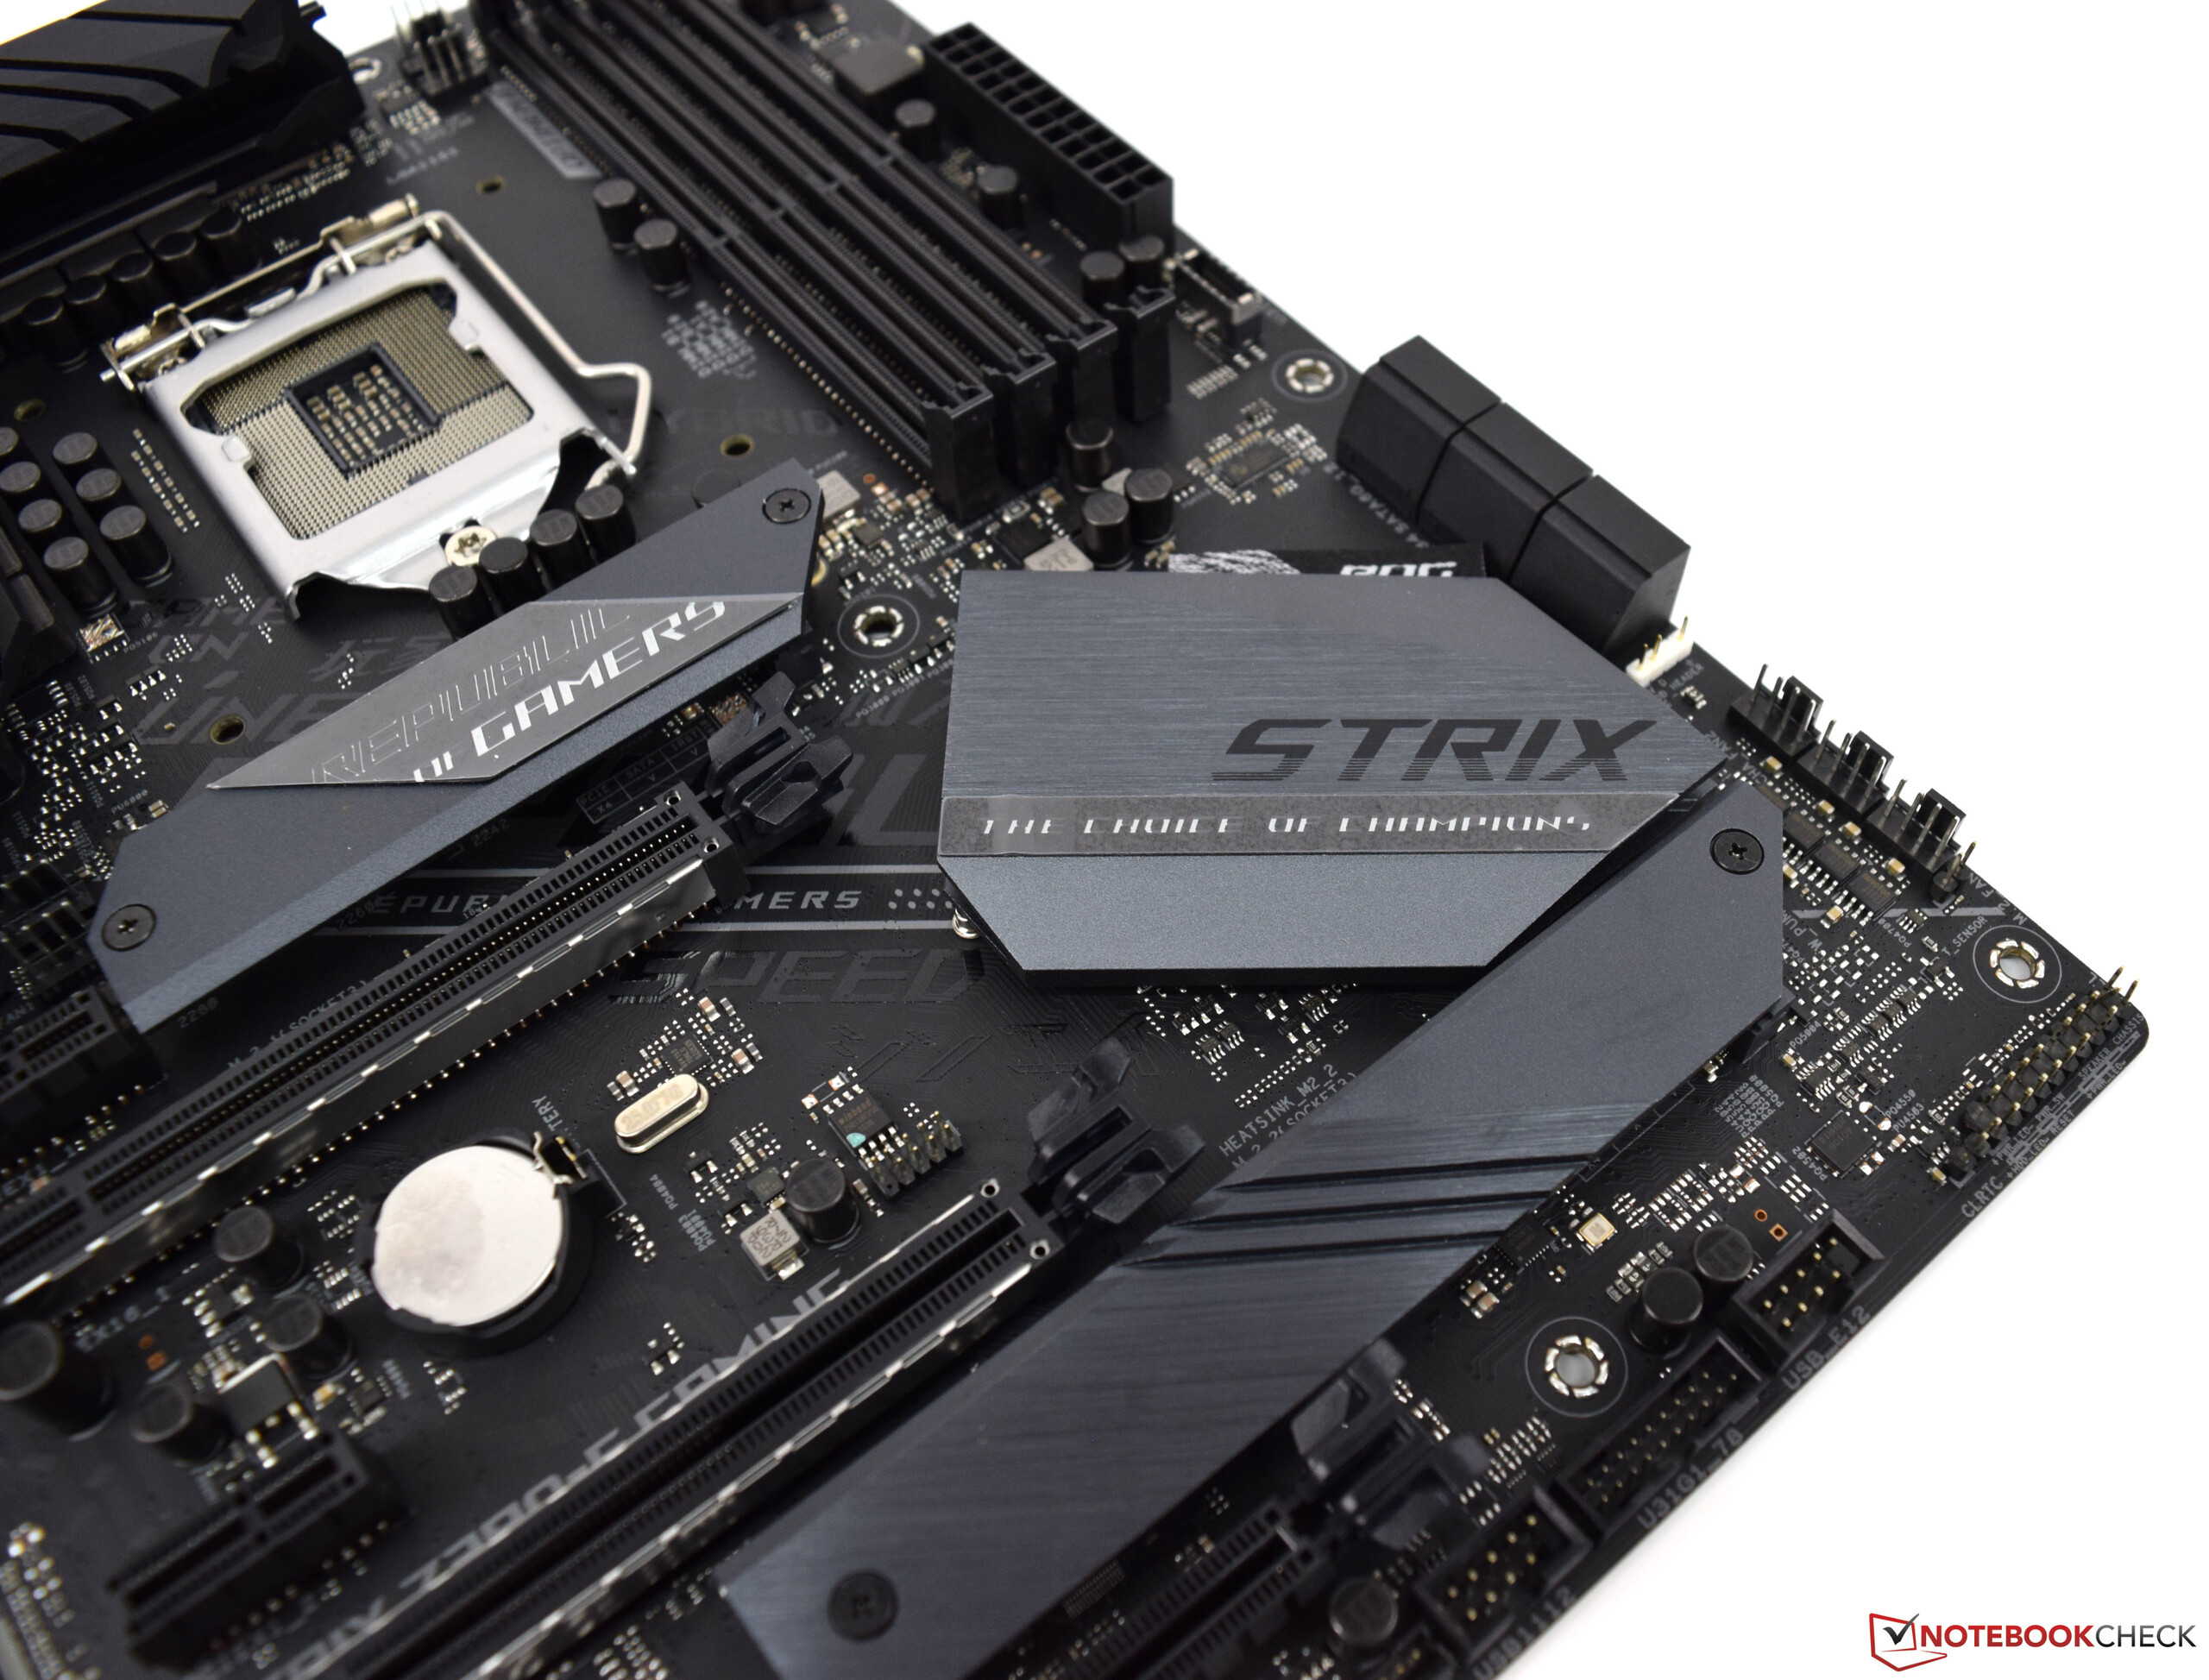
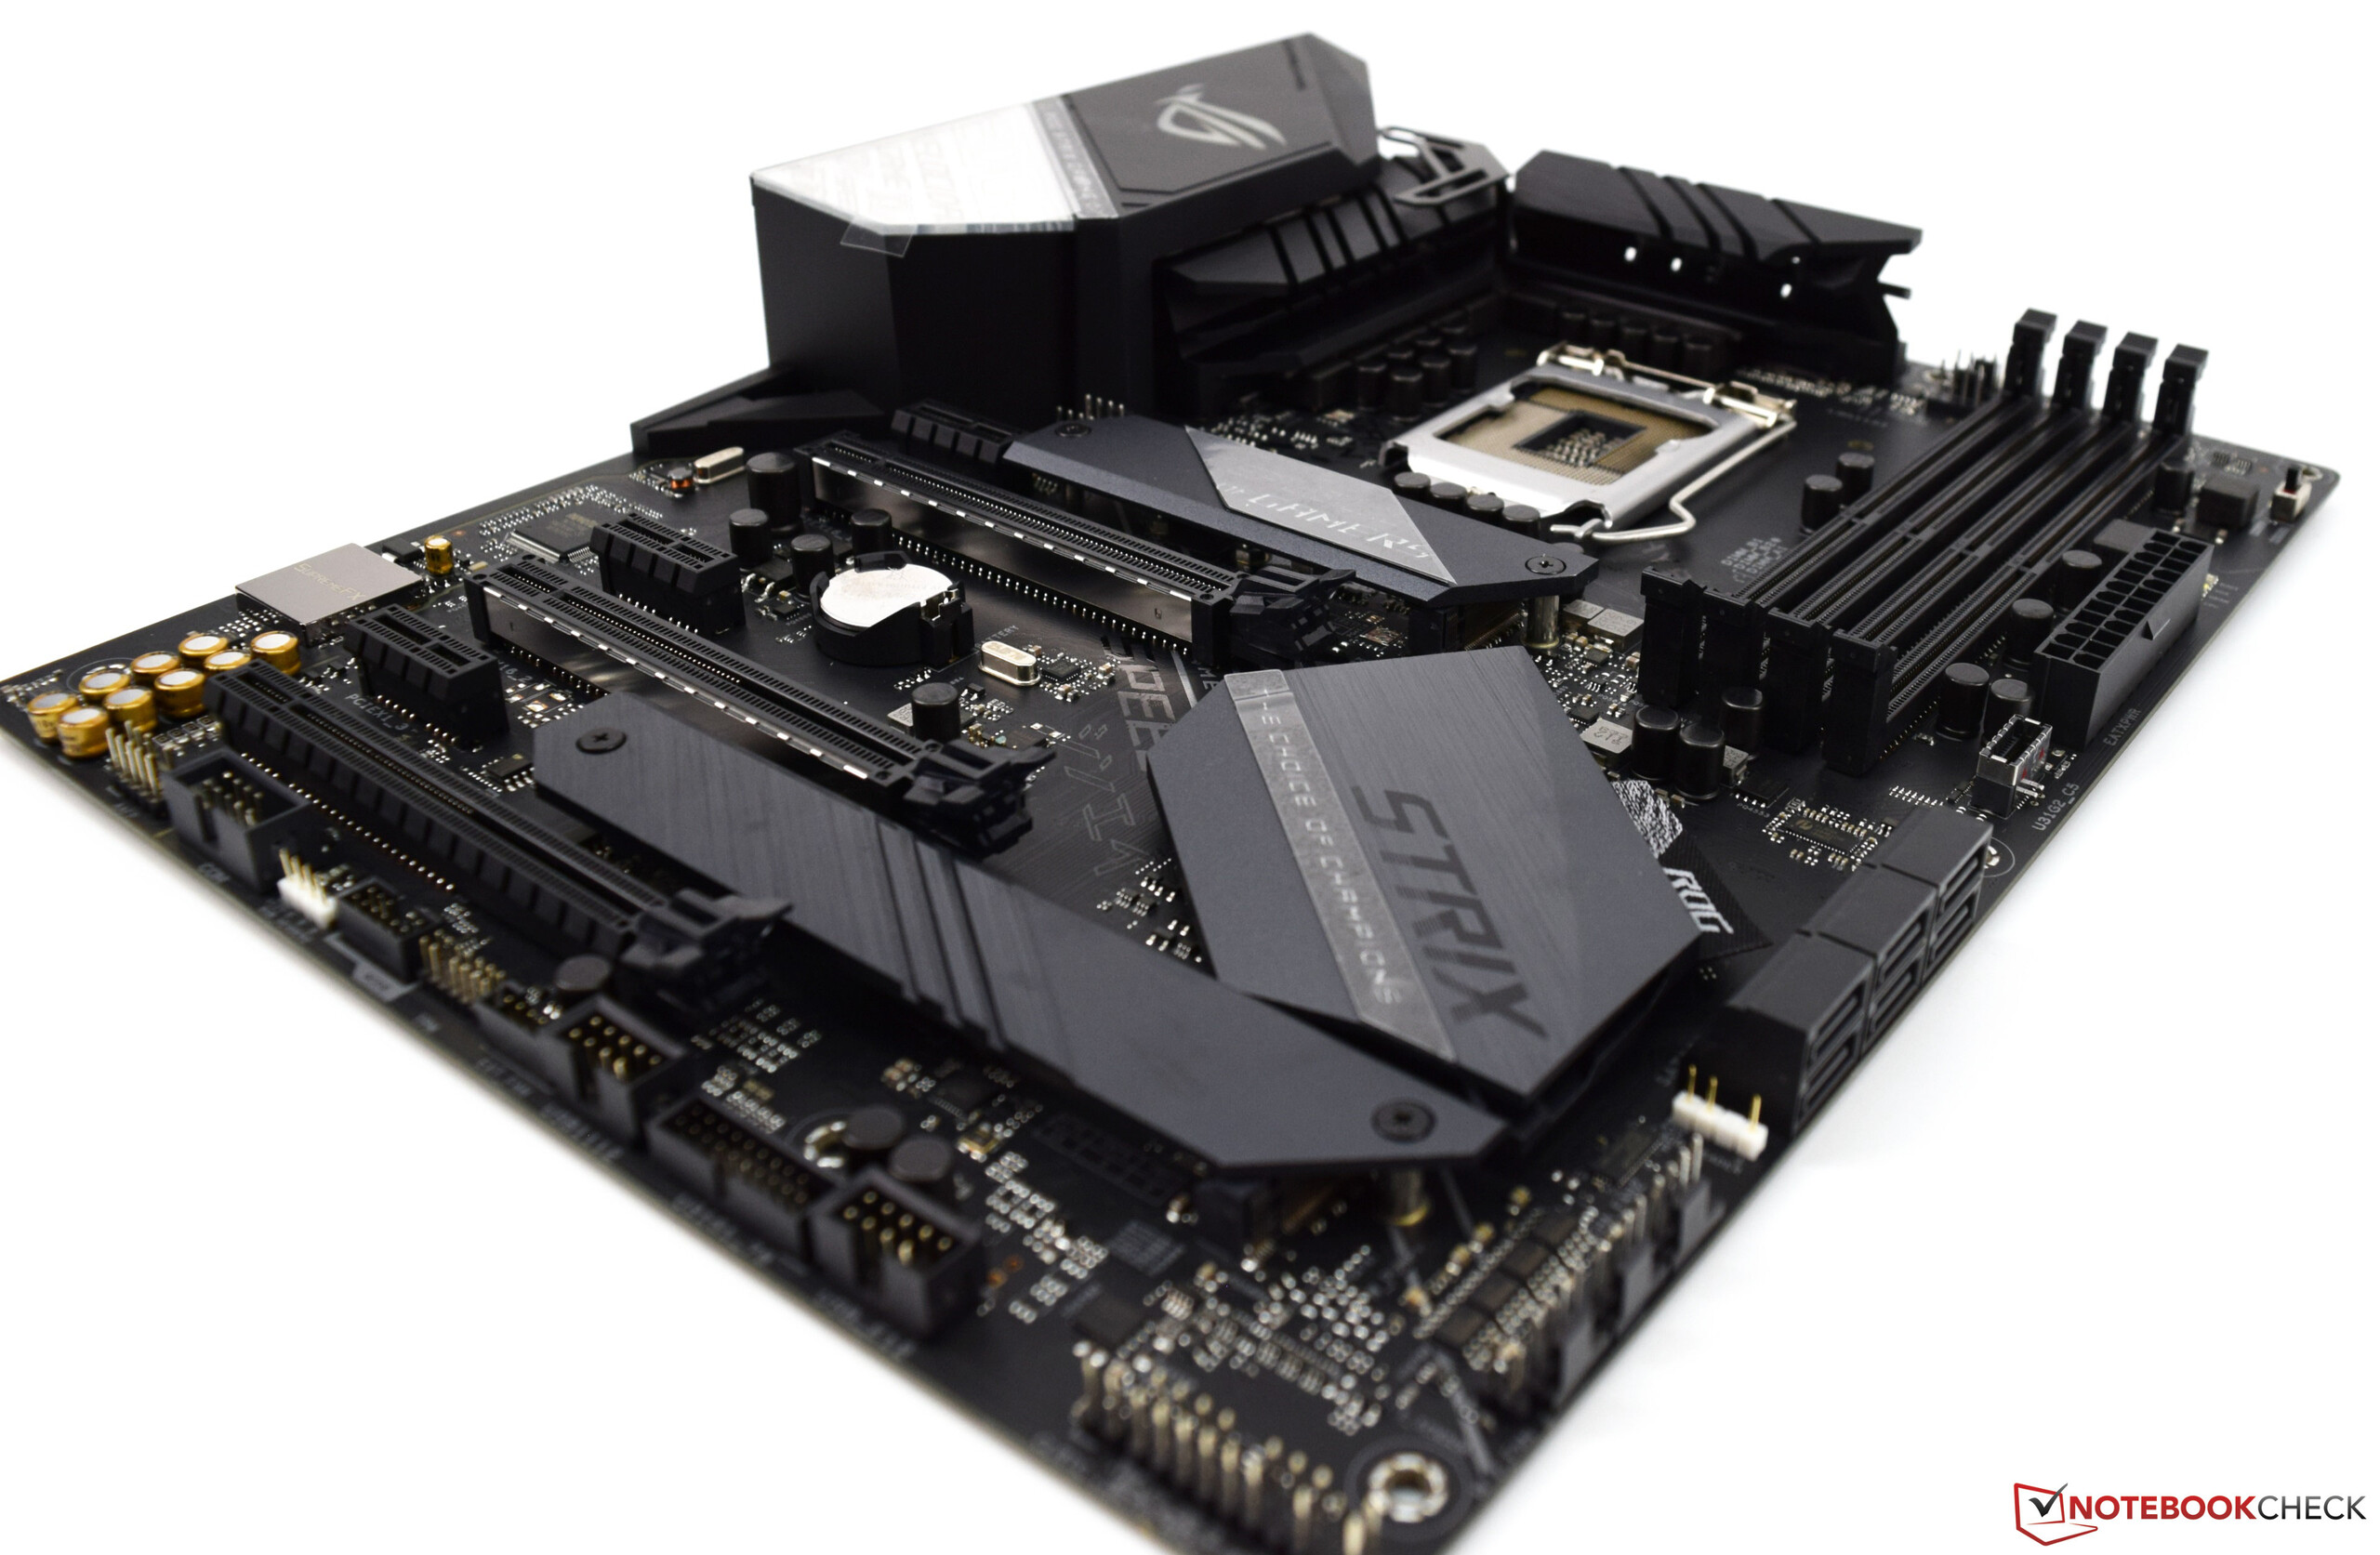
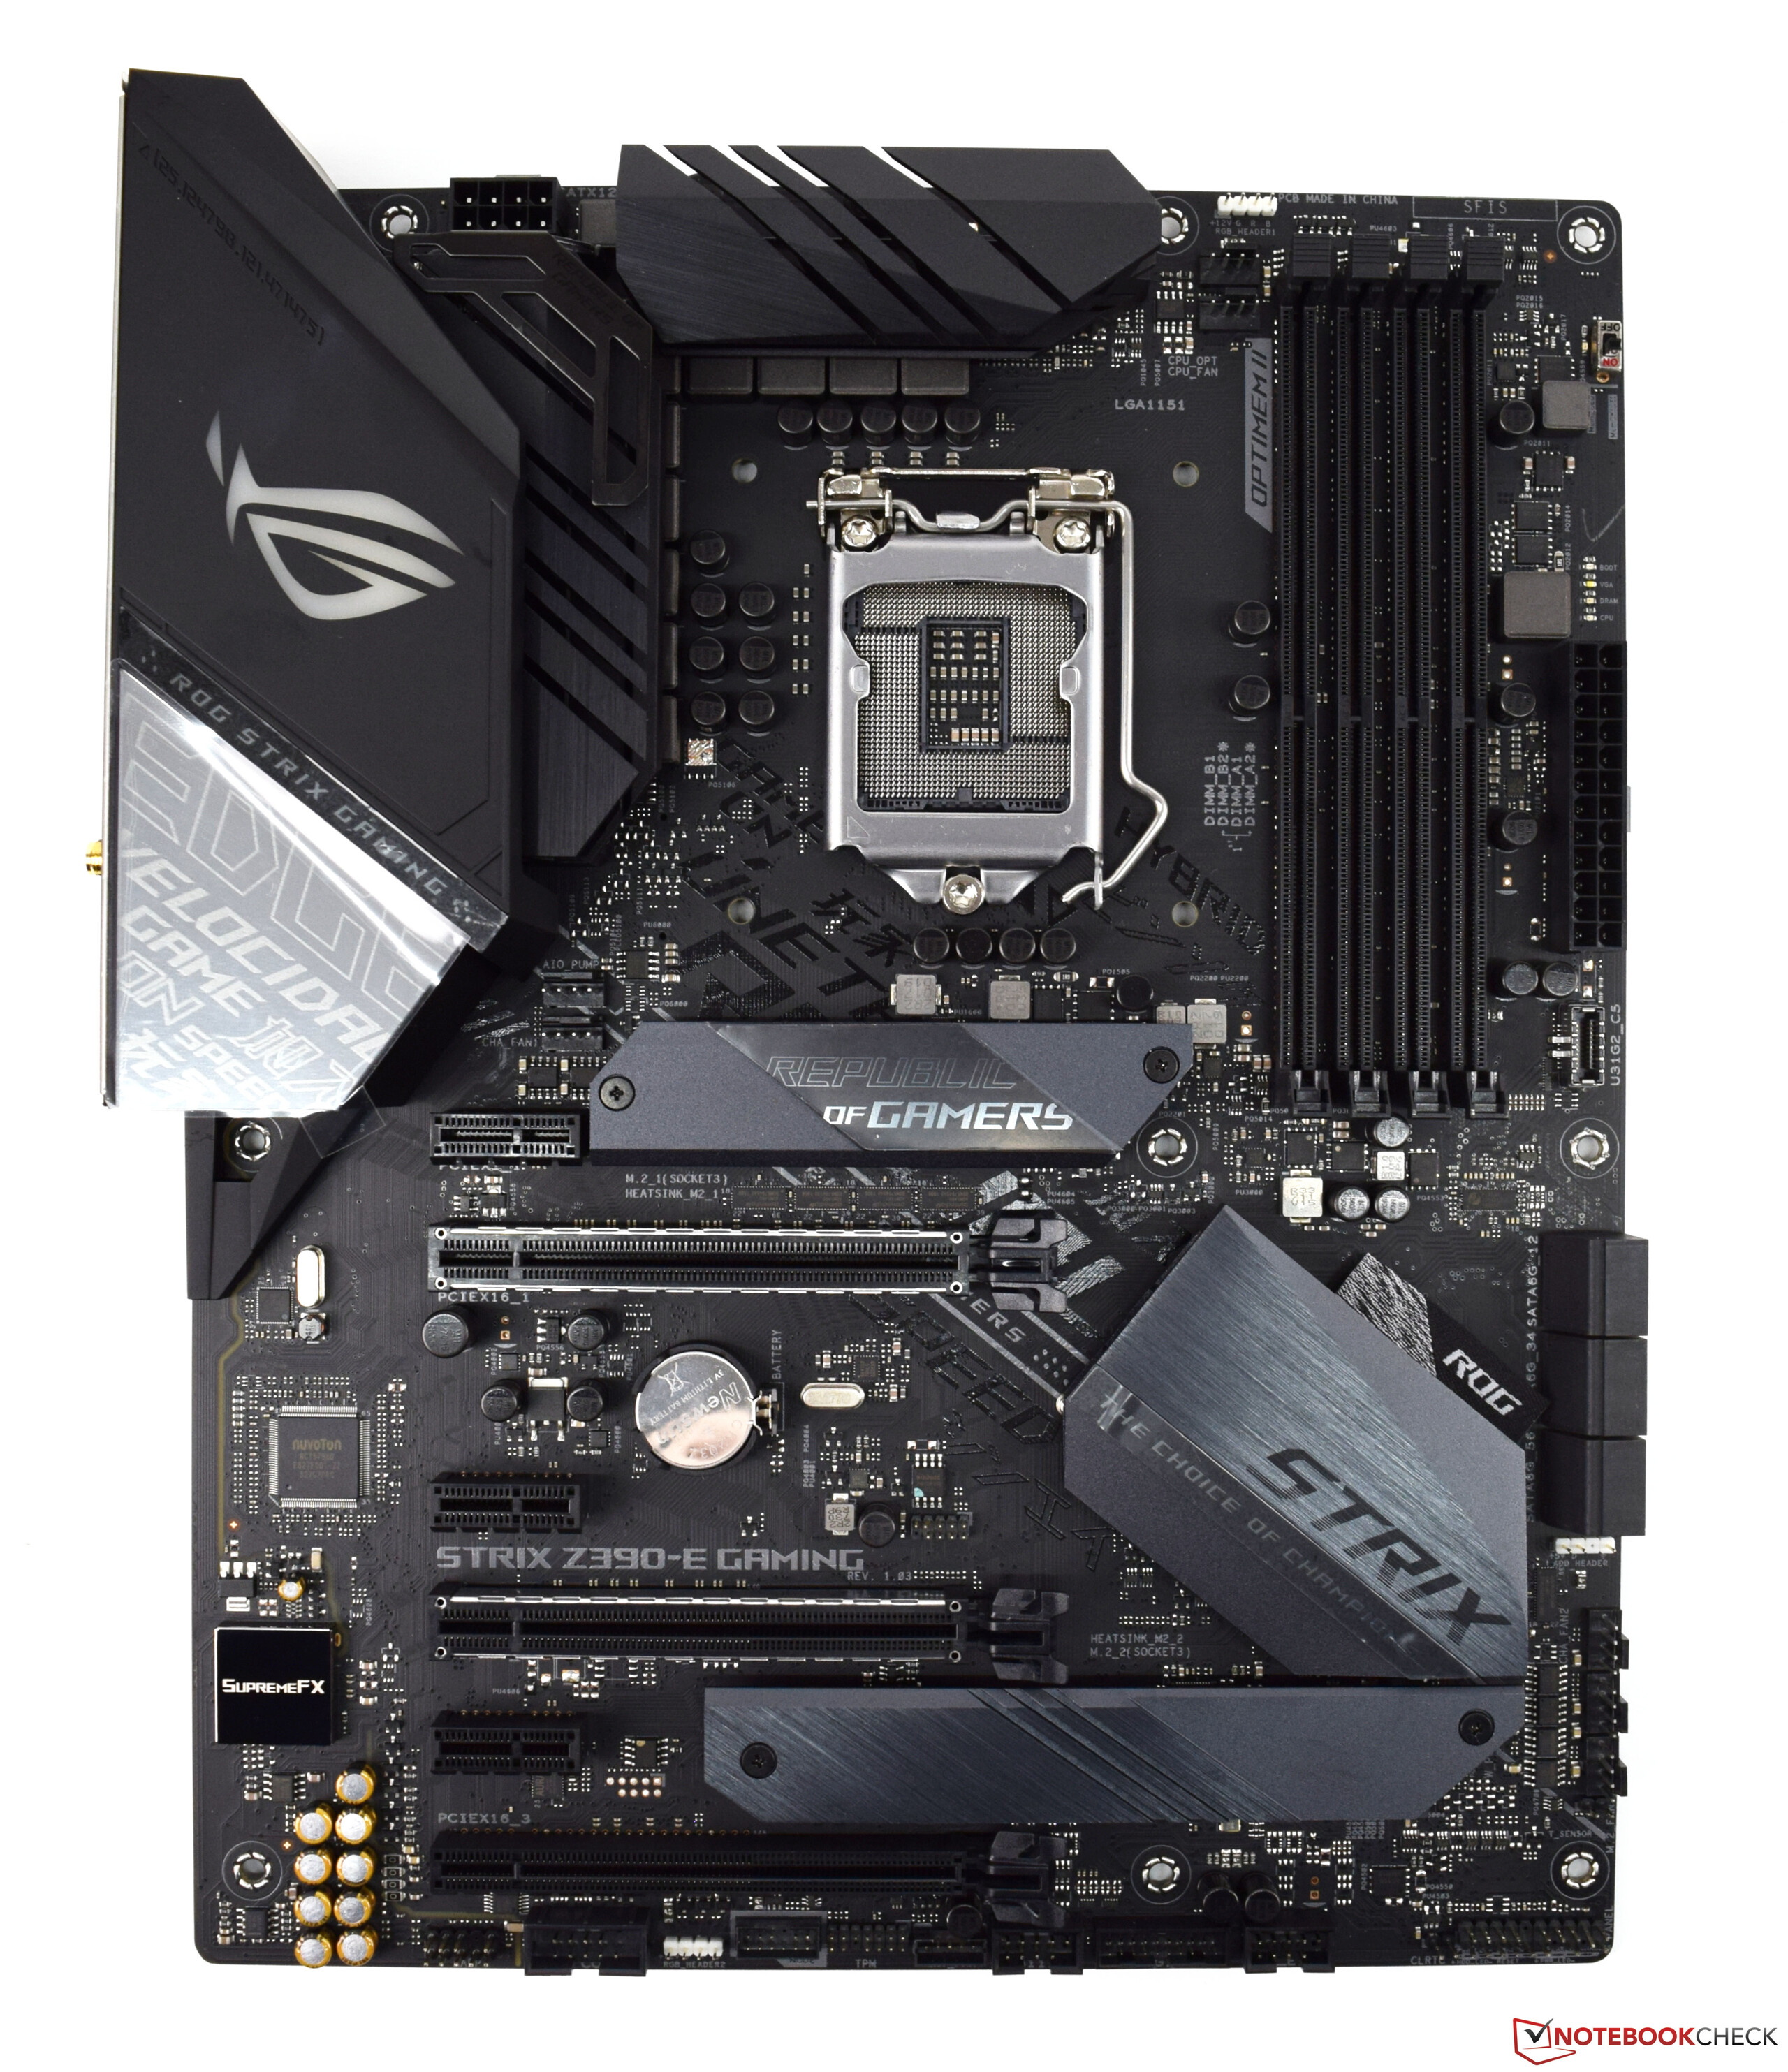
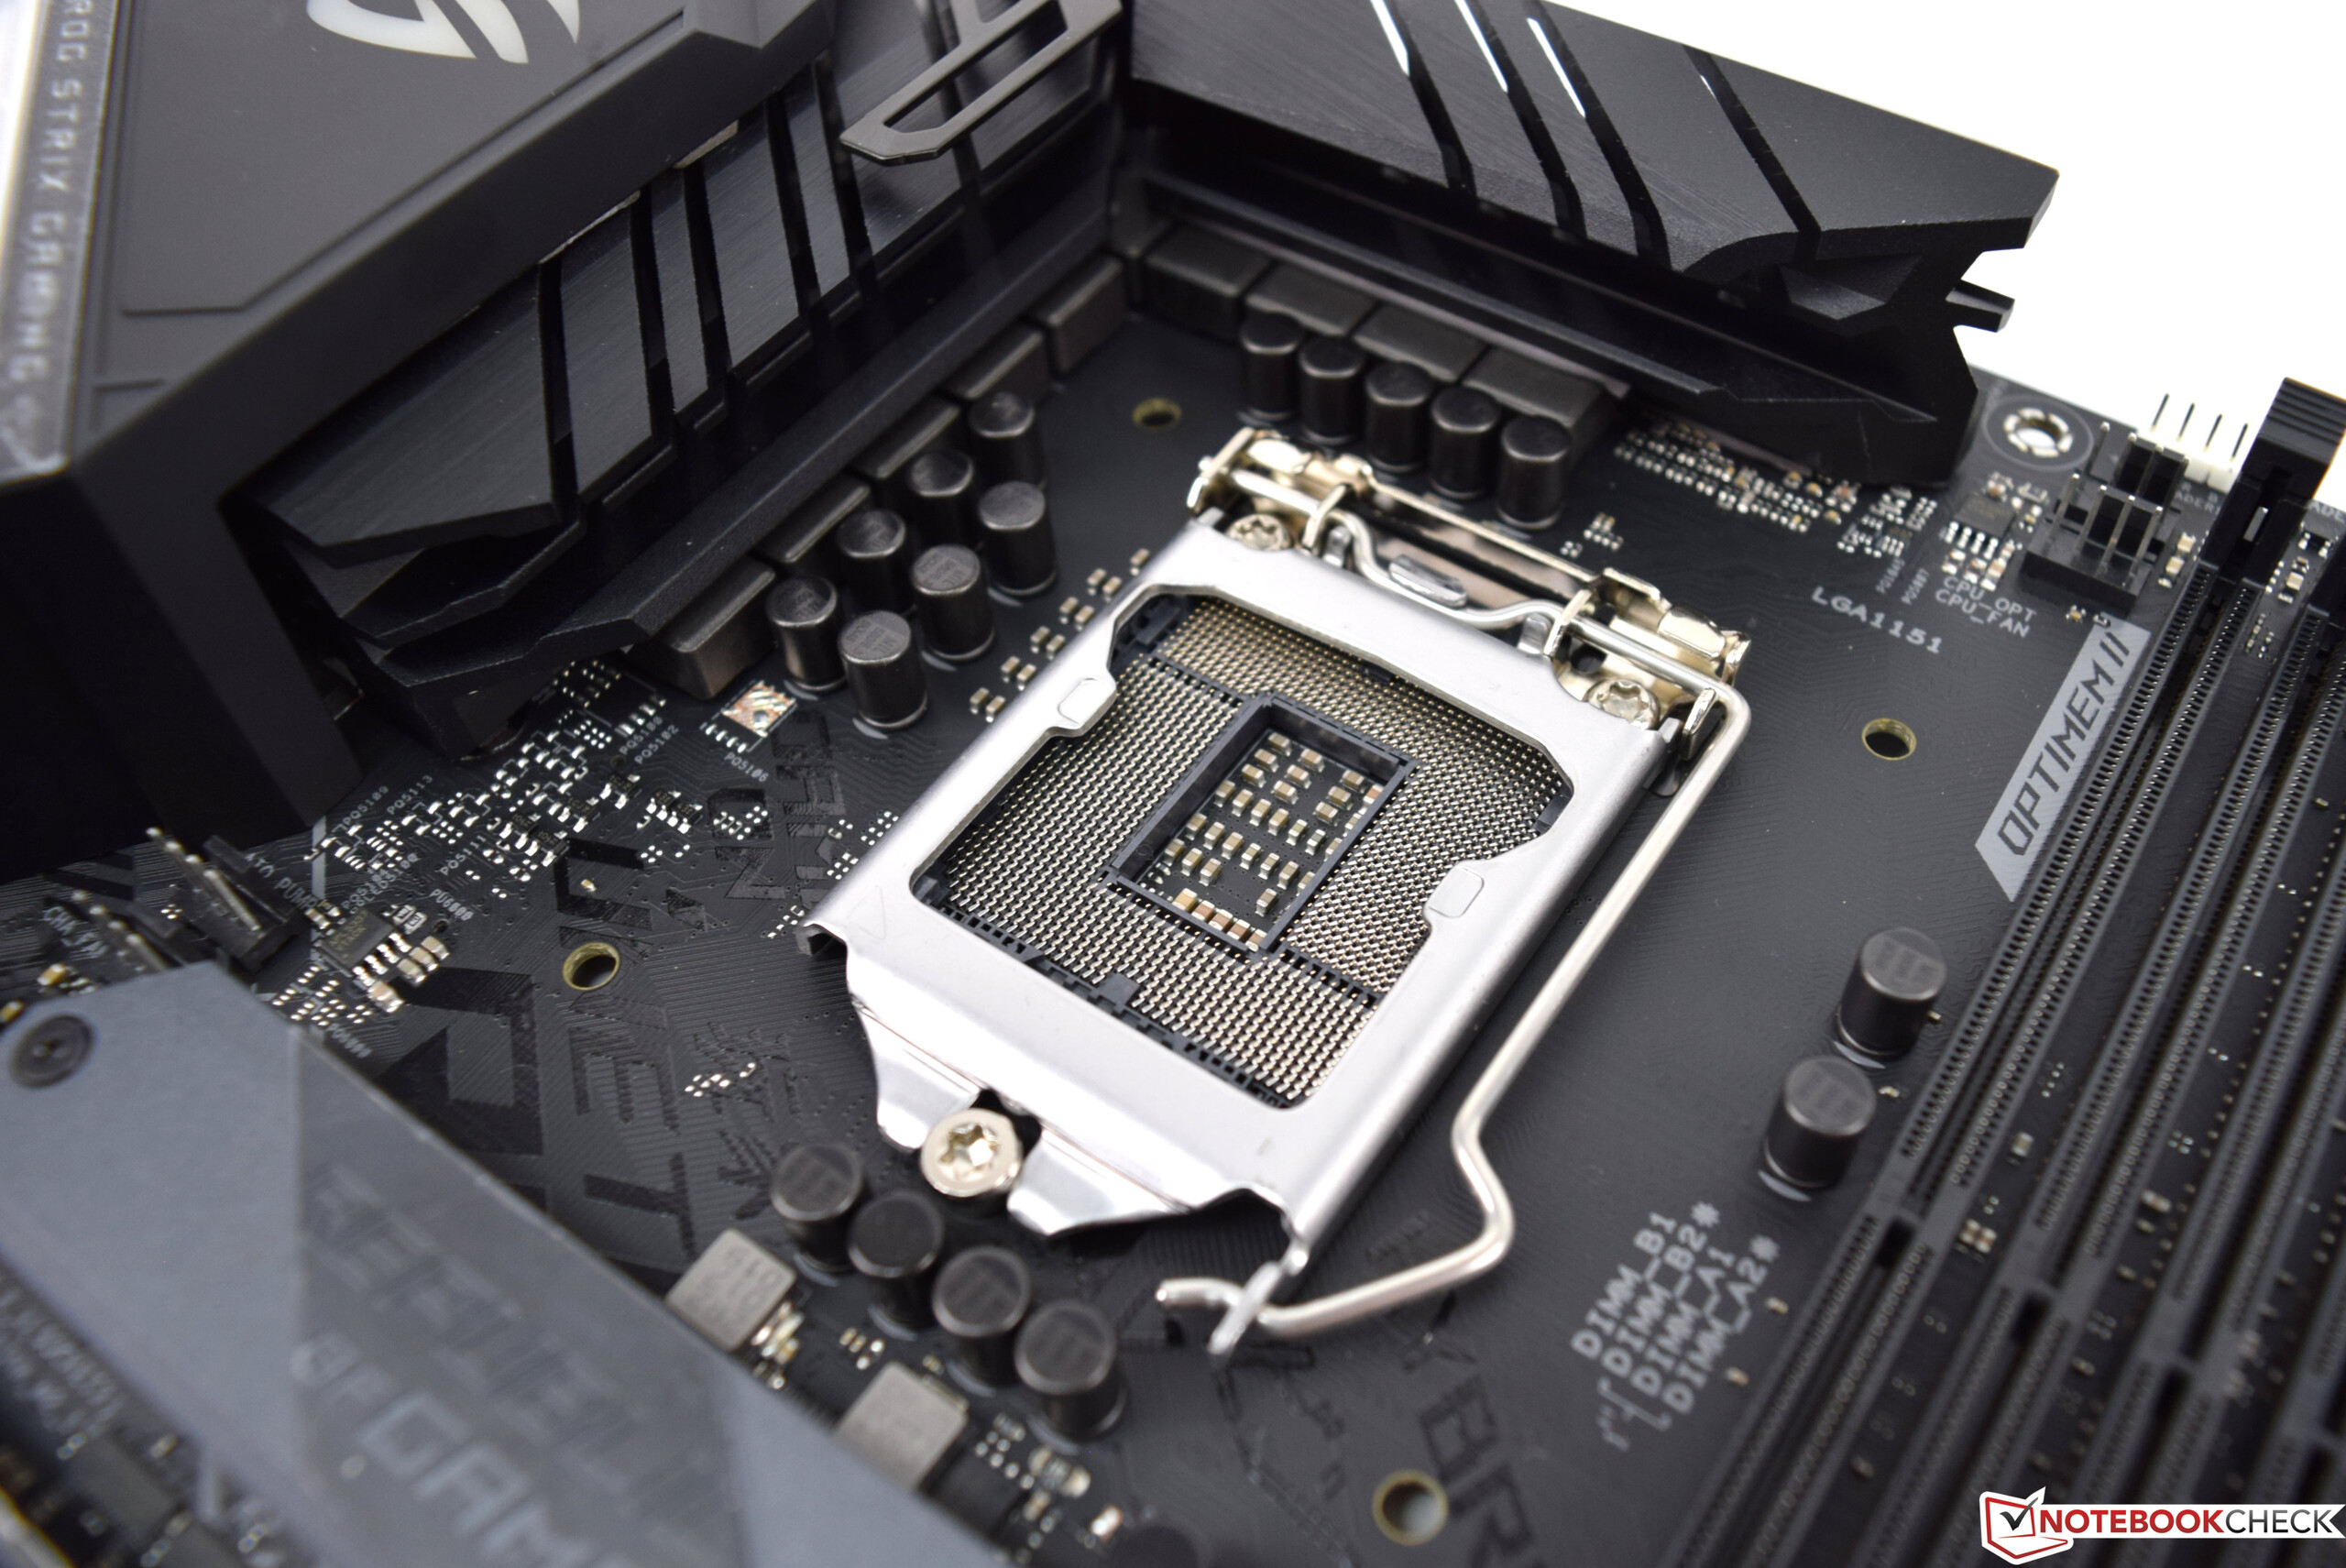
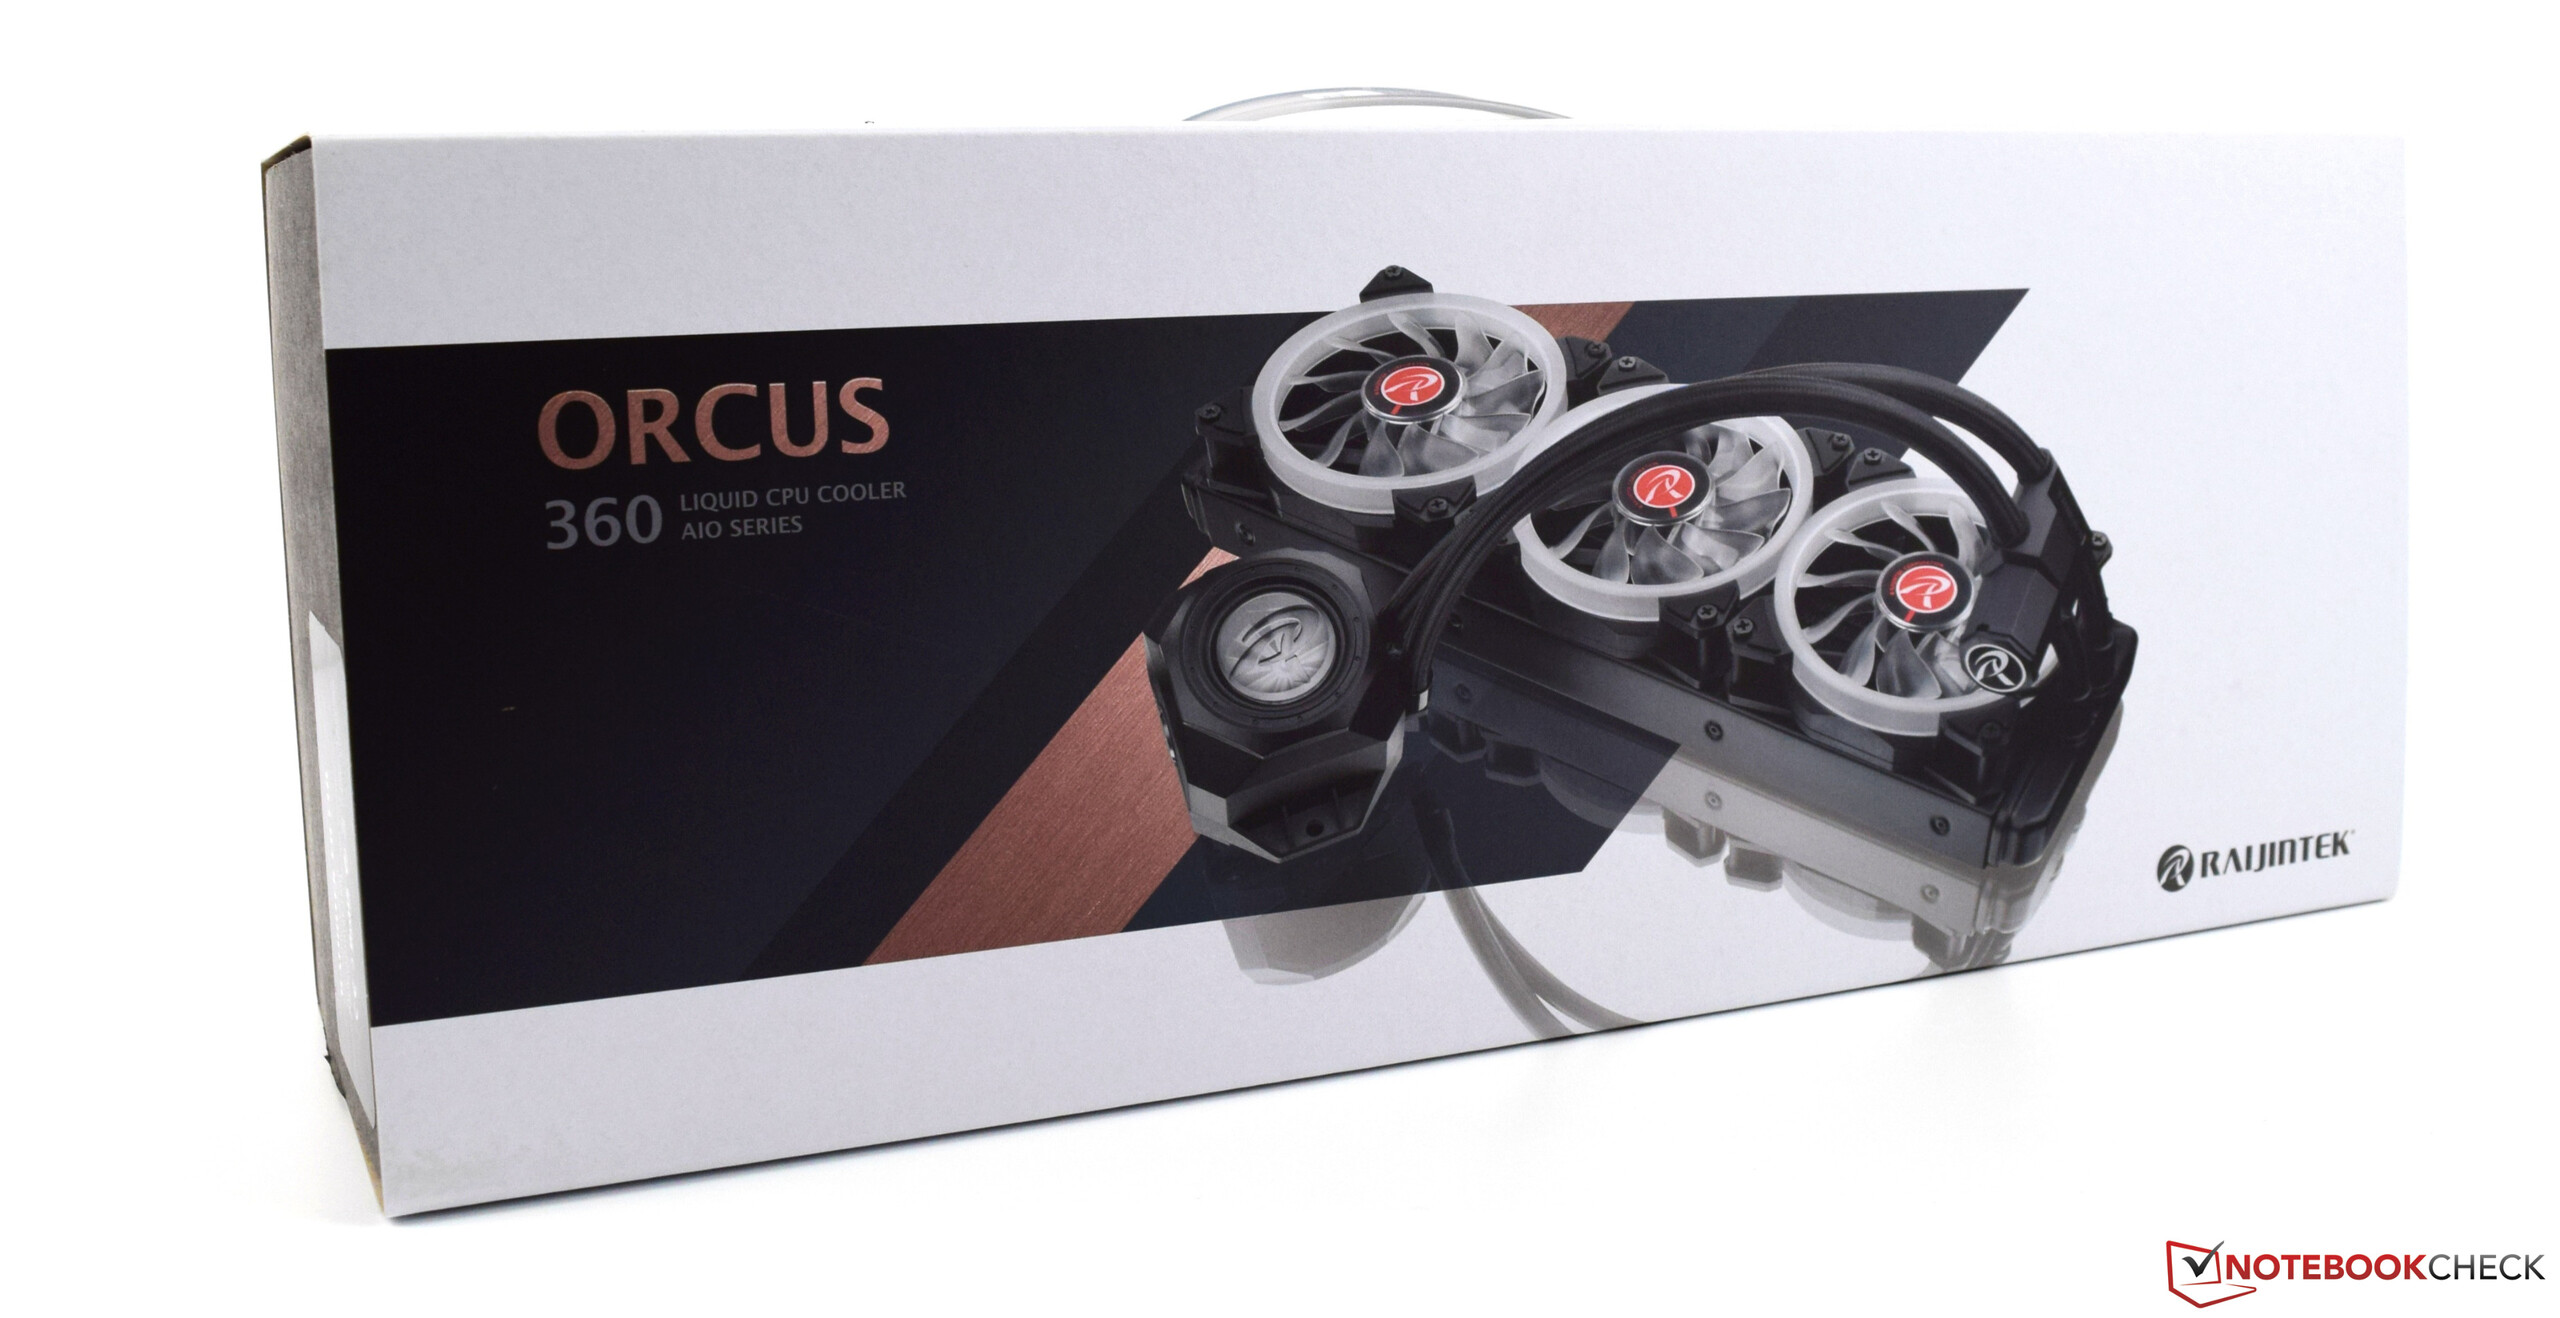
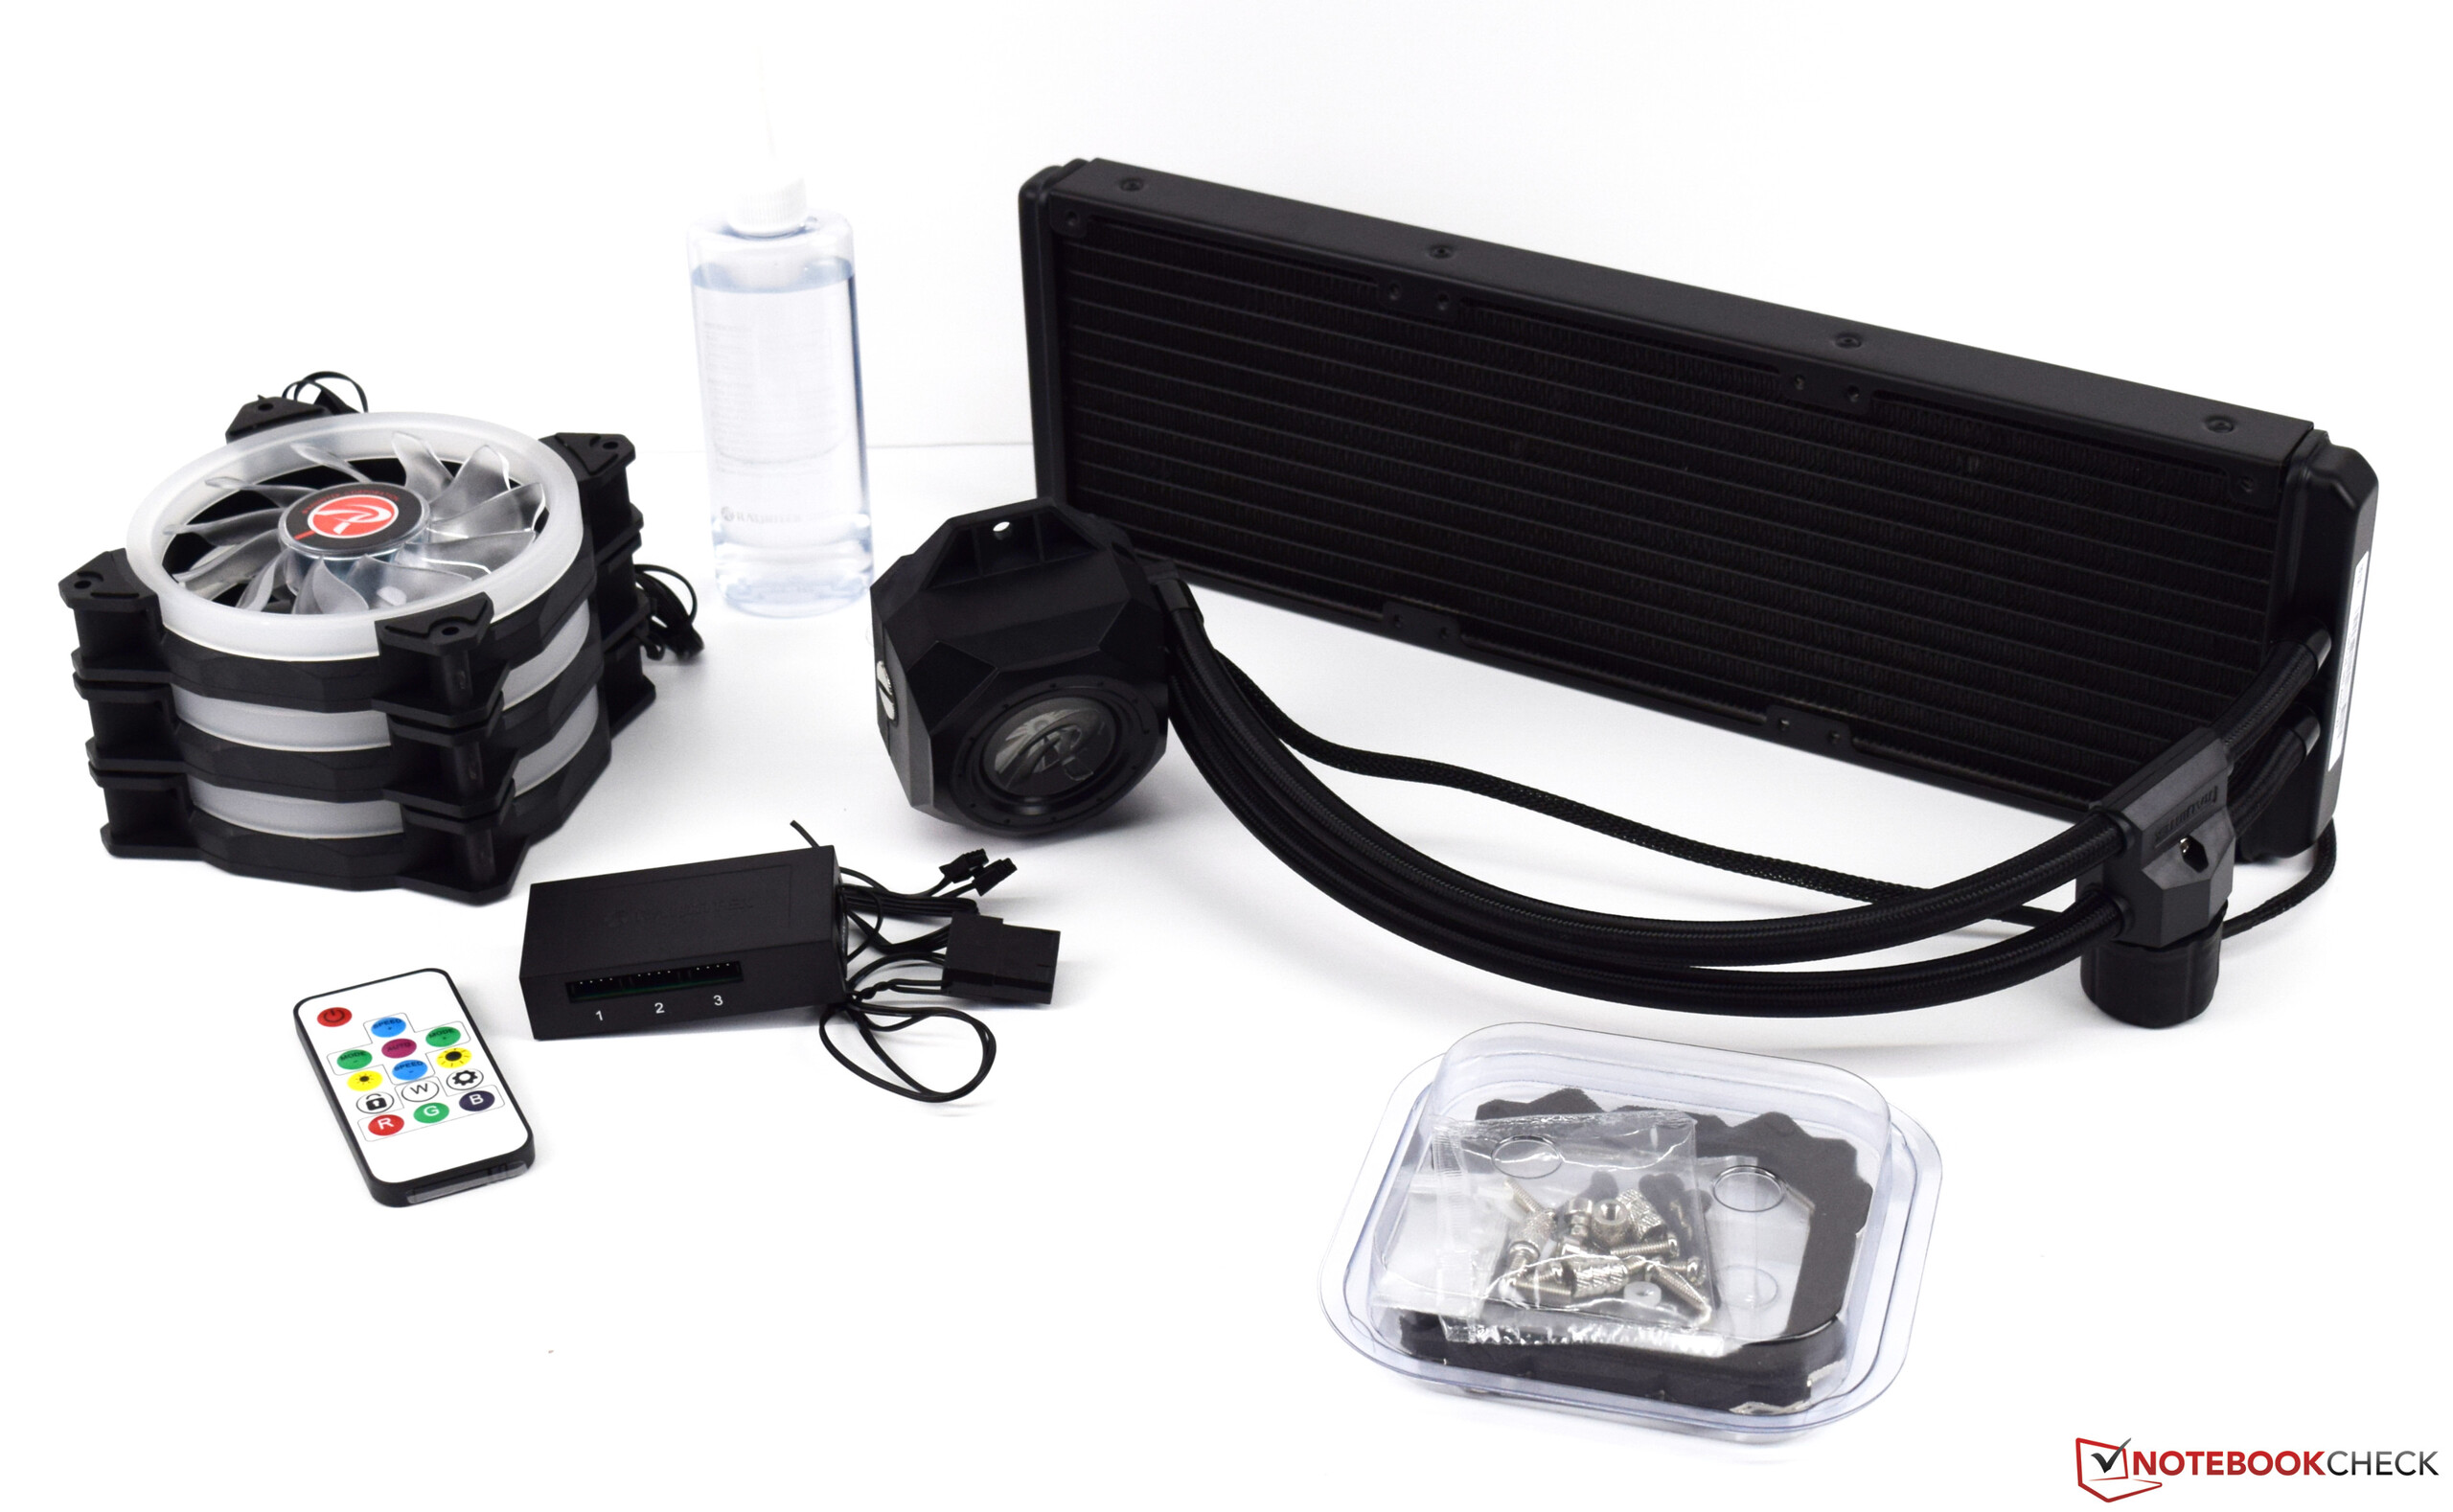
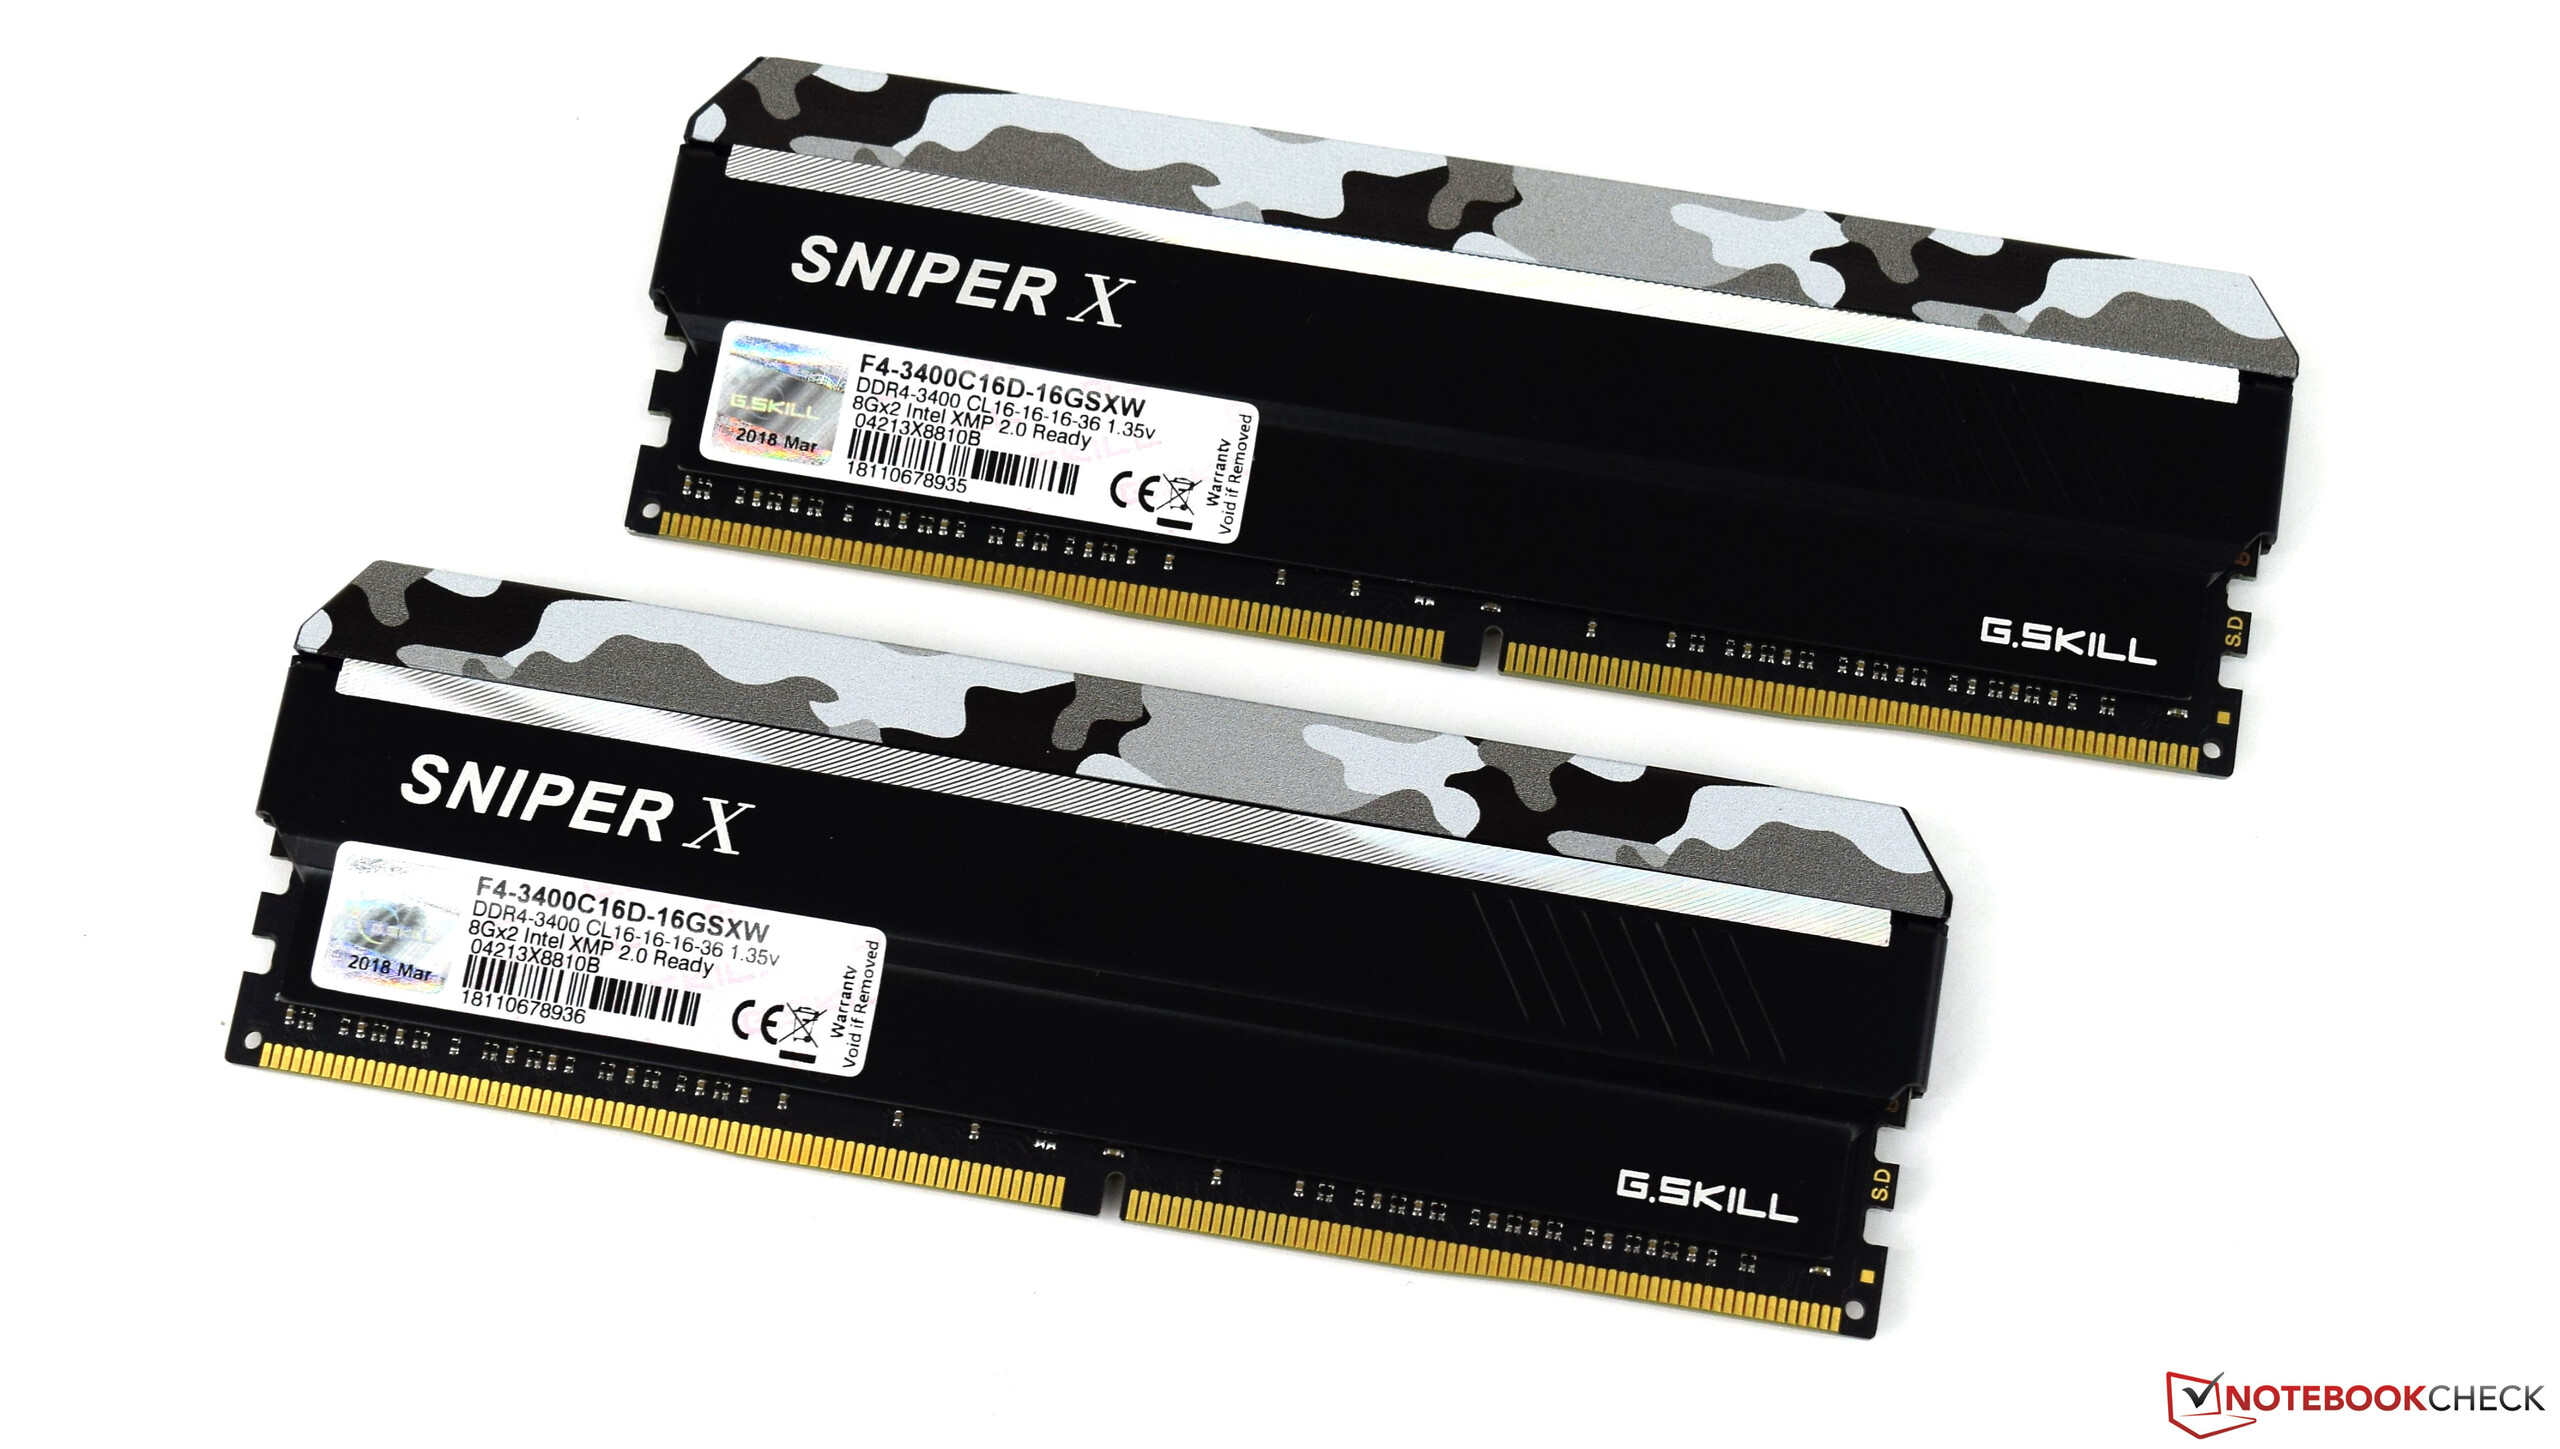
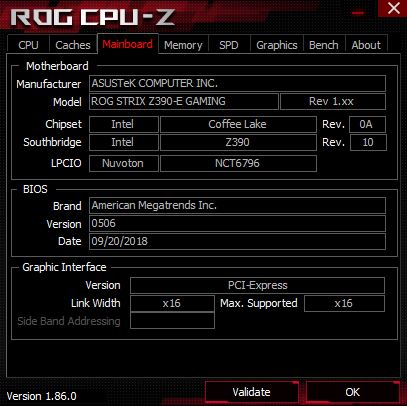
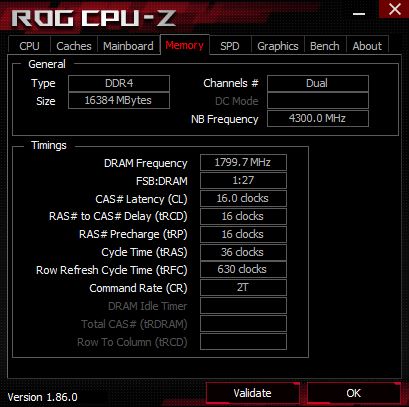
We paired the Core i9-9900K with an ASUS ROG Strix Z390-E Gaming motherboard and 16 GB of G-Skill DDR4 RAM for our tests. We set the RAM, which clocks at 3,200 MHz, to the XMP profile in the BIOS. We left all other values at their factory settings and only made changes when overclocking. Caseking kindly sent us a Raijintek AIO, which has three 120 mm fans, and a matching Raijintek case.
We used the same graphics card and RAM to test the Core i9-9900K as we did with the Ryzen 7 2700X to ensure a fair comparison between the two processors. We have included the GPU’s and RAM’s power consumption in the corresponding section.
ASUS, Caseking and Intel provided the following hardware for our Core i9-9900K benchmarks and tests:
- Intel Core i9-9900K
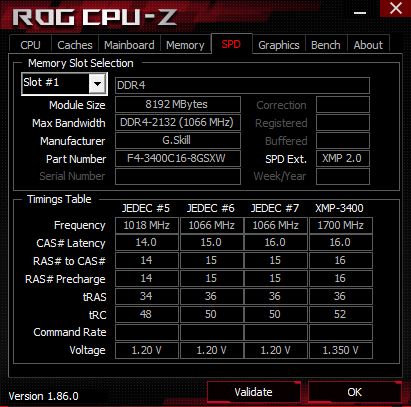
- ASUS ROG Strix Z390-E Gaming (BIOS 0506, Default Settings, XMP 1 for DDR4-3200)
- G-Skill Sniper X DDR4-3400 2 x 8 GB Kit
- Raijintek Orcus 360 (AIO)
- Case: Raijintek PEAN Benchtable
We also used the following additional hardware in our test system:
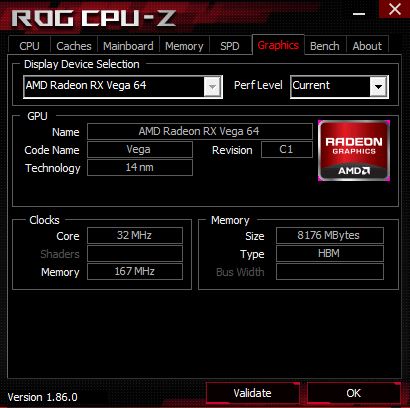
- XFX AMD Radeon RX Vega 64
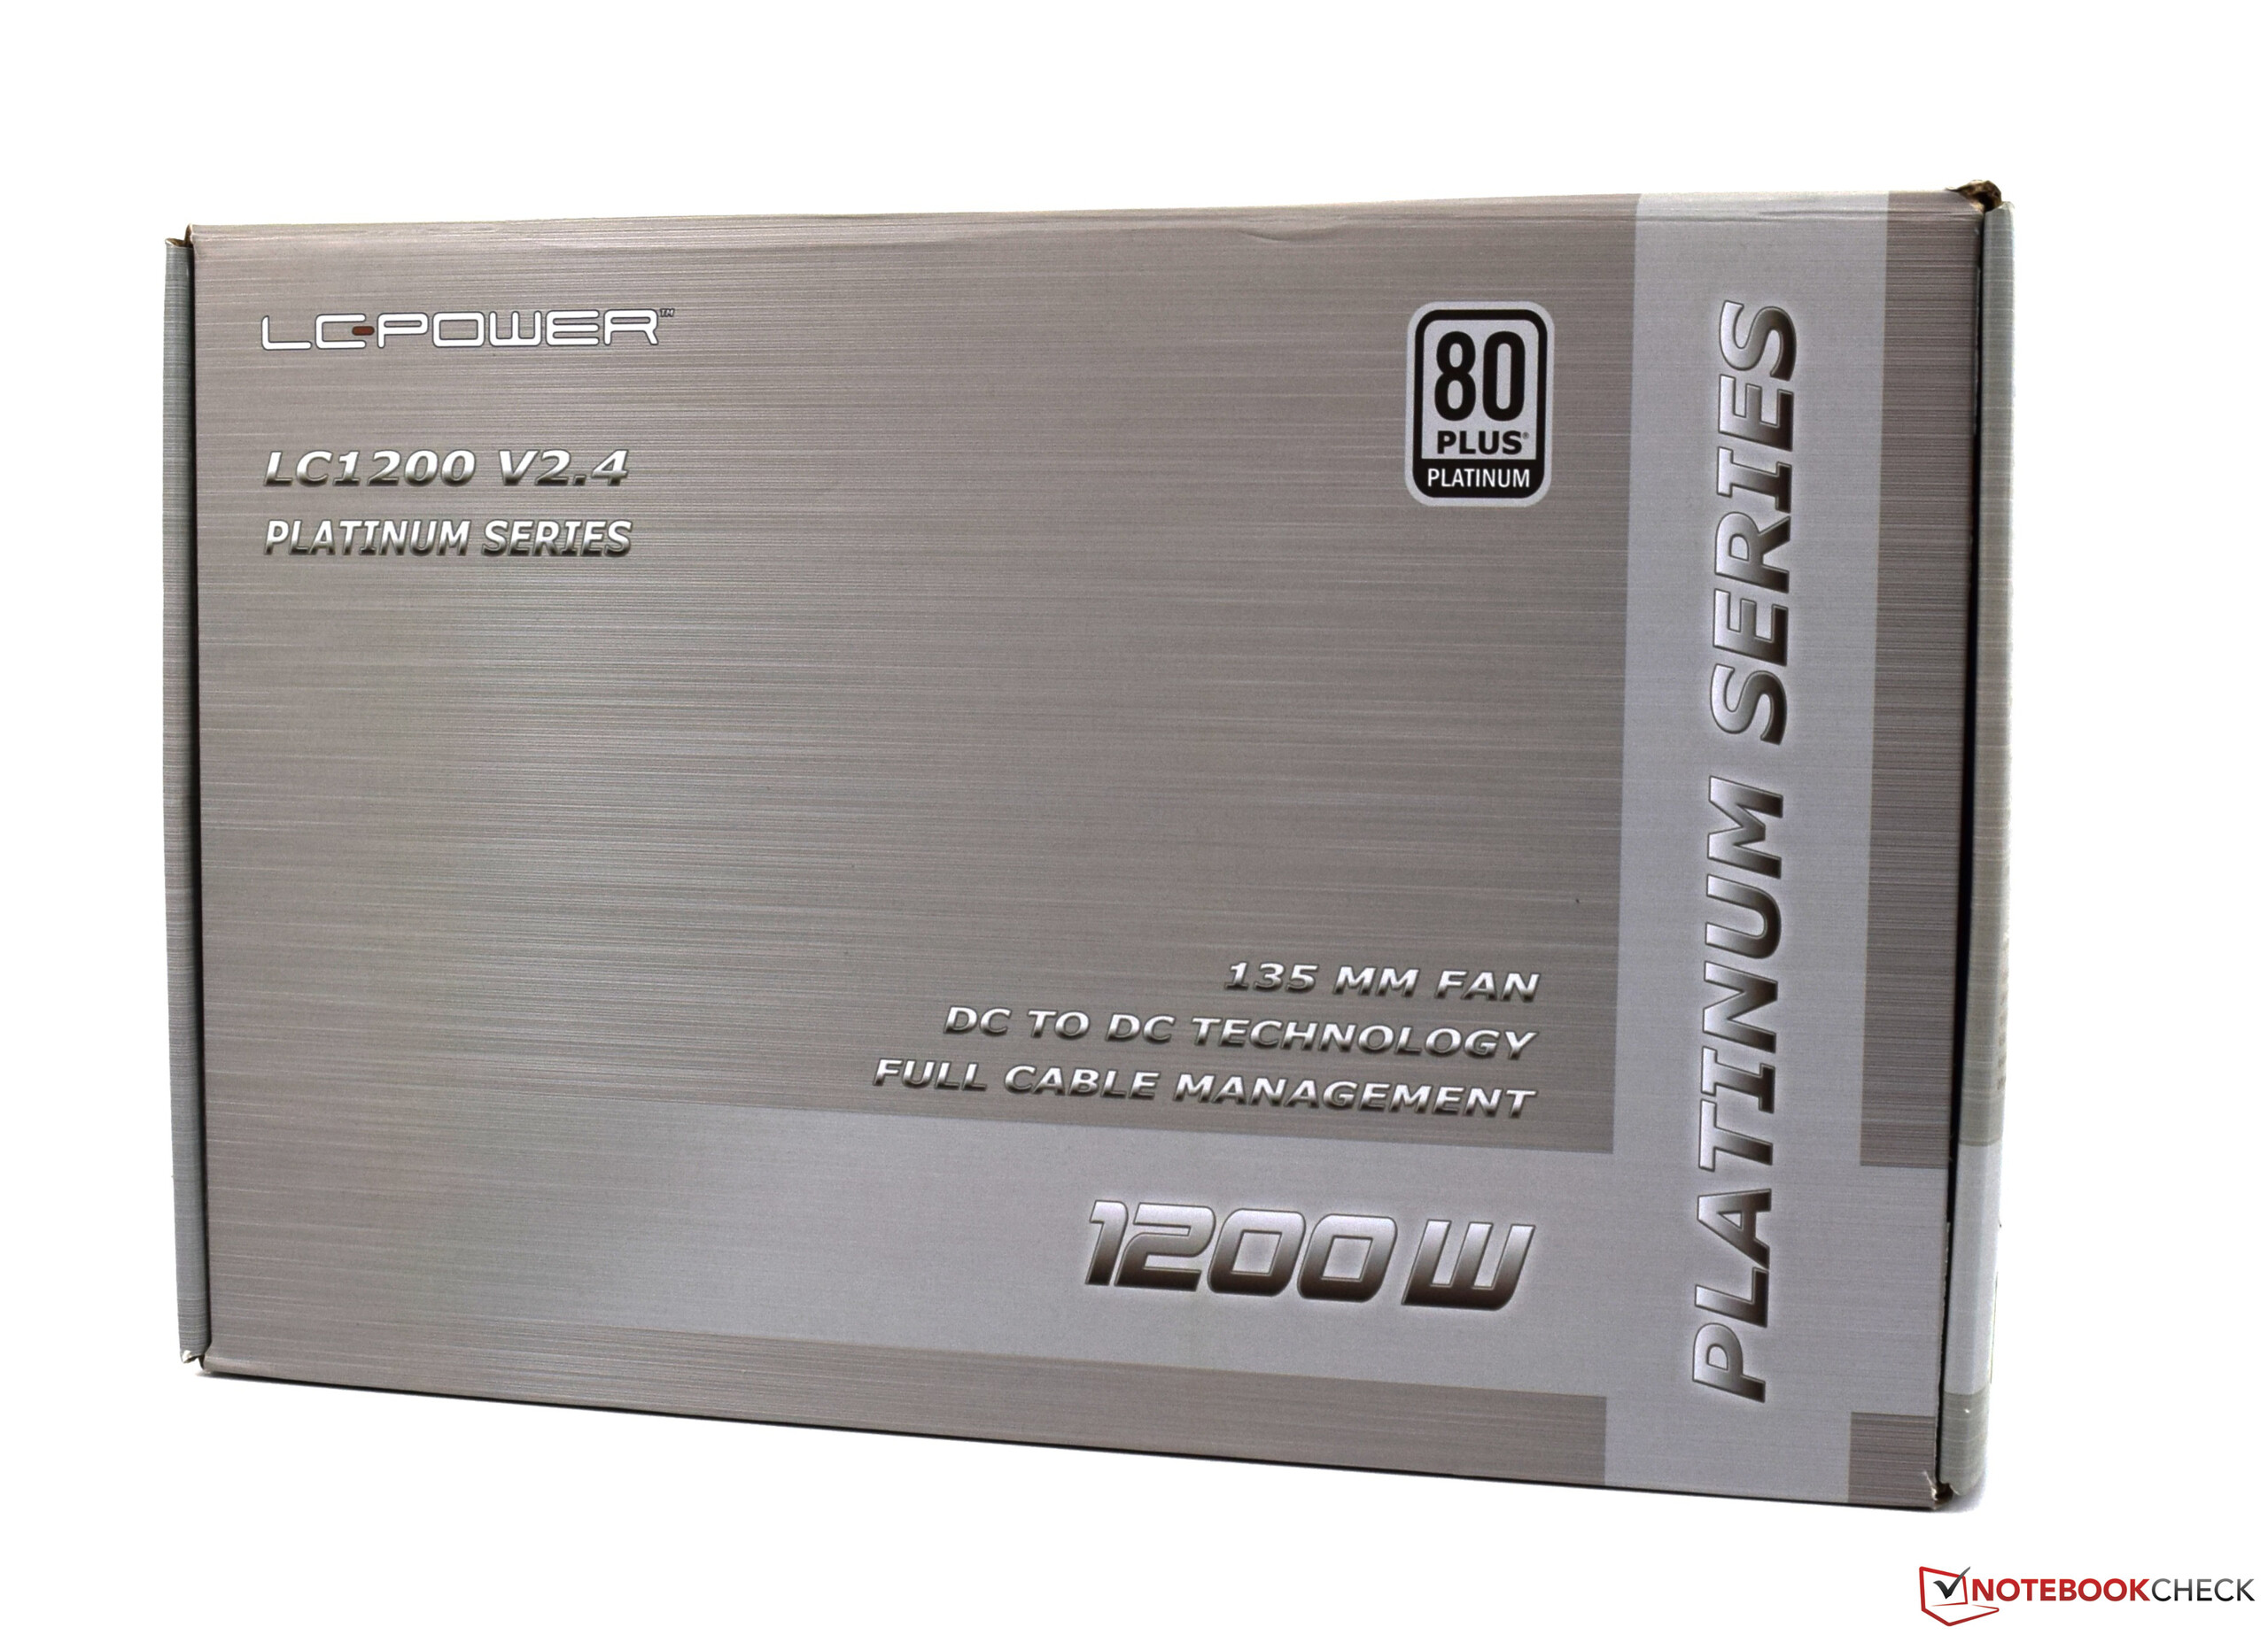
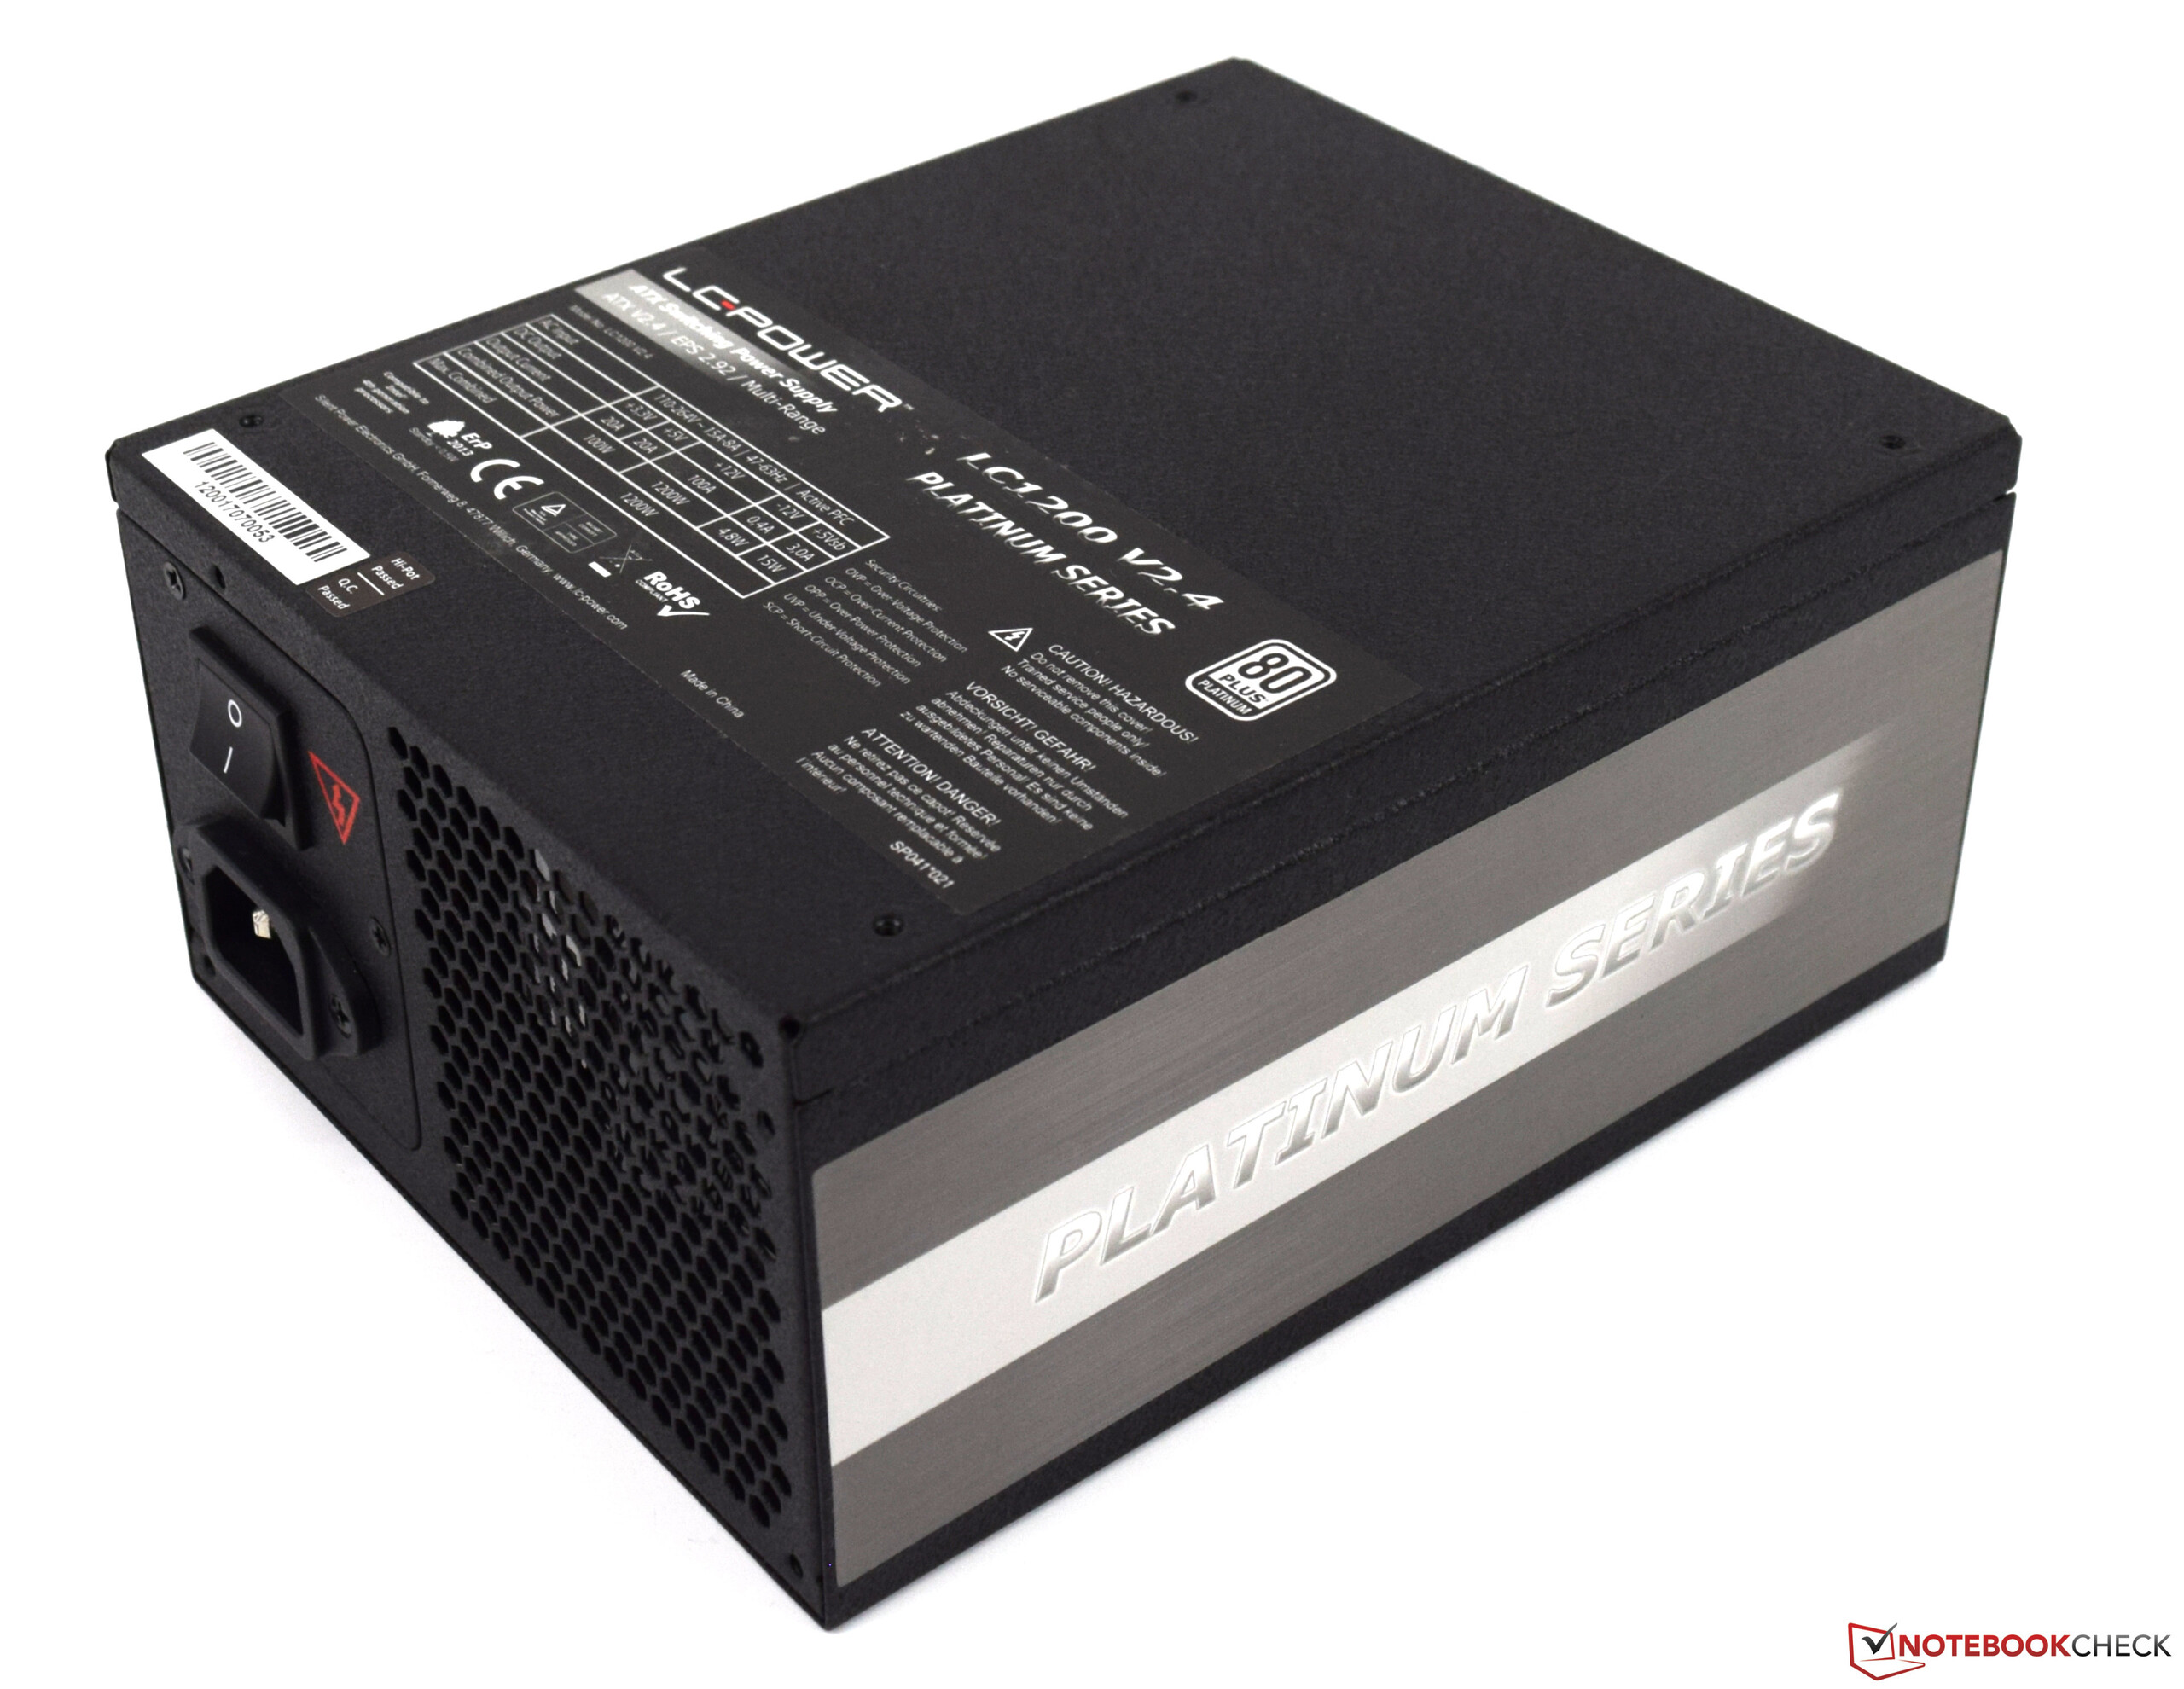
- LC Power-1, 200-W power supply
- ADATA SX910 512 GB
- Western Digital 2 TB USB 3.0 HDD
Processor Benchmarks
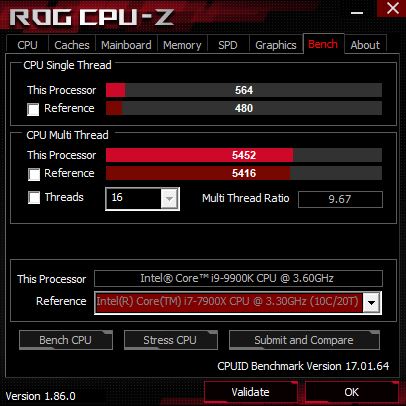
The Core i9-9900K performs well in CPU benchmarks and even beats the AMD Threadripper 1950X overall. The Core i9-9900K excels in single-core performance, where our test Core i9-9900K scored more than 20% more in the single-threaded Cinebench R15 than the Ryzen 7 2700X. Single core performance has always been a strength of Intel processors though. Our test device makes life difficult for AMD too, and scores 12% more than its AMD counterpart in Cinebench R15.
Overall, Intel has made a leap forward with the Core i9-9900K’s eight cores and sixteen threads. The performance improvement is evident when comparing the processor to the Core i7-8700K in which it scores an outstanding 45% higher score in Cinebench R15 thanks to its two additional cores and higher clock speed. Intel had to make the jump to eight cores given the difference in multi-core performance between the octa-core Ryzen 7 2700X and the hexa-core Core i7-8700K. The Core i9-9900K redresses the balance in Intel’s favour.
We have not yet got our hands on the Core i7-9700K or the Core i5-9600K, so we cannot say how well these perform compared to their bigger sibling and their AMD counterparts. We will cover these CPUs in separate articles when we have received test samples.
| Performance Rating - Percent | |
| Intel Core i9-9900K | |
| AMD Ryzen Threadripper 2950X | |
| AMD Ryzen Threadripper 1950X | |
| AMD Ryzen 7 2700X -1! | |
| AMD Ryzen 5 2600X -1! | |
| Intel Core i7-8700K -2! | |
| Cinebench R15 | |
| CPU Single 64Bit | |
| Intel Core i9-9900K | |
| Intel Core i7-8700K | |
| AMD Ryzen 7 2700X | |
| AMD Ryzen Threadripper 2950X | |
| AMD Ryzen 5 2600X | |
| AMD Ryzen Threadripper 1950X | |
| CPU Multi 64Bit | |
| AMD Ryzen Threadripper 2950X | |
| AMD Ryzen Threadripper 1950X | |
| Intel Core i9-9900K | |
| AMD Ryzen 7 2700X | |
| Intel Core i7-8700K | |
| AMD Ryzen 5 2600X | |
| Cinebench R11.5 | |
| CPU Multi 64Bit | |
| AMD Ryzen Threadripper 2950X | |
| AMD Ryzen Threadripper 1950X | |
| Intel Core i9-9900K | |
| AMD Ryzen 7 2700X | |
| Intel Core i7-8700K | |
| AMD Ryzen 5 2600X | |
| CPU Single 64Bit | |
| Intel Core i9-9900K | |
| Intel Core i7-8700K | |
| AMD Ryzen 7 2700X | |
| AMD Ryzen Threadripper 2950X | |
| AMD Ryzen 5 2600X | |
| AMD Ryzen Threadripper 1950X | |
| Blender - v2.79 BMW27 CPU | |
| AMD Ryzen 5 2600X | |
| AMD Ryzen 7 2700X | |
| Intel Core i9-9900K | |
| AMD Ryzen Threadripper 1950X | |
| AMD Ryzen Threadripper 2950X | |
| wPrime 2.10 | |
| 32m | |
| Intel Core i9-9900K | |
| AMD Ryzen 5 2600X | |
| AMD Ryzen Threadripper 2950X | |
| Intel Core i7-8700K | |
| AMD Ryzen 7 2700X | |
| AMD Ryzen Threadripper 1950X | |
| 1024m | |
| AMD Ryzen 5 2600X | |
| Intel Core i7-8700K | |
| AMD Ryzen 7 2700X | |
| Intel Core i9-9900K | |
| AMD Ryzen Threadripper 1950X | |
| AMD Ryzen Threadripper 2950X | |
| HWBOT x265 Benchmark v2.2 - 4k Preset | |
| AMD Ryzen Threadripper 2950X | |
| AMD Ryzen Threadripper 1950X | |
| Intel Core i9-9900K | |
| X264 HD Benchmark 4.0 | |
| Pass 1 | |
| Intel Core i9-9900K | |
| Intel Core i7-8700K | |
| AMD Ryzen 7 2700X | |
| AMD Ryzen 5 2600X | |
| AMD Ryzen Threadripper 2950X | |
| AMD Ryzen Threadripper 1950X | |
| Pass 2 | |
| AMD Ryzen Threadripper 2950X | |
| AMD Ryzen Threadripper 1950X | |
| Intel Core i9-9900K | |
| AMD Ryzen 7 2700X | |
| Intel Core i7-8700K | |
| AMD Ryzen 5 2600X | |
| WinRAR - Result | |
| Intel Core i9-9900K | |
| Intel Core i7-8700K | |
| AMD Ryzen 7 2700X | |
| AMD Ryzen 5 2600X | |
| AMD Ryzen Threadripper 2950X | |
| AMD Ryzen Threadripper 1950X | |
| TrueCrypt | |
| AES Mean 100MB | |
| AMD Ryzen Threadripper 2950X | |
| AMD Ryzen Threadripper 1950X | |
| Intel Core i9-9900K | |
| AMD Ryzen 7 2700X | |
| Intel Core i7-8700K | |
| AMD Ryzen 5 2600X | |
| Twofish Mean 100MB | |
| AMD Ryzen Threadripper 1950X | |
| AMD Ryzen Threadripper 2950X | |
| Intel Core i9-9900K | |
| AMD Ryzen 7 2700X | |
| Intel Core i7-8700K | |
| AMD Ryzen 5 2600X | |
| Serpent Mean 100MB | |
| AMD Ryzen Threadripper 1950X | |
| AMD Ryzen Threadripper 2950X | |
| Intel Core i9-9900K | |
| AMD Ryzen 7 2700X | |
| Intel Core i7-8700K | |
| AMD Ryzen 5 2600X | |
| Geekbench 4.4 | |
| 64 Bit Single-Core Score | |
| Intel Core i9-9900K | |
| Intel Core i7-8700K | |
| AMD Ryzen 7 2700X | |
| AMD Ryzen Threadripper 2950X | |
| AMD Ryzen 5 2600X | |
| AMD Ryzen Threadripper 1950X | |
| 64 Bit Multi-Core Score | |
| AMD Ryzen Threadripper 2950X | |
| Intel Core i9-9900K | |
| AMD Ryzen Threadripper 1950X | |
| AMD Ryzen 7 2700X | |
| Intel Core i7-8700K | |
| AMD Ryzen 5 2600X | |
* ... smaller is better
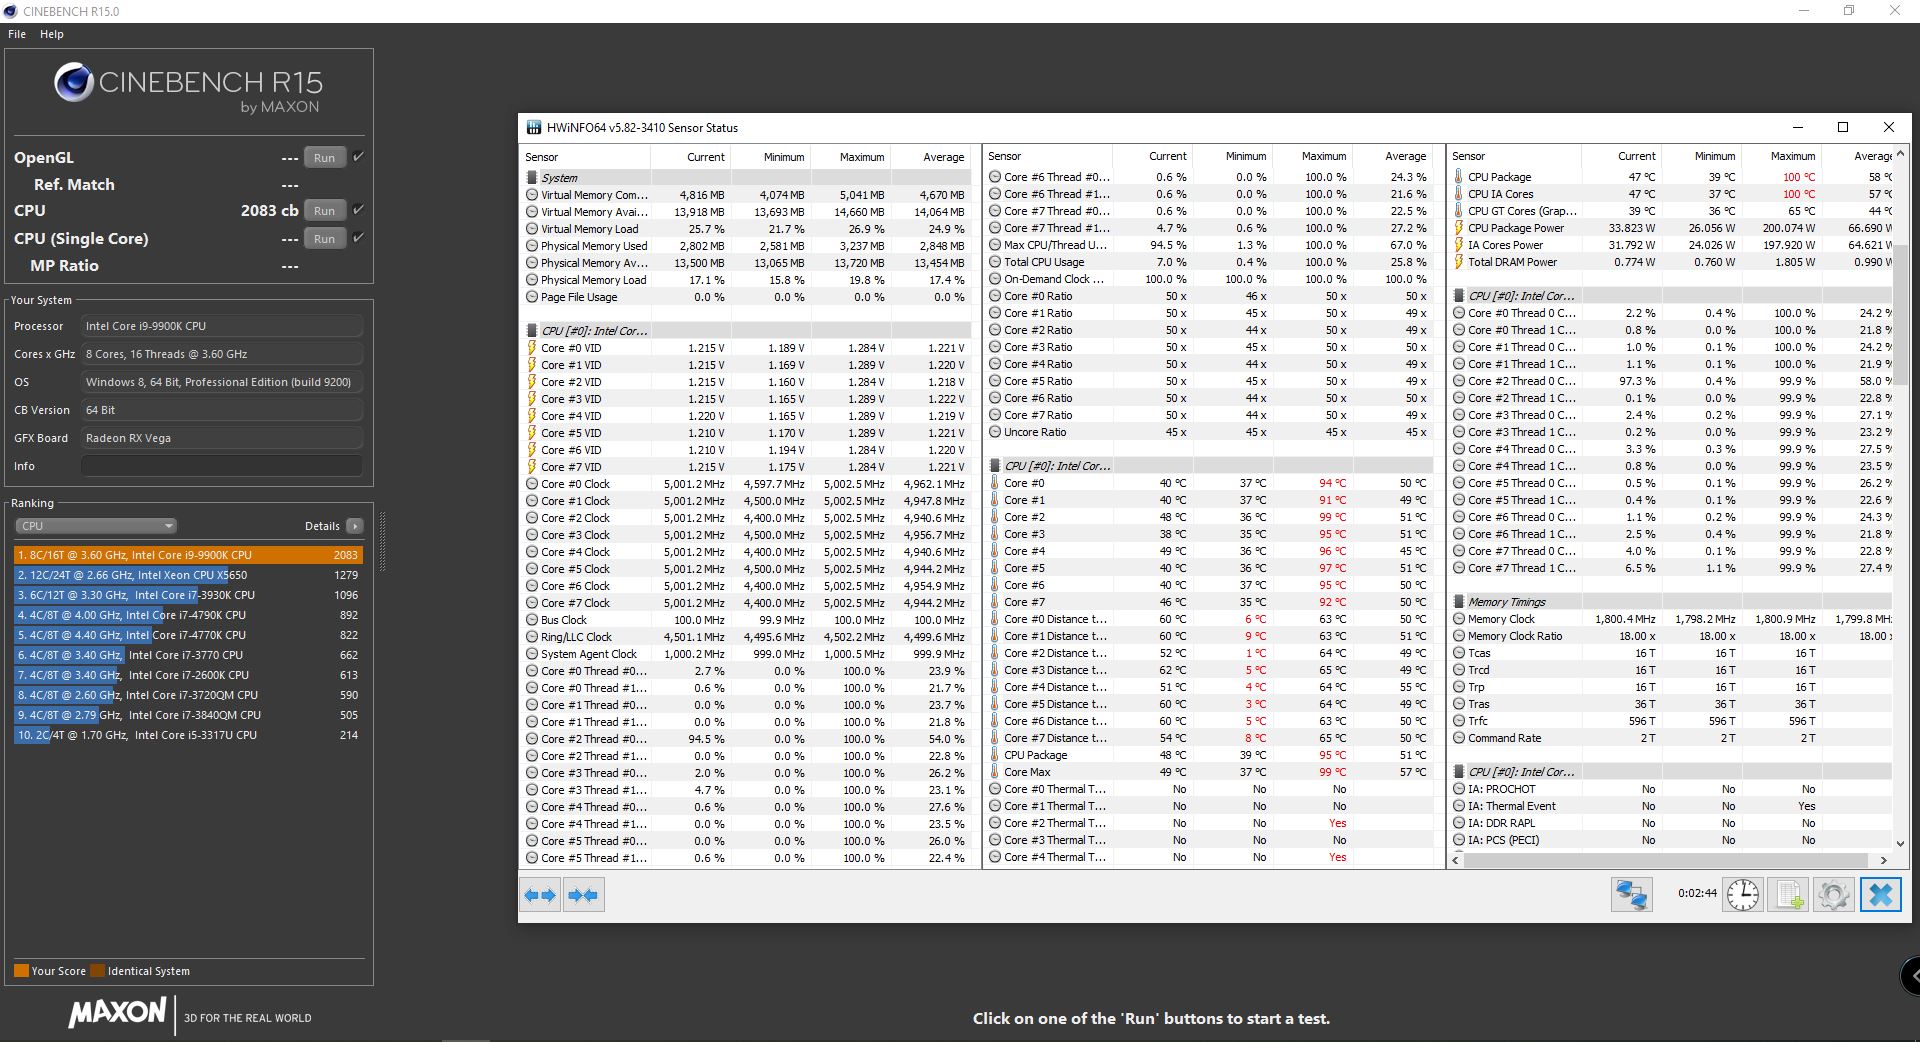
Cinebench R15 Multi Loop
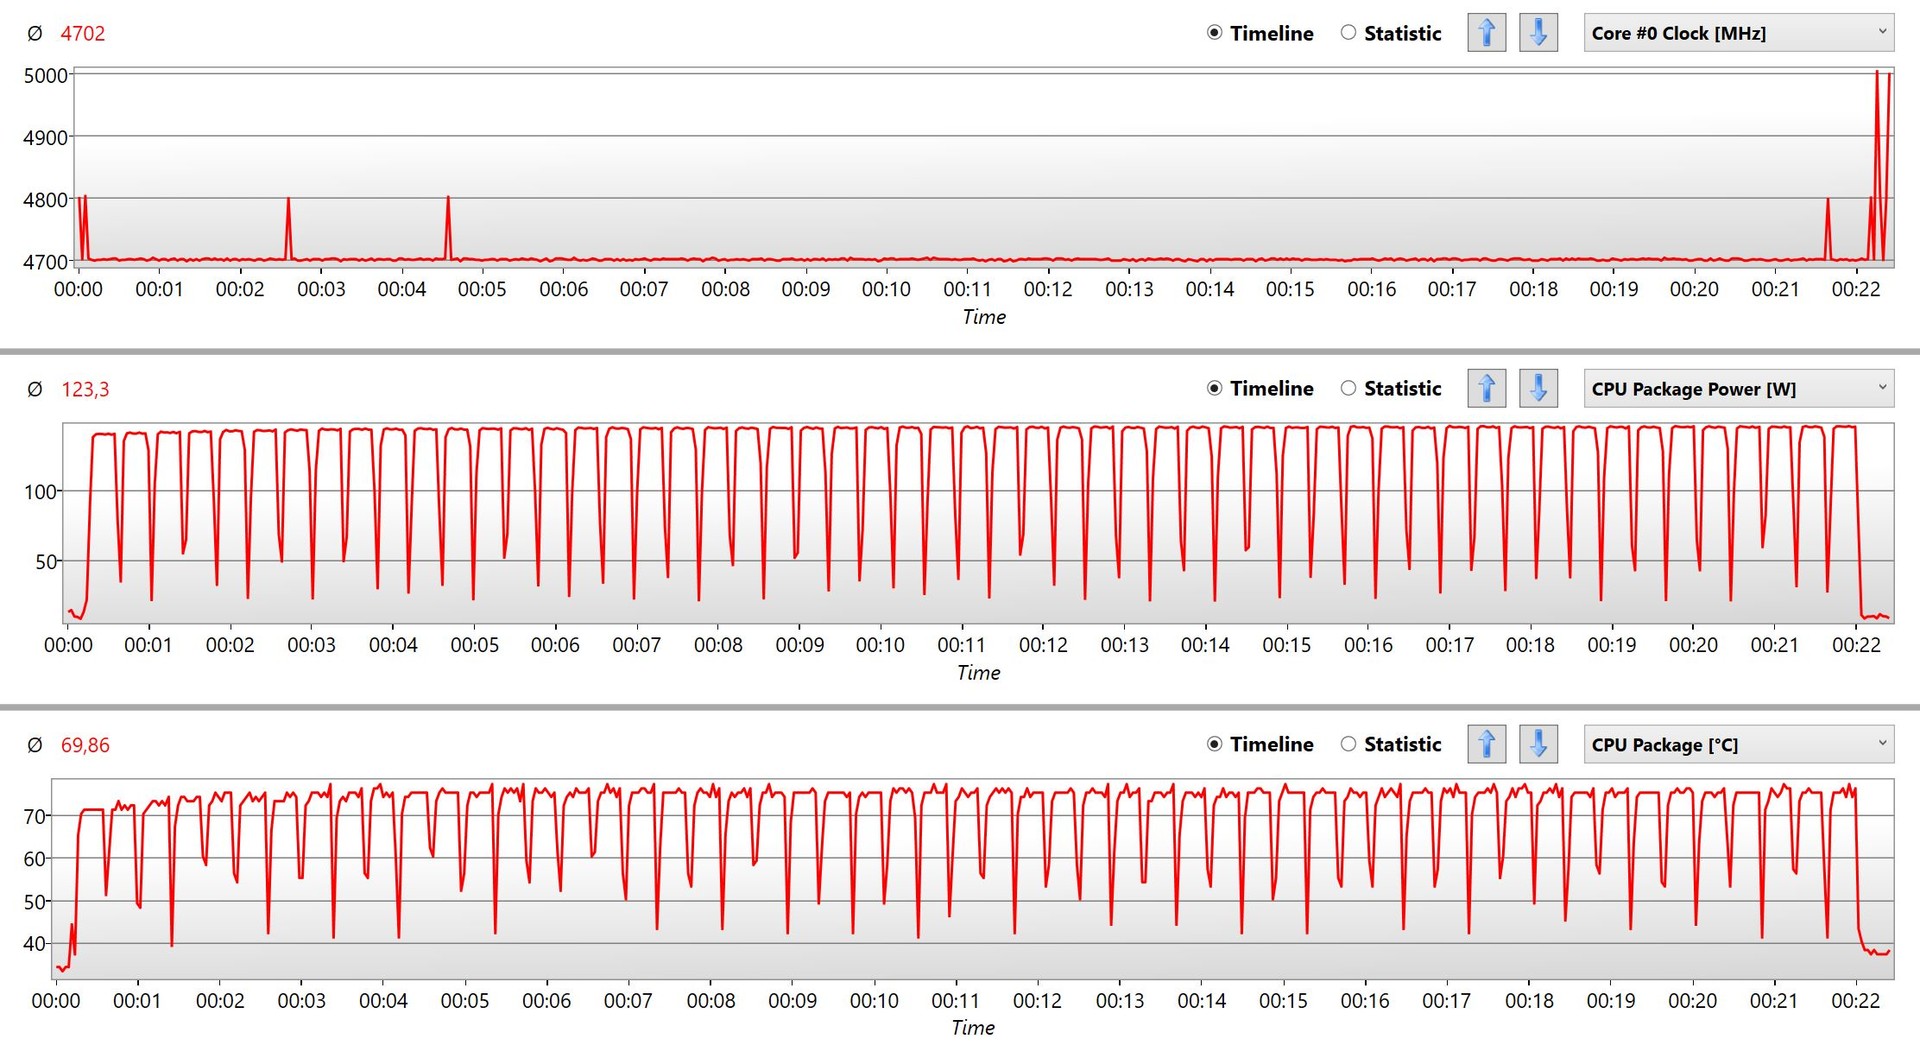
We tested how well the Core i9-9900K performs under sustained load by running a Cinebench R15 multi-threaded looped benchmark. Our test CPU exhibited no disadvantages at stock settings and achieved between 1,920 and 1,970 points throughout the benchmark loop. We noticed that programs running in the background caused the slightly lower Cinebench scores, for which we have included a HWiNFO log file that demonstrates the CPU’s performance fluctuations in greater detail.
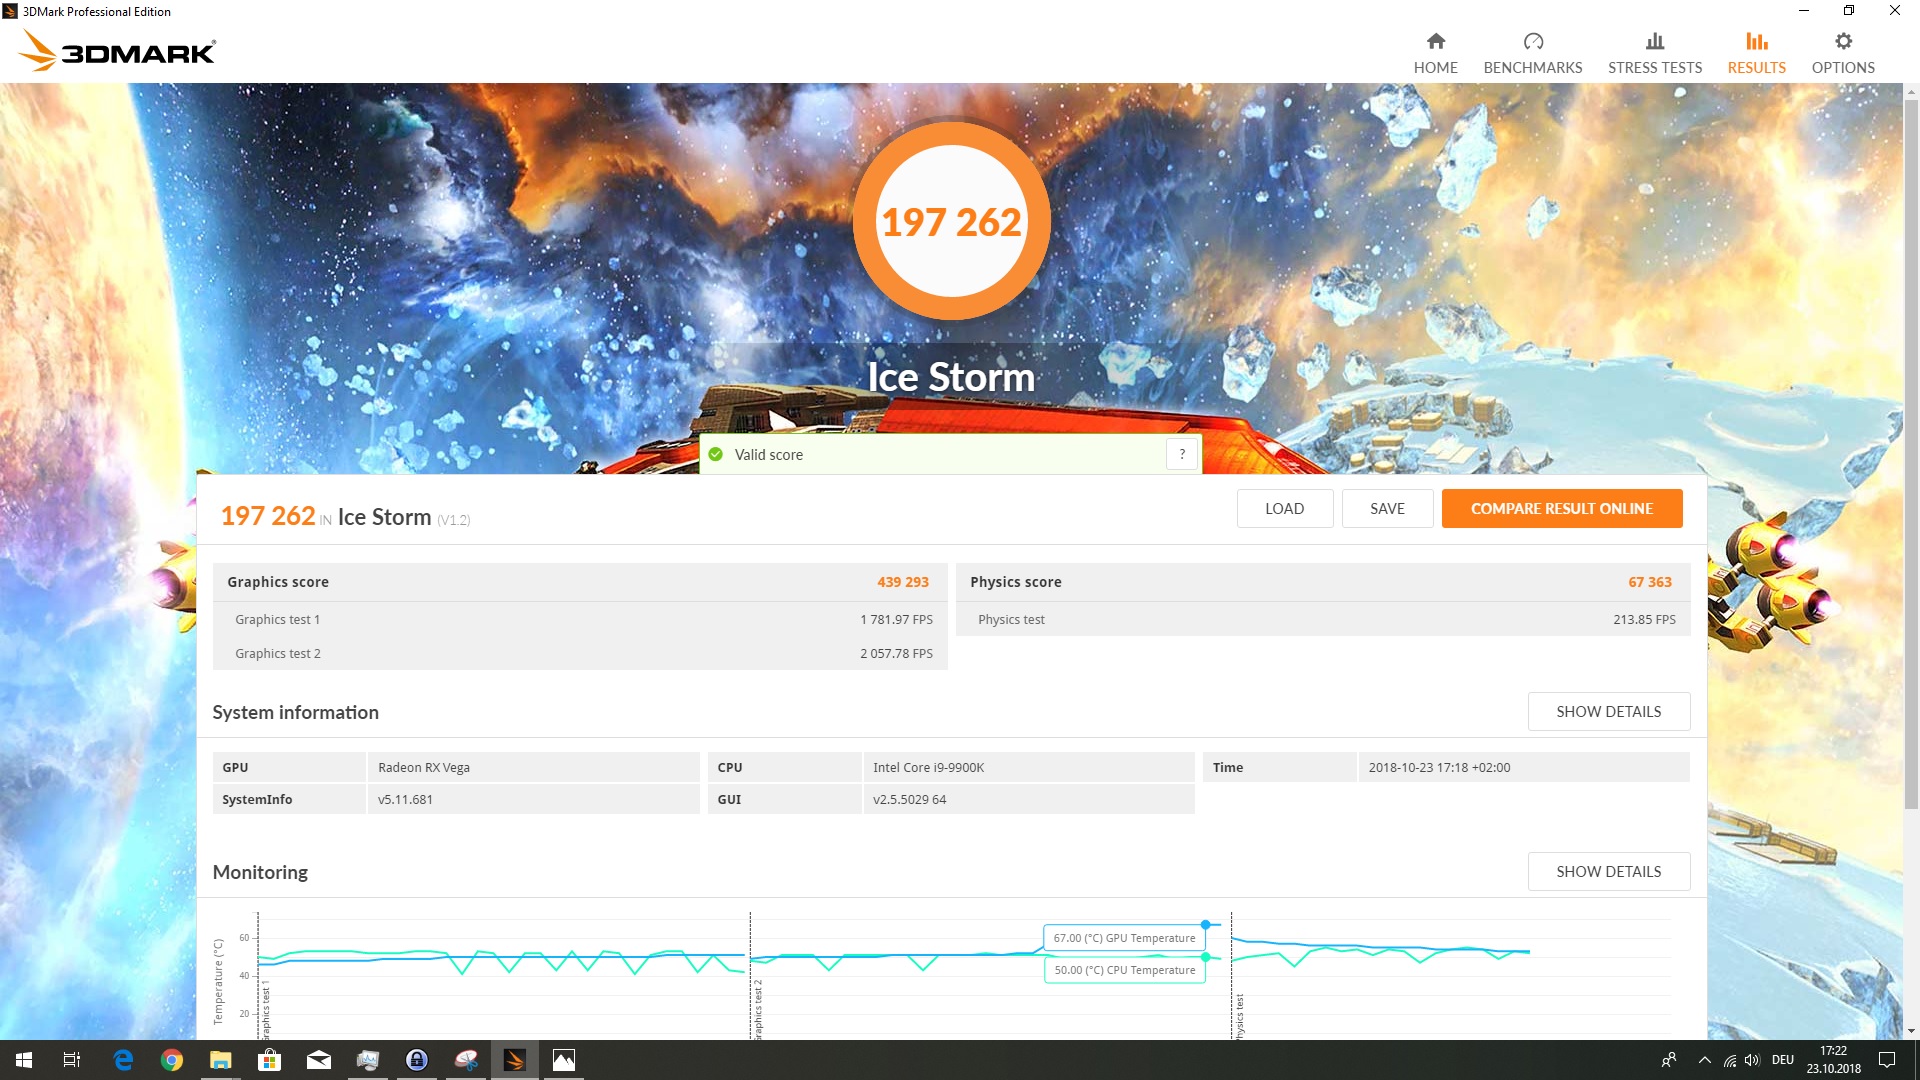
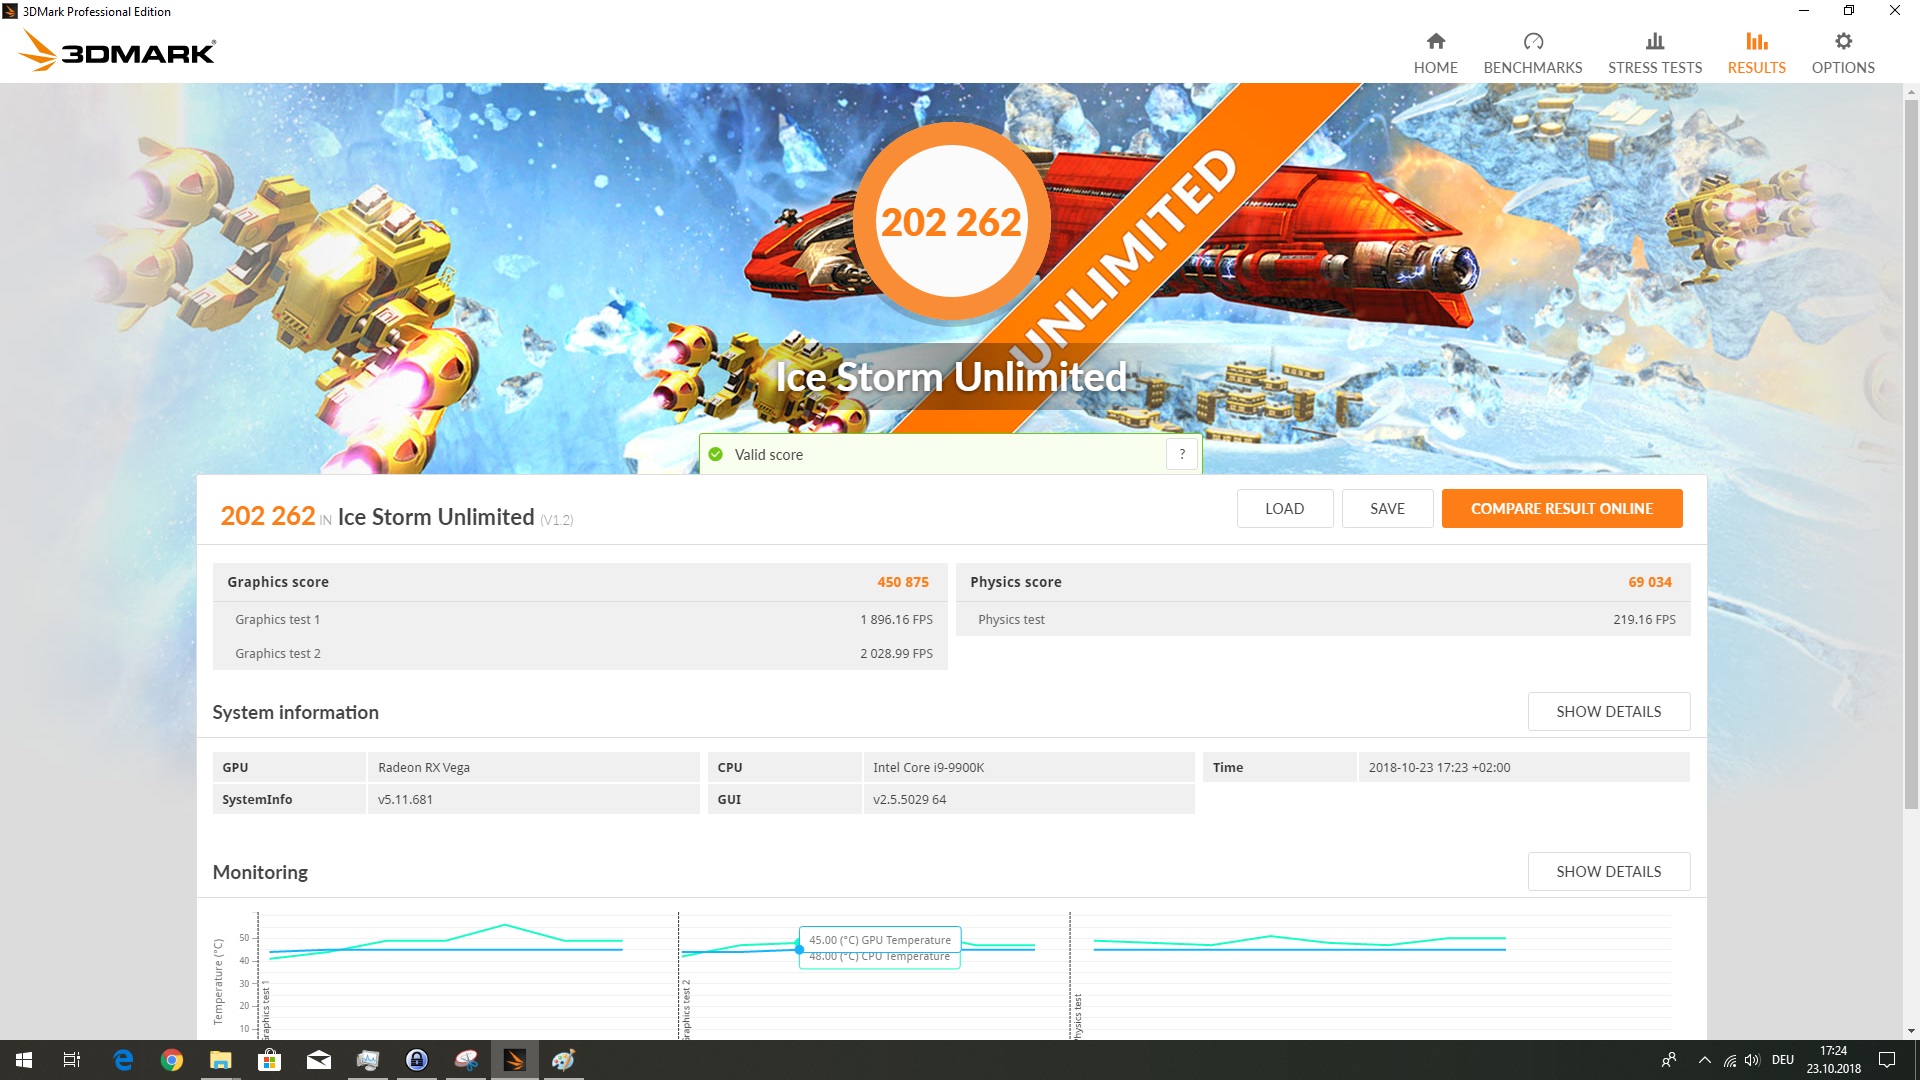
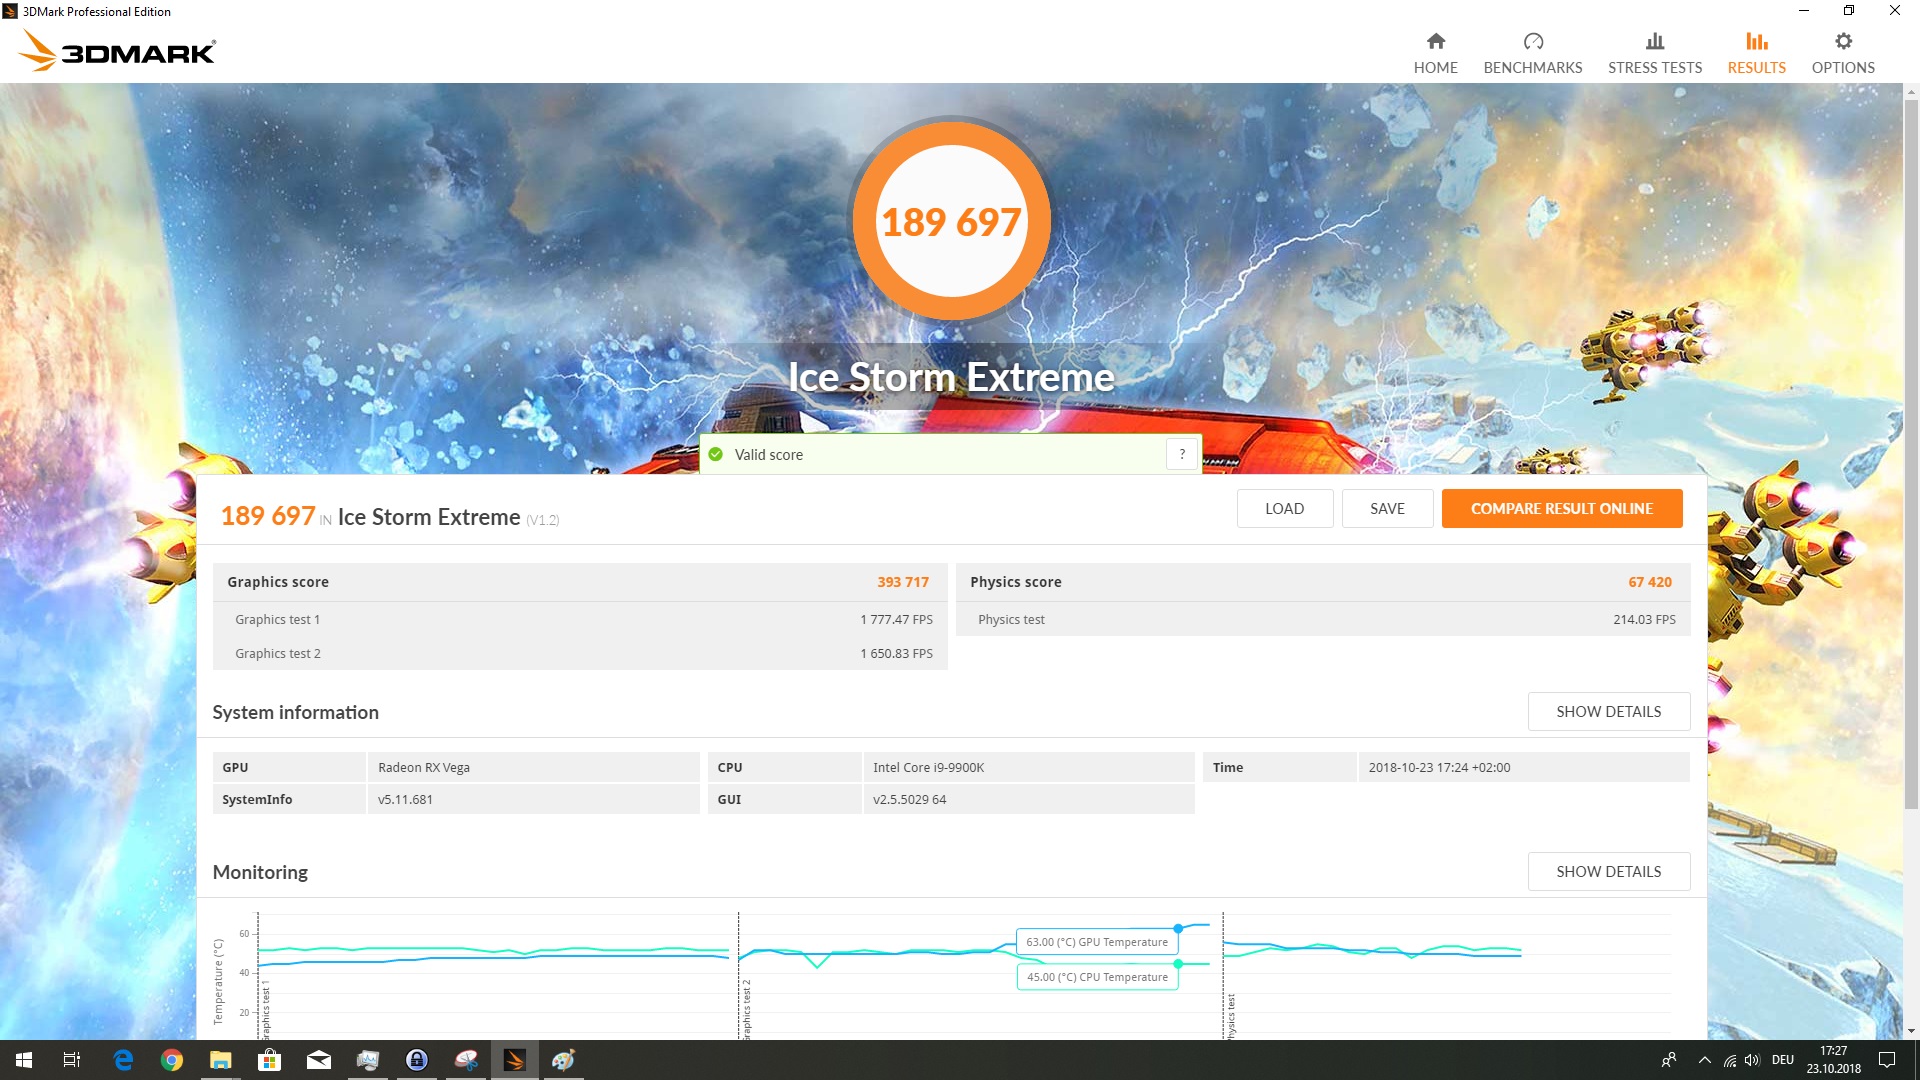
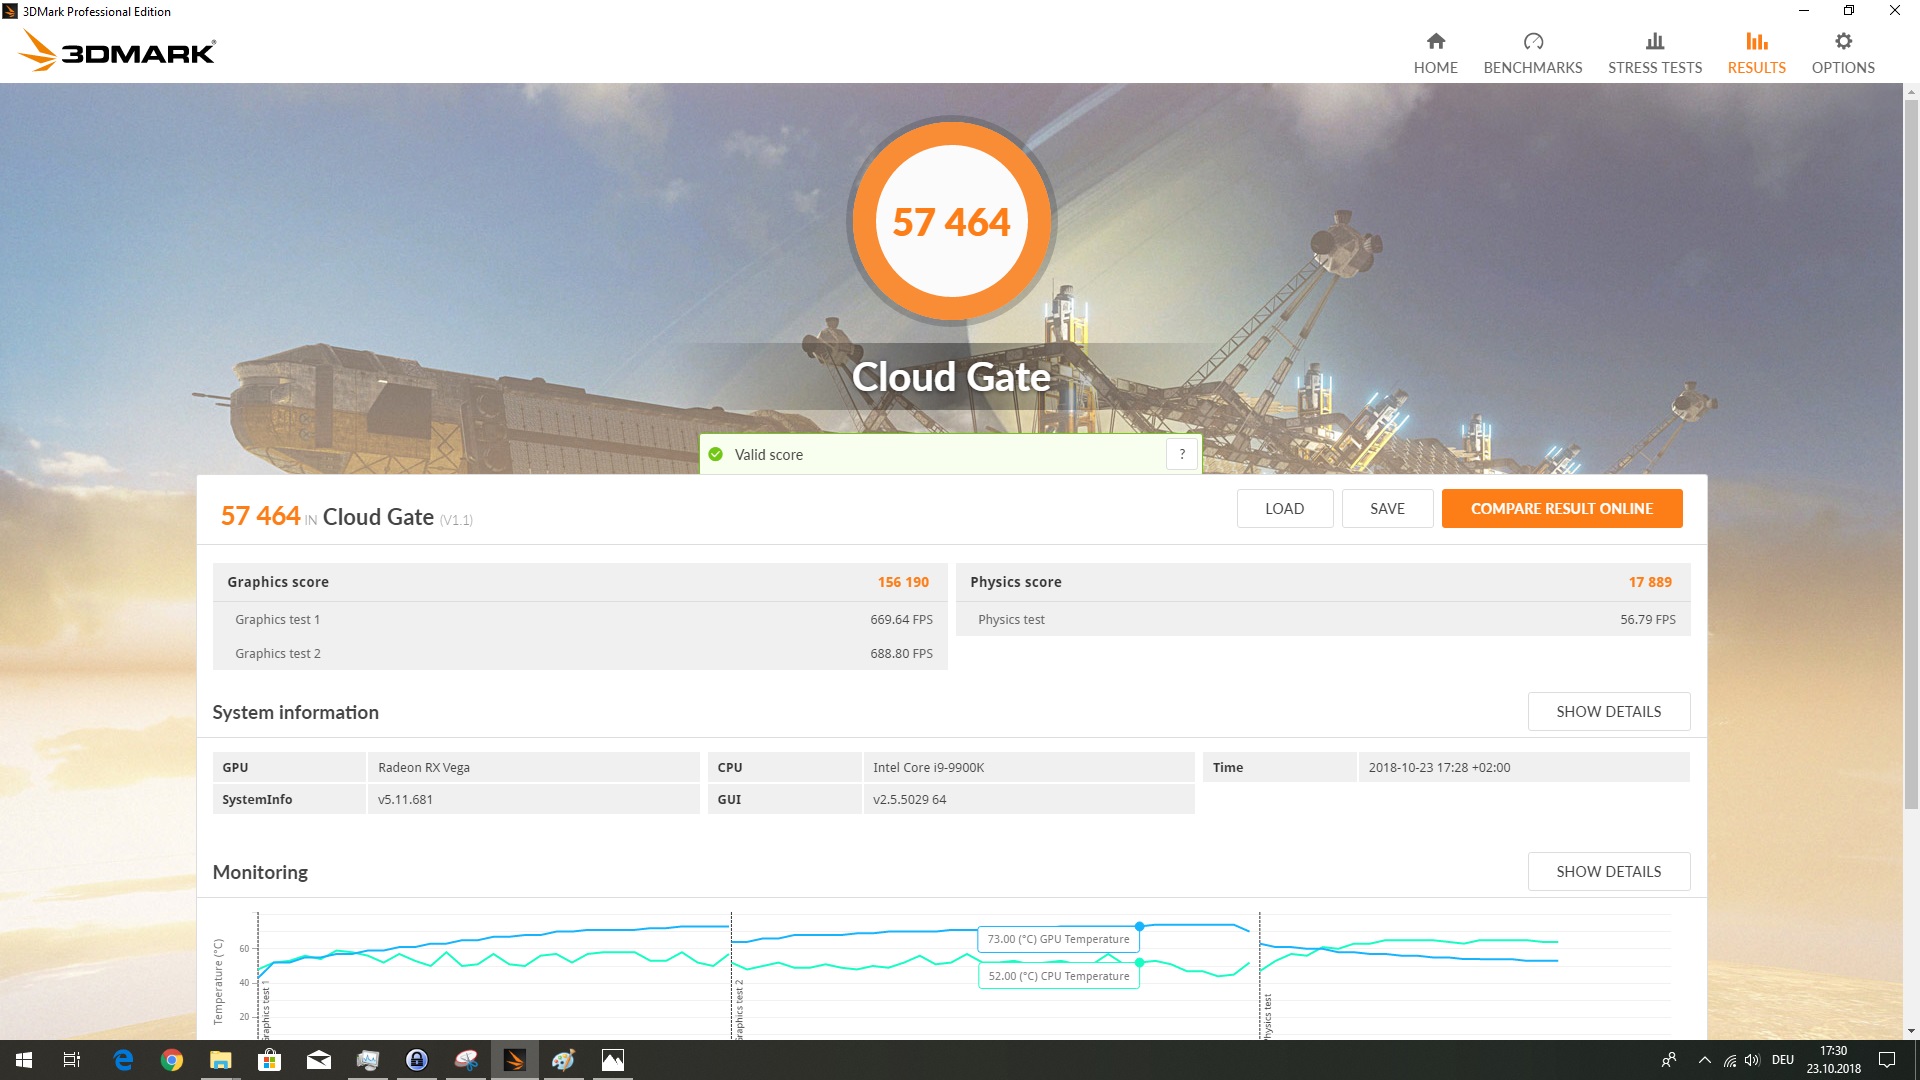
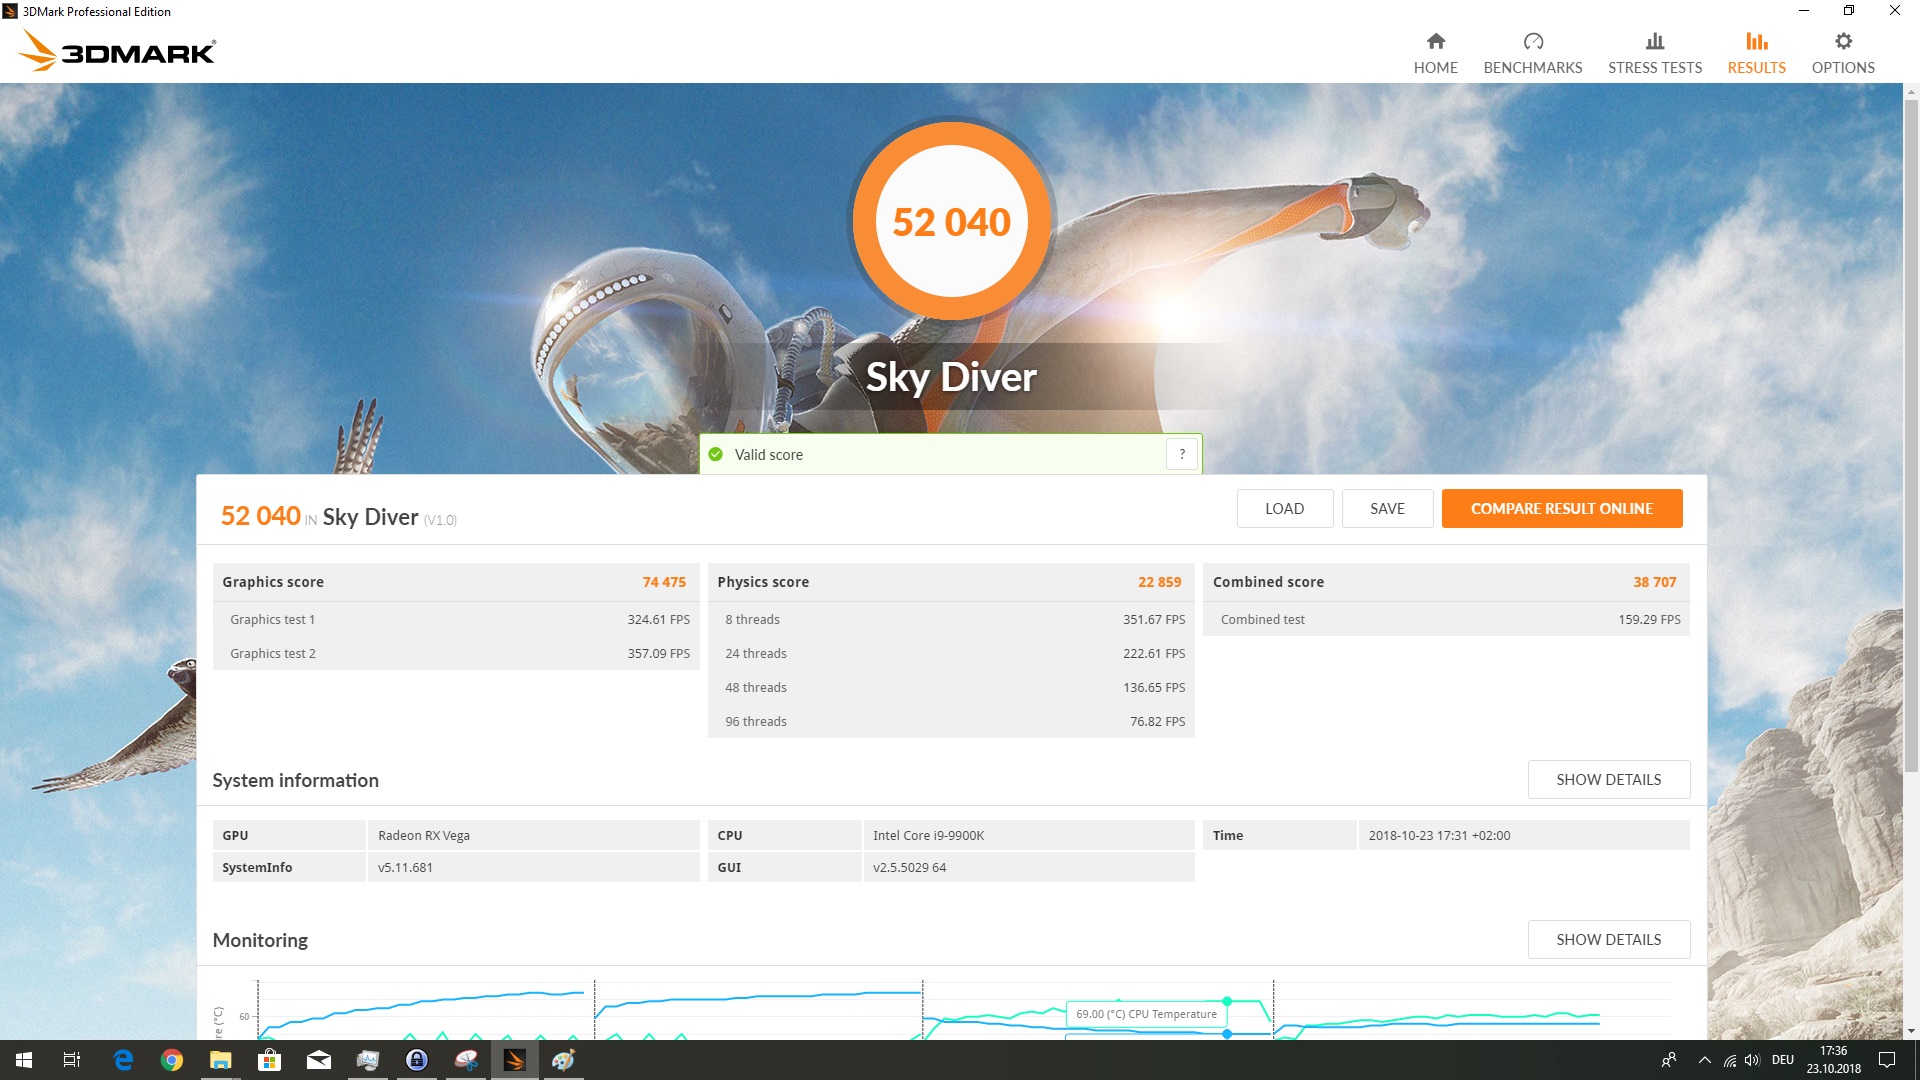
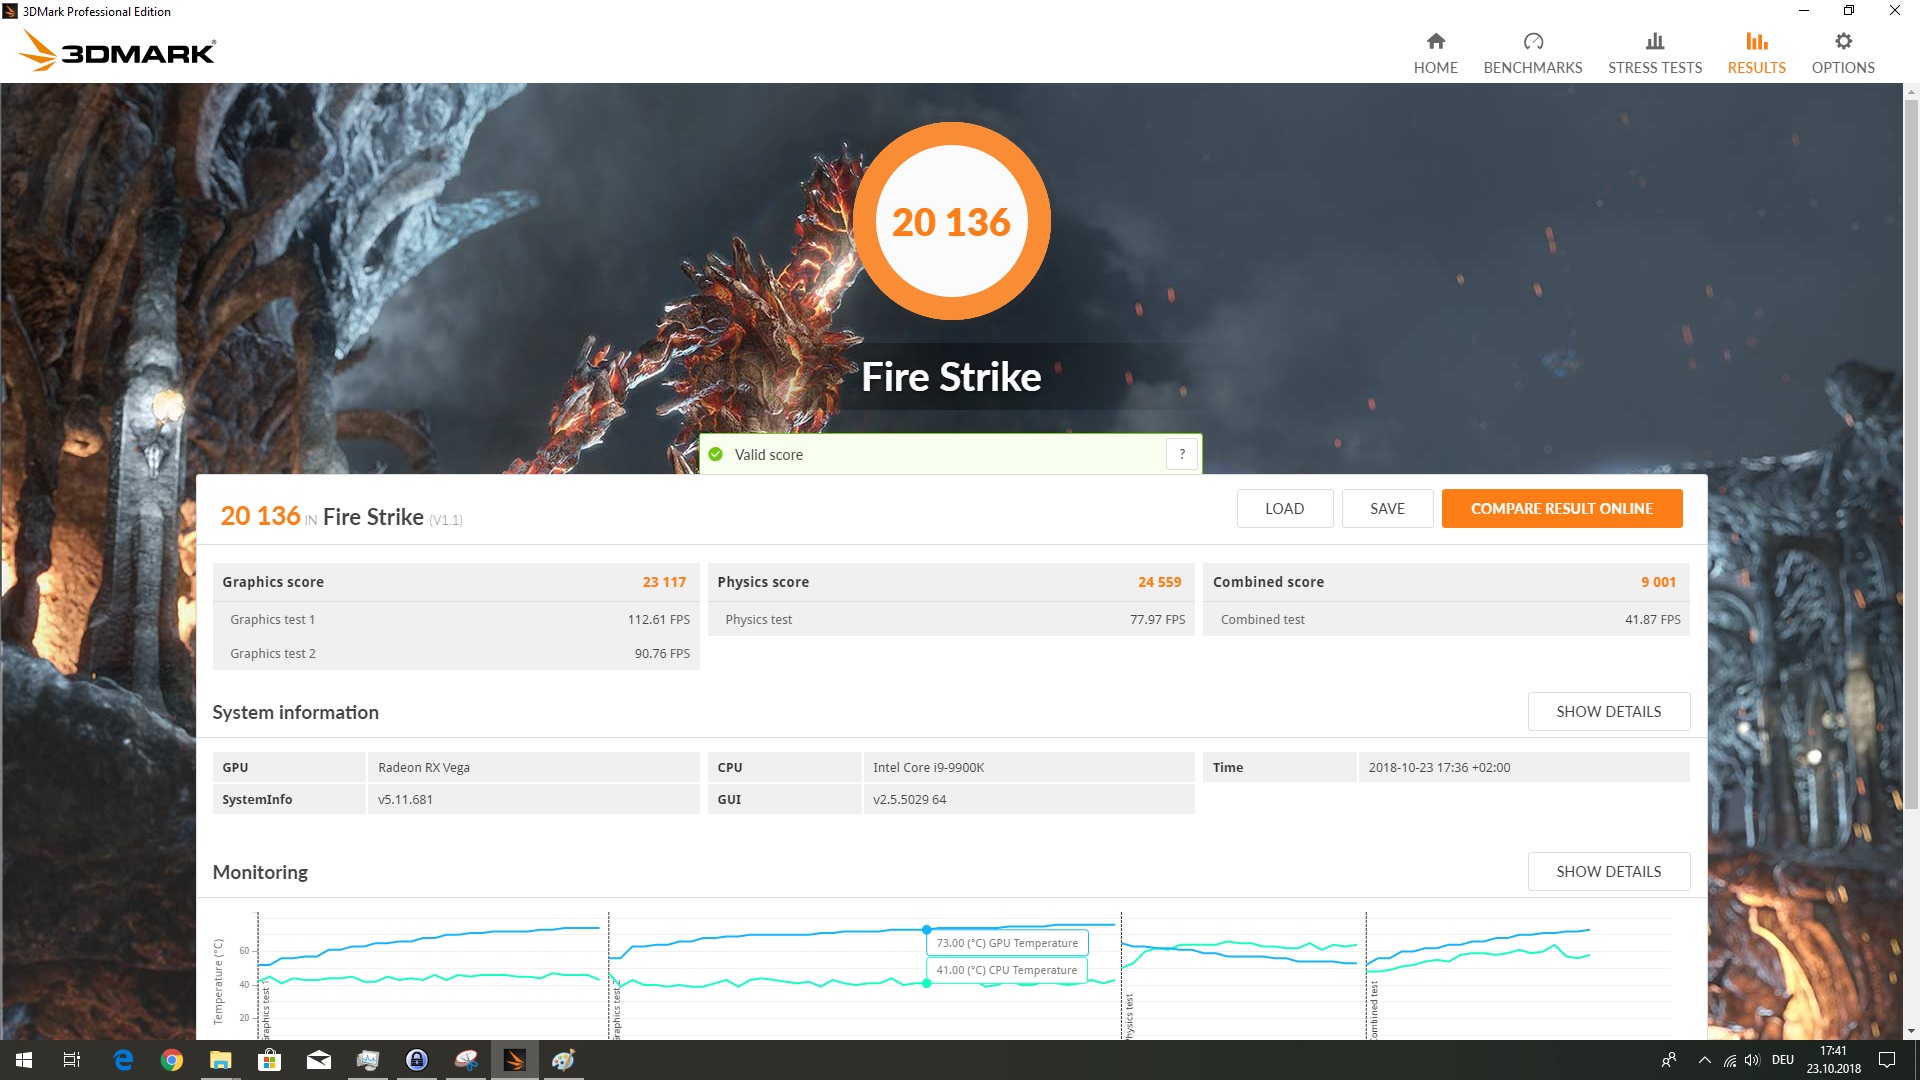
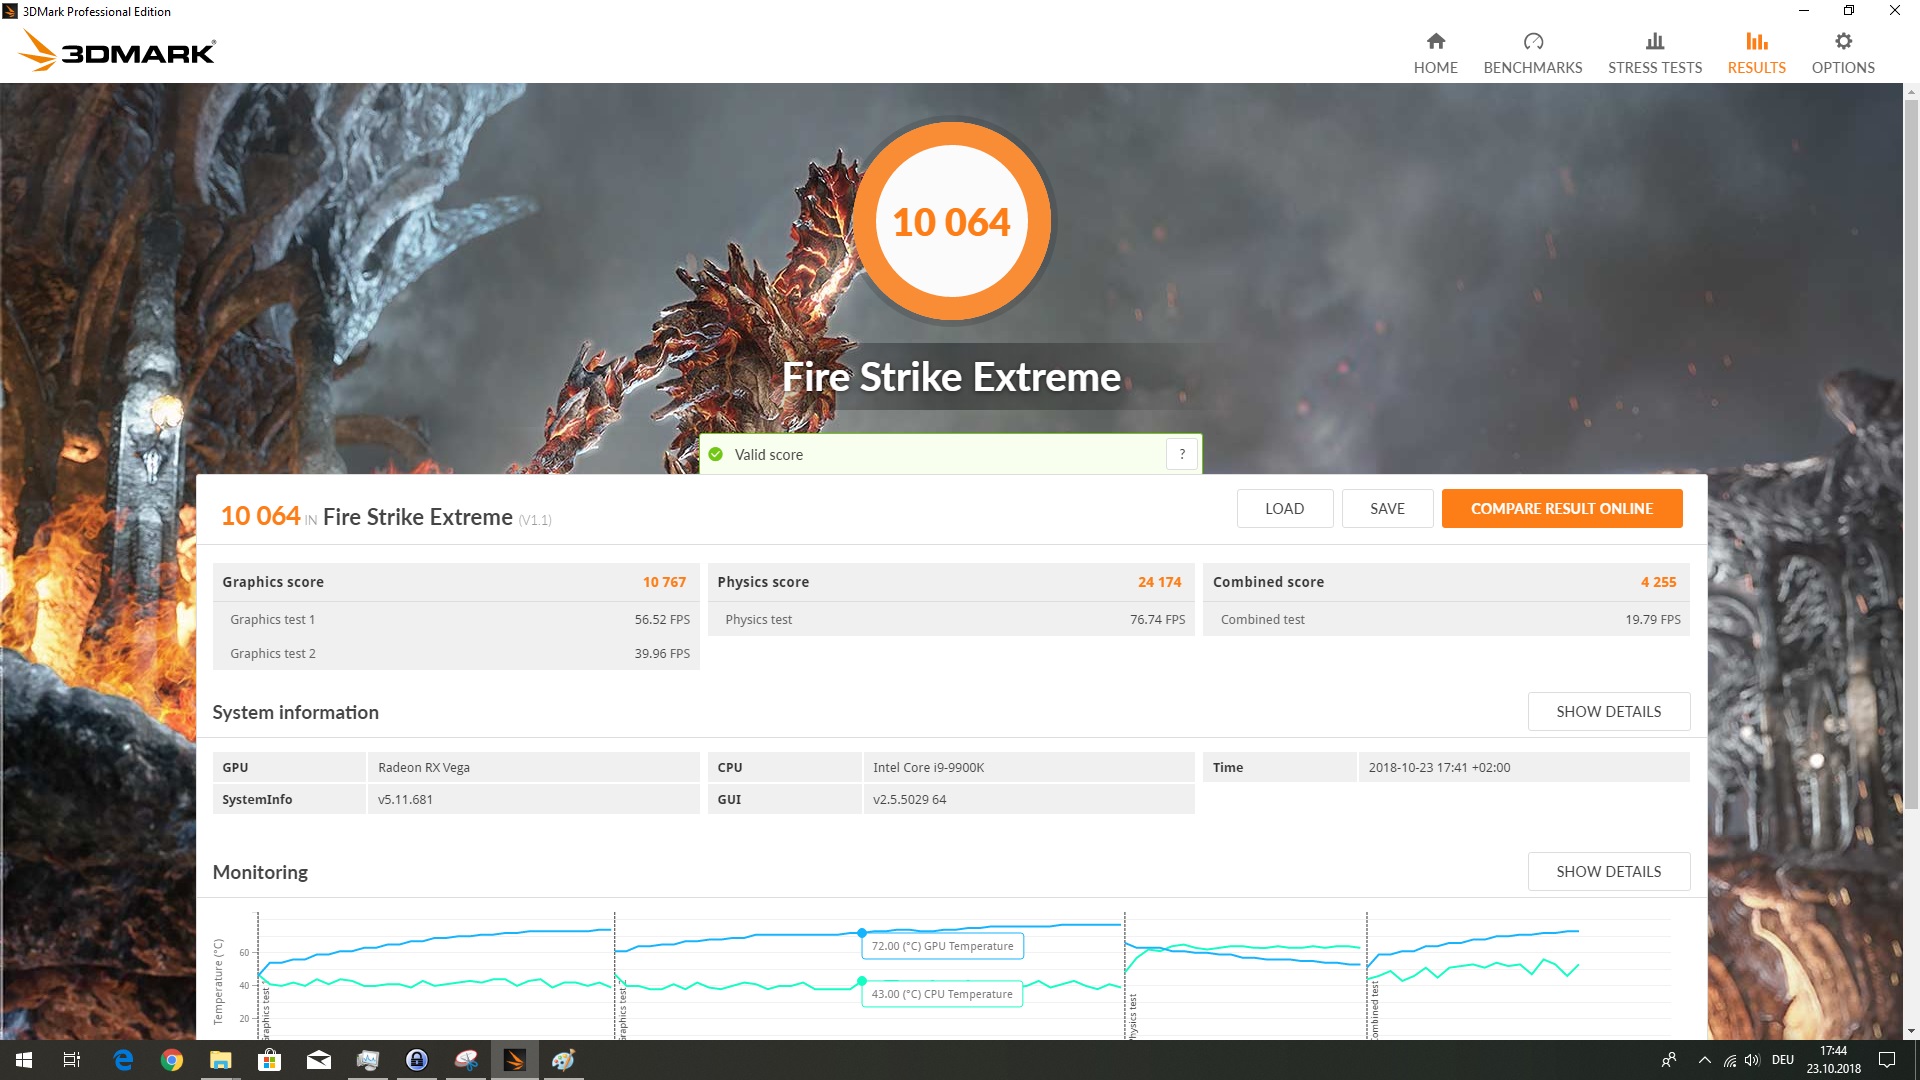
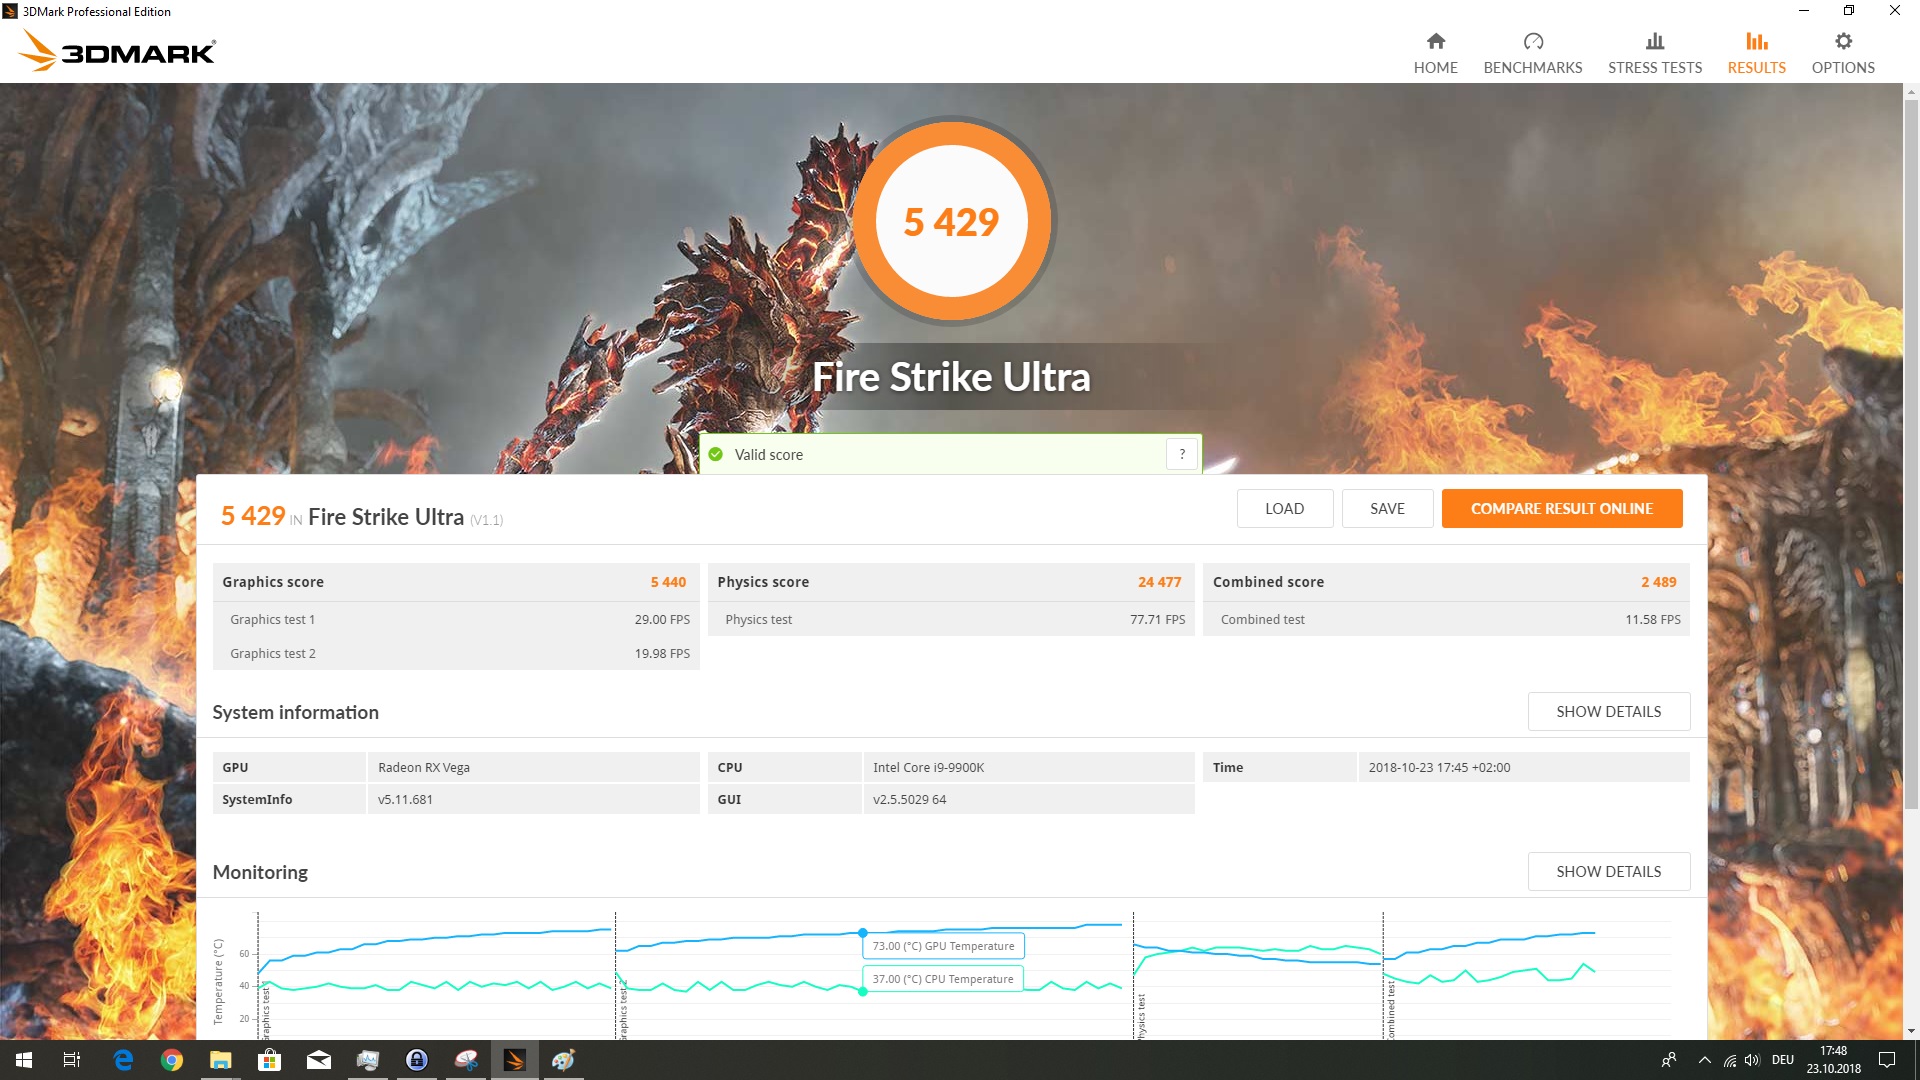
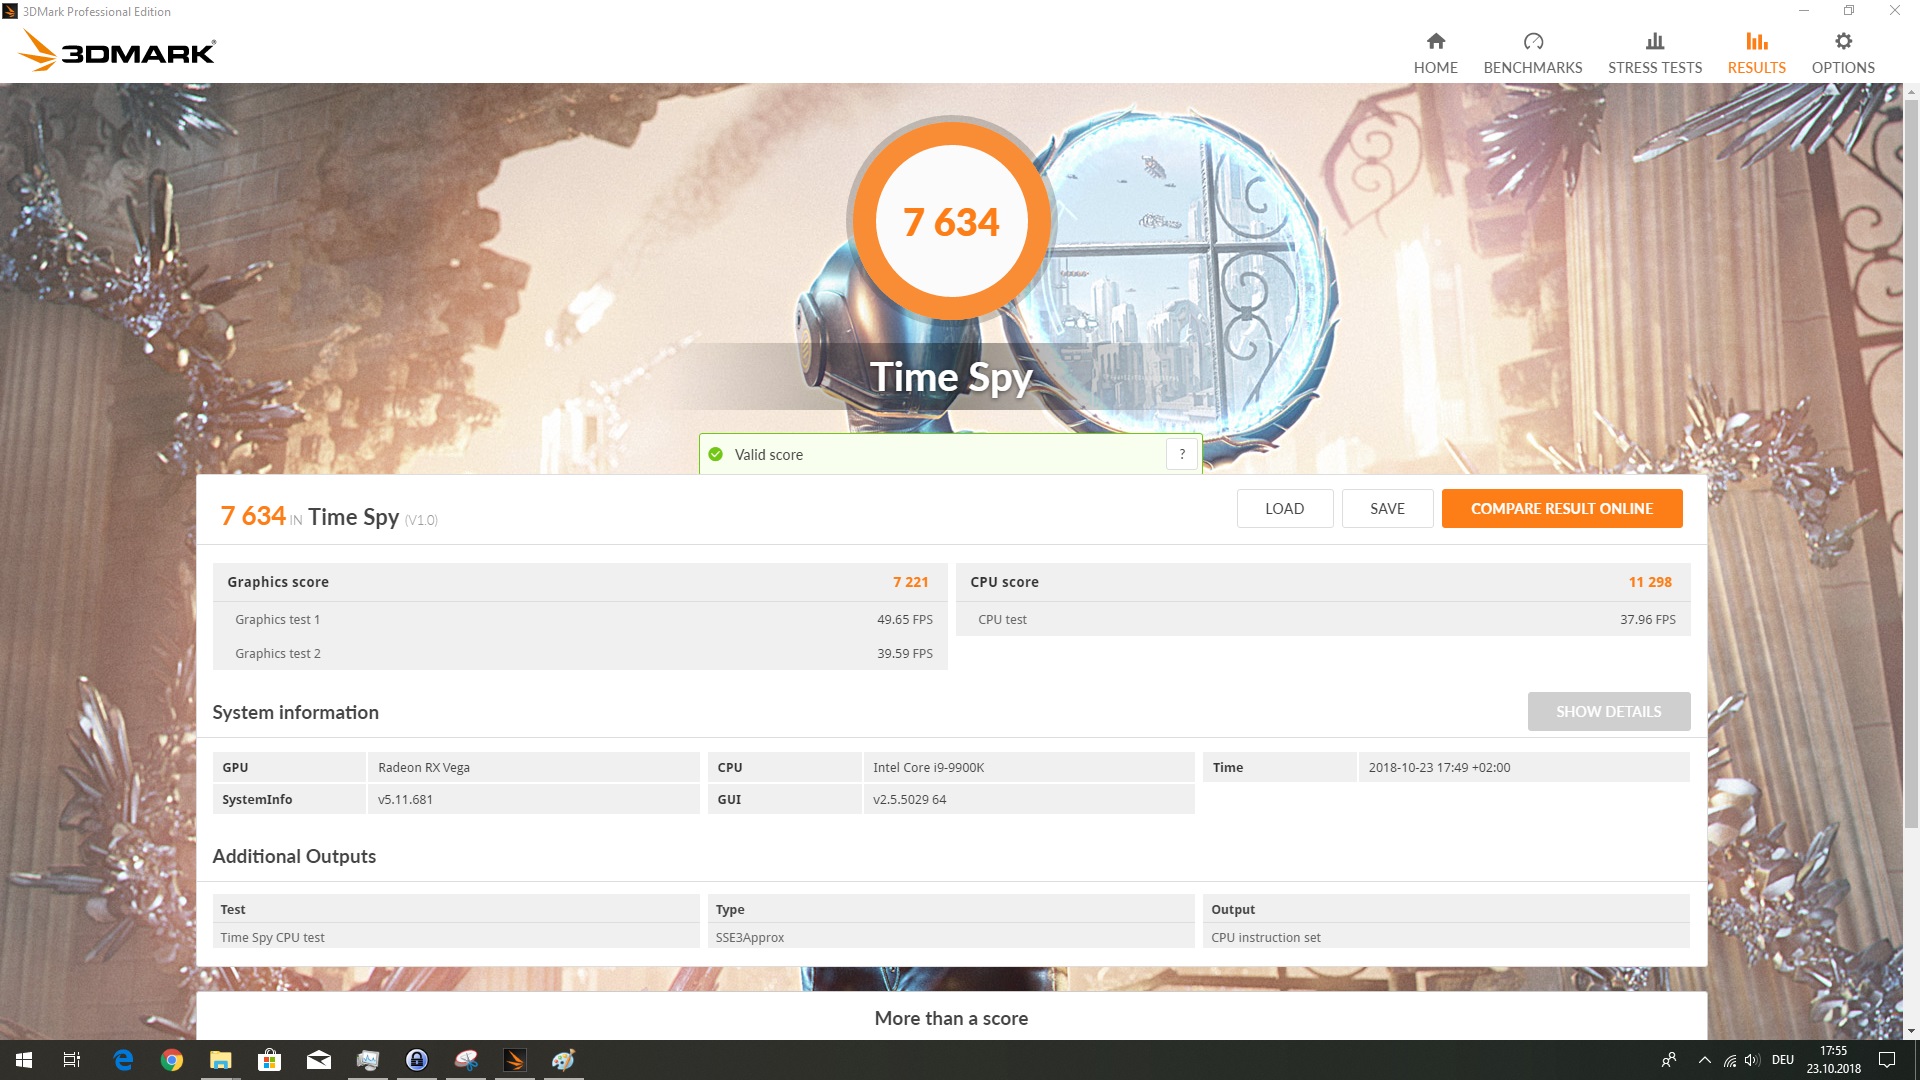
Gaming Performance
The Intel Core i9-9900K performs well in both synthetic benchmarks and in gaming tests. Unfortunately, we equipped our Core i7-8700K test system with a better graphics card, so the results are somewhat skewed, but the Core i9-9900K can keep up with its predecessor regardless of the difference in GPU power. We will soon retest the Core i7-8700K with an RX Vega 64 to provide a better comparison between the two Intel CPUs. The Core i9-9900K has the edge over its AMD counterparts though.
| Performance Rating - Percent | |
| NVIDIA GeForce GTX 1080 Ti (Desktop) -4! | |
| AMD Radeon RX Vega 64 | |
| AMD Radeon RX Vega 64 | |
| AMD Radeon RX Vega 64 | |
| AMD Radeon RX Vega 64 | |
| 3DMark | |
| 2560x1440 Time Spy Graphics | |
| AMD Radeon RX Vega 64 | |
| AMD Radeon RX Vega 64 | |
| AMD Radeon RX Vega 64 | |
| AMD Radeon RX Vega 64 | |
| 1280x720 Sky Diver Graphics | |
| AMD Radeon RX Vega 64 | |
| AMD Radeon RX Vega 64 | |
| AMD Radeon RX Vega 64 | |
| AMD Radeon RX Vega 64 | |
| 1280x720 Cloud Gate Standard Graphics | |
| NVIDIA GeForce GTX 1080 Ti (Desktop) | |
| AMD Radeon RX Vega 64 | |
| AMD Radeon RX Vega 64 | |
| AMD Radeon RX Vega 64 | |
| AMD Radeon RX Vega 64 | |
| 1920x1080 Fire Strike Graphics | |
| NVIDIA GeForce GTX 1080 Ti (Desktop) | |
| AMD Radeon RX Vega 64 | |
| AMD Radeon RX Vega 64 | |
| AMD Radeon RX Vega 64 | |
| AMD Radeon RX Vega 64 | |
| 1280x720 Ice Storm Standard Graphics | |
| AMD Radeon RX Vega 64 | |
| AMD Radeon RX Vega 64 | |
| AMD Radeon RX Vega 64 | |
| AMD Radeon RX Vega 64 | |
| 1920x1080 Ice Storm Extreme Graphics | |
| AMD Radeon RX Vega 64 | |
| AMD Radeon RX Vega 64 | |
| AMD Radeon RX Vega 64 | |
| AMD Radeon RX Vega 64 | |
| Performance Rating - Percent | |
| NVIDIA GeForce GTX 1080 Ti (Desktop) -16! | |
| AMD Radeon RX Vega 64 | |
| AMD Radeon RX Vega 64 -6! | |
| AMD Radeon RX Vega 64 | |
| AMD Radeon RX Vega 64 -6! | |
| NVIDIA Titan X Pascal -10! | |
| The Witcher 3 | |
| 1024x768 Low Graphics & Postprocessing | |
| NVIDIA GeForce GTX 1080 Ti (Desktop) | |
| AMD Radeon RX Vega 64 | |
| AMD Radeon RX Vega 64 | |
| AMD Radeon RX Vega 64 | |
| AMD Radeon RX Vega 64 | |
| 1920x1080 Ultra Graphics & Postprocessing (HBAO+) | |
| NVIDIA GeForce GTX 1080 Ti (Desktop) | |
| AMD Radeon RX Vega 64 | |
| AMD Radeon RX Vega 64 | |
| AMD Radeon RX Vega 64 | |
| AMD Radeon RX Vega 64 | |
| Rise of the Tomb Raider | |
| 1024x768 Lowest Preset | |
| AMD Radeon RX Vega 64 | |
| AMD Radeon RX Vega 64 | |
| AMD Radeon RX Vega 64 | |
| AMD Radeon RX Vega 64 | |
| 1920x1080 Very High Preset AA:FX AF:16x | |
| AMD Radeon RX Vega 64 | |
| AMD Radeon RX Vega 64 | |
| AMD Radeon RX Vega 64 | |
| AMD Radeon RX Vega 64 | |
| Battlefield 1 | |
| 1280x720 Low Preset | |
| AMD Radeon RX Vega 64 | |
| AMD Radeon RX Vega 64 | |
| AMD Radeon RX Vega 64 | |
| AMD Radeon RX Vega 64 | |
| 1920x1080 Ultra Preset AA:T | |
| AMD Radeon RX Vega 64 | |
| AMD Radeon RX Vega 64 | |
| AMD Radeon RX Vega 64 | |
| AMD Radeon RX Vega 64 | |
| Assassin´s Creed Origins | |
| 1280x720 Very Low Preset | |
| AMD Radeon RX Vega 64 | |
| AMD Radeon RX Vega 64 | |
| AMD Radeon RX Vega 64 | |
| AMD Radeon RX Vega 64 | |
| 1920x1080 Ultra High Preset | |
| AMD Radeon RX Vega 64 | |
| AMD Radeon RX Vega 64 | |
| AMD Radeon RX Vega 64 | |
| AMD Radeon RX Vega 64 | |
| Final Fantasy XV Benchmark | |
| 1280x720 Lite Quality | |
| AMD Radeon RX Vega 64 | |
| AMD Radeon RX Vega 64 | |
| AMD Radeon RX Vega 64 | |
| AMD Radeon RX Vega 64 | |
| 1920x1080 High Quality | |
| AMD Radeon RX Vega 64 | |
| AMD Radeon RX Vega 64 | |
| AMD Radeon RX Vega 64 | |
| AMD Radeon RX Vega 64 | |
| AMD Radeon RX Vega 64 | |
| Far Cry 5 | |
| 1280x720 Low Preset AA:T | |
| AMD Radeon RX Vega 64 | |
| AMD Radeon RX Vega 64 | |
| AMD Radeon RX Vega 64 | |
| AMD Radeon RX Vega 64 | |
| NVIDIA Titan X Pascal | |
| 1920x1080 Ultra Preset AA:T | |
| AMD Radeon RX Vega 64 | |
| AMD Radeon RX Vega 64 | |
| AMD Radeon RX Vega 64 | |
| NVIDIA Titan X Pascal | |
| AMD Radeon RX Vega 64 | |
| Shadow of the Tomb Raider | |
| 1280x720 Lowest Preset | |
| AMD Radeon RX Vega 64 | |
| NVIDIA Titan X Pascal | |
| AMD Radeon RX Vega 64 | |
| 1920x1080 Highest Preset AA:T | |
| NVIDIA Titan X Pascal | |
| AMD Radeon RX Vega 64 | |
| AMD Radeon RX Vega 64 | |
| Forza Horizon 4 | |
| 1280x720 Very Low Preset | |
| AMD Radeon RX Vega 64 | |
| AMD Radeon RX Vega 64 | |
| NVIDIA Titan X Pascal | |
| 1920x1080 Ultra Preset AA:2xMS | |
| AMD Radeon RX Vega 64 | |
| AMD Radeon RX Vega 64 | |
| NVIDIA Titan X Pascal | |
| Assassin´s Creed Odyssey | |
| 1280x720 Low Preset | |
| NVIDIA Titan X Pascal | |
| AMD Radeon RX Vega 64 | |
| AMD Radeon RX Vega 64 | |
| 1920x1080 Ultra High Preset | |
| NVIDIA Titan X Pascal | |
| AMD Radeon RX Vega 64 | |
| AMD Radeon RX Vega 64 | |
The Intel Core i9-9900K & the AMD Radeon RX Vega 64
| low | med. | high | ultra | 4K | |
| The Witcher 3 (2015) | 332.1 | 232.3 | 137.9 | 80.1 | 51.2 |
| Rise of the Tomb Raider (2016) | 305.2 | 193.3 | 118.8 | 100.8 | 51.2 |
| Battlefield 1 (2016) | 200 | 200 | 166.2 | 148 | 65.6 |
| Assassin´s Creed Origins (2017) | 105 | 88 | 82 | 70 | 34 |
| Final Fantasy XV Benchmark (2018) | 172.1 | 96.1 | 62.5 | 28.8 | |
| Far Cry 5 (2018) | 167 | 134 | 124 | 117 | 46 |
| Shadow of the Tomb Raider (2018) | 207 | 115 | 104 | 91 | 32 |
| Forza Horizon 4 (2018) | 252 | 173 | 163 | 132 | 67 |
| Assassin´s Creed Odyssey (2018) | 101 | 82 | 67 | 48 | 27 |
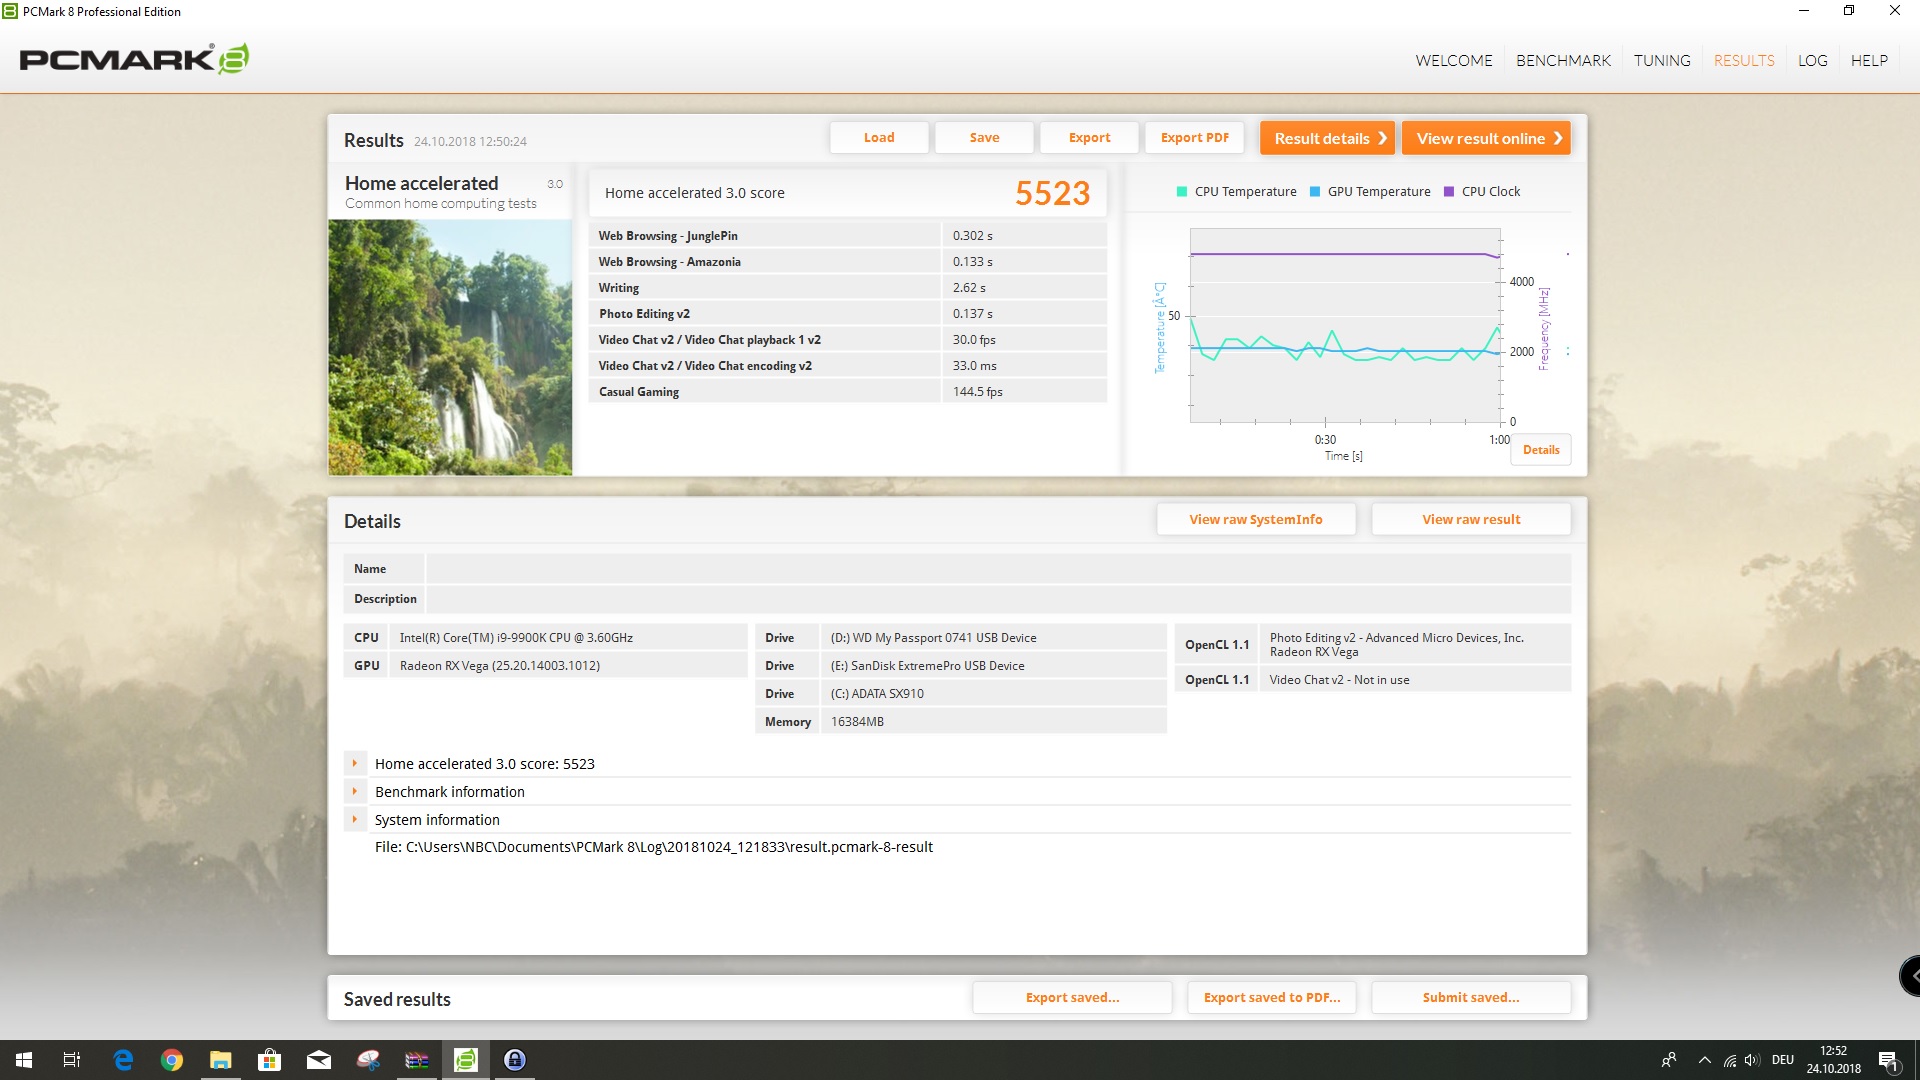
Program Performance
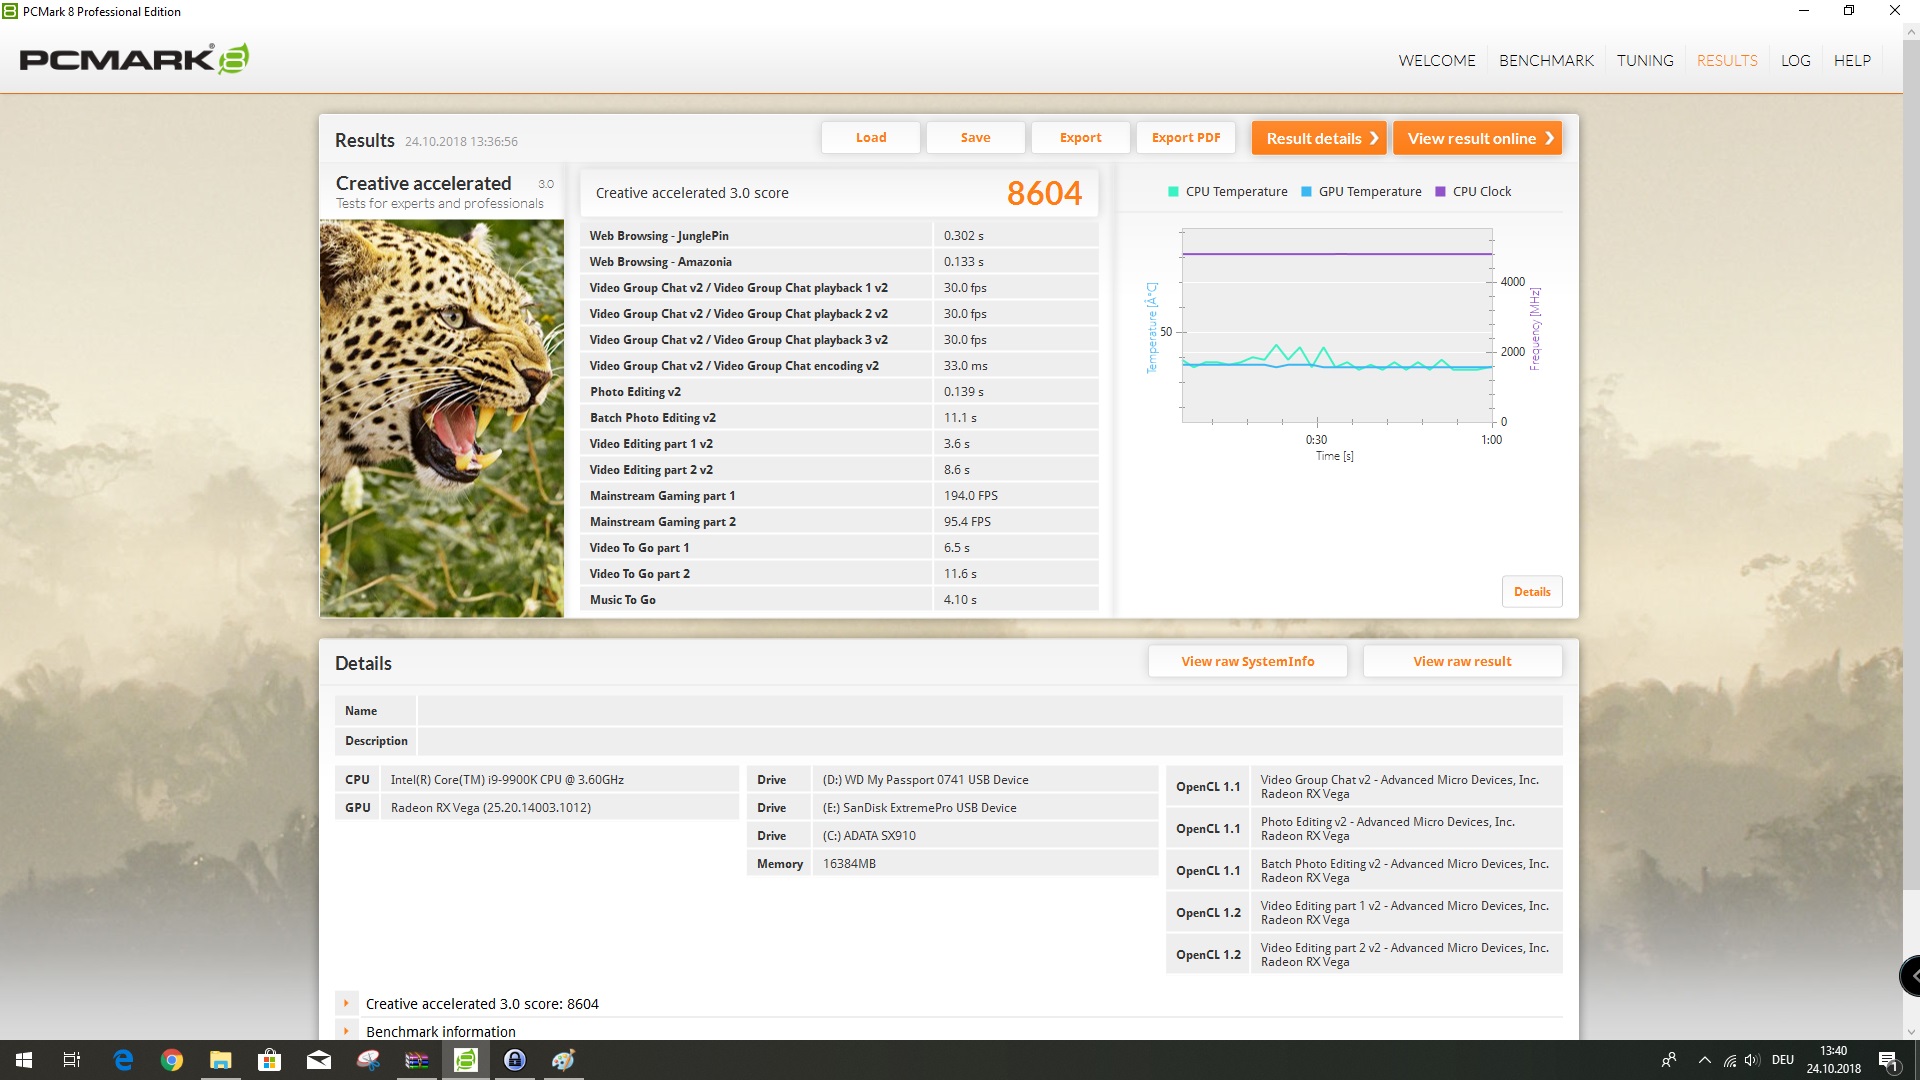
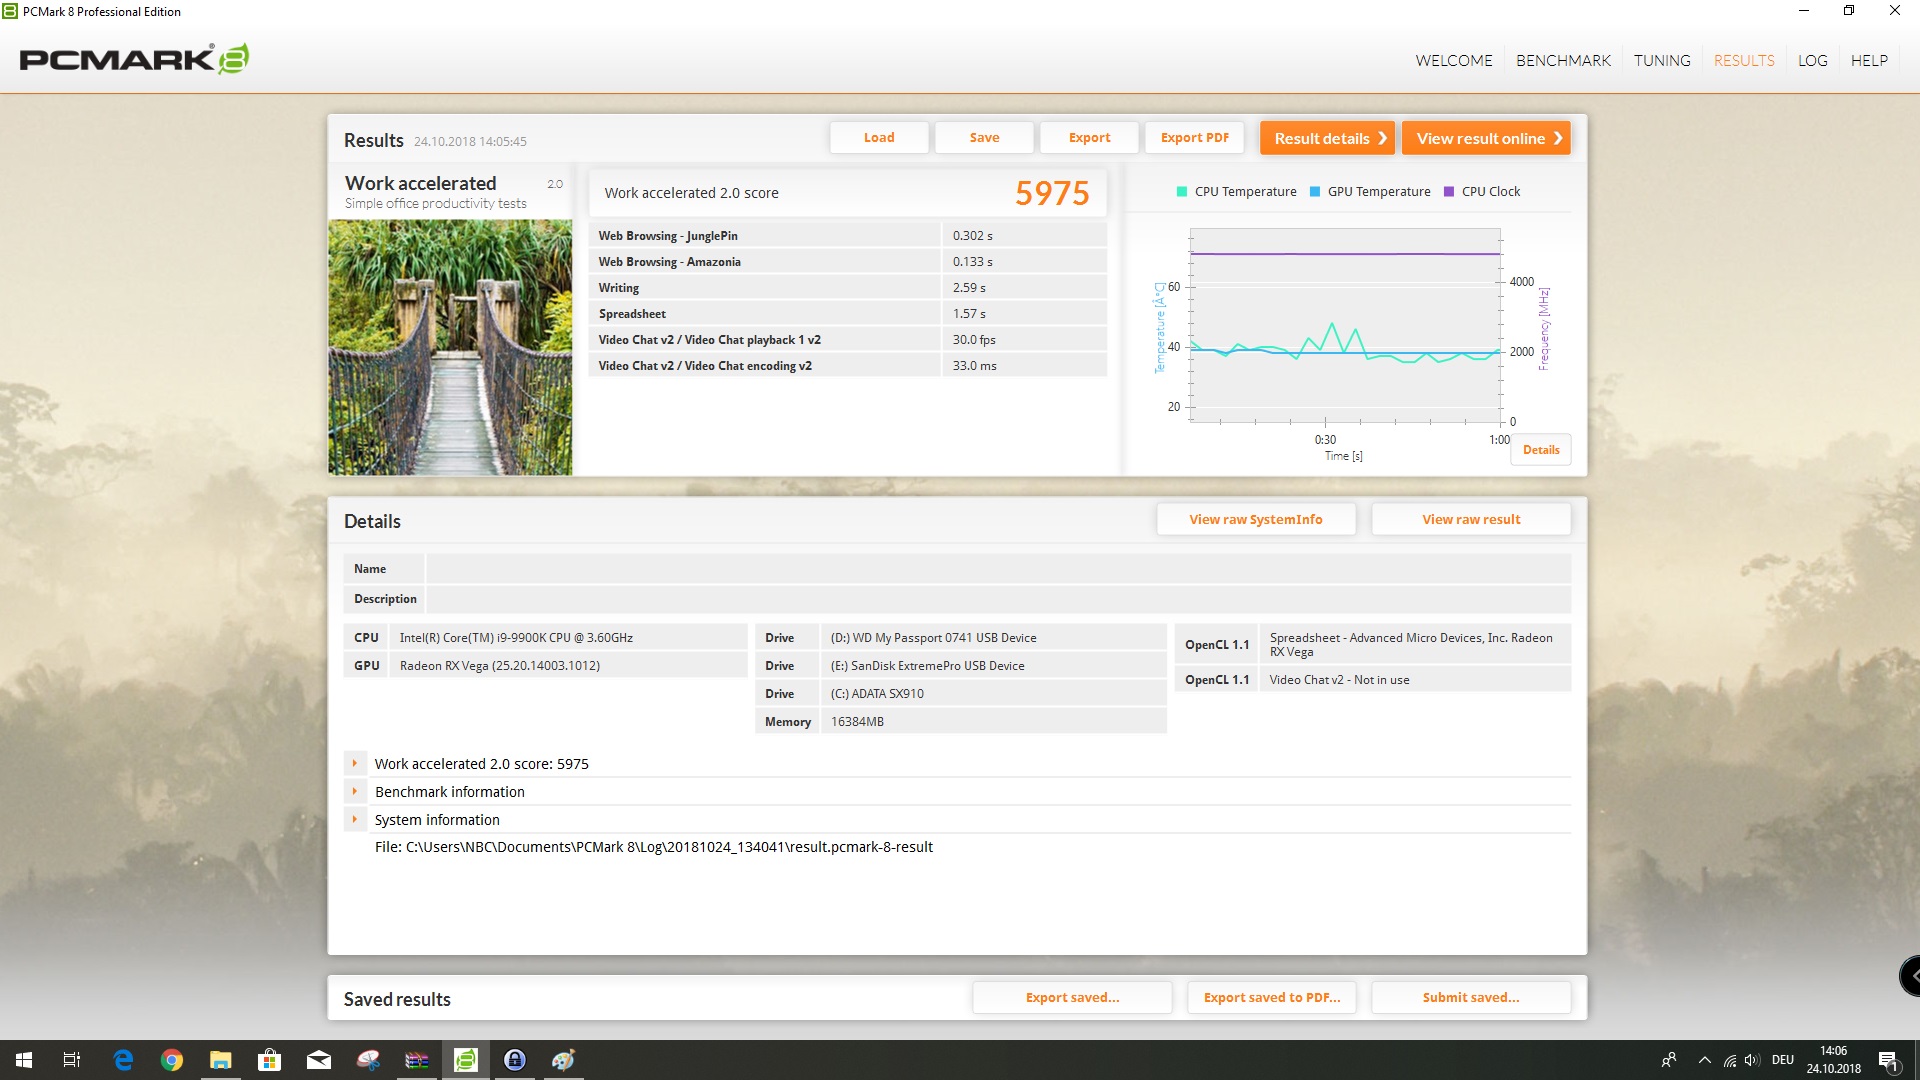
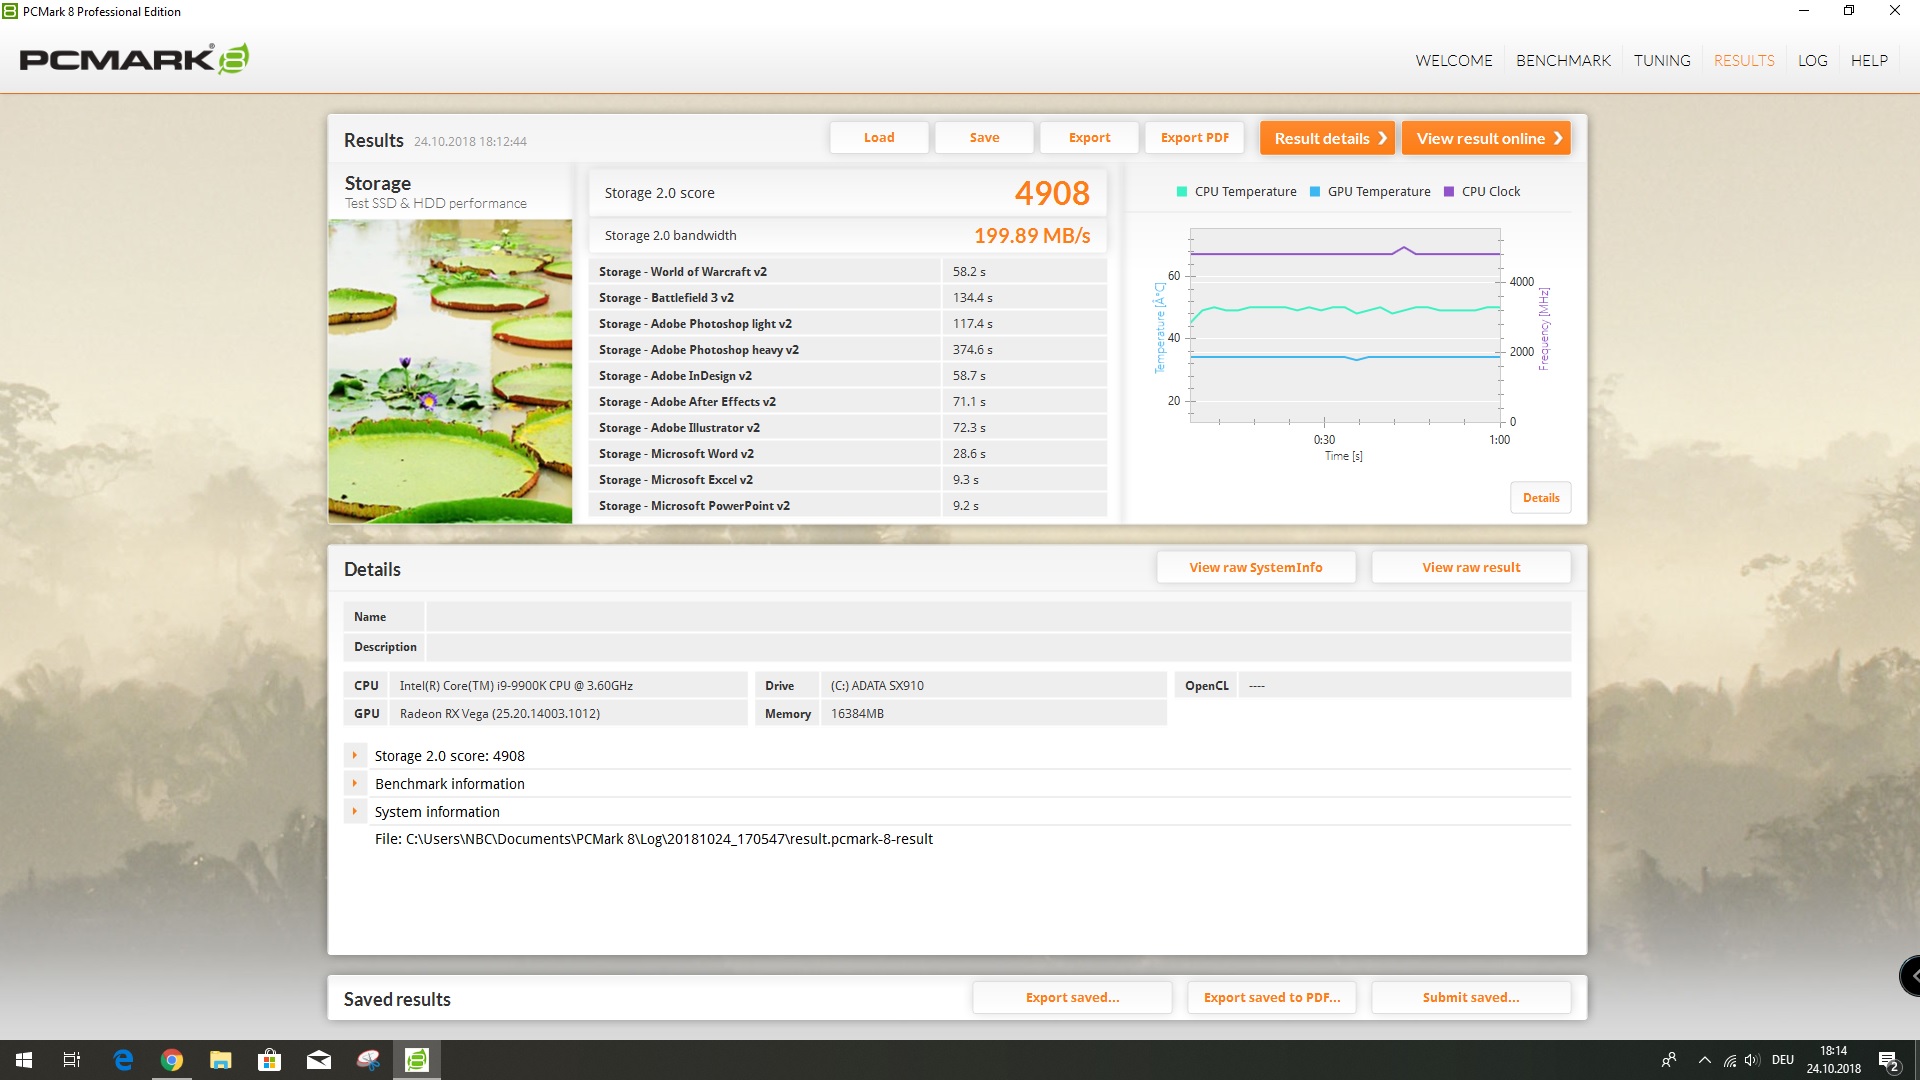
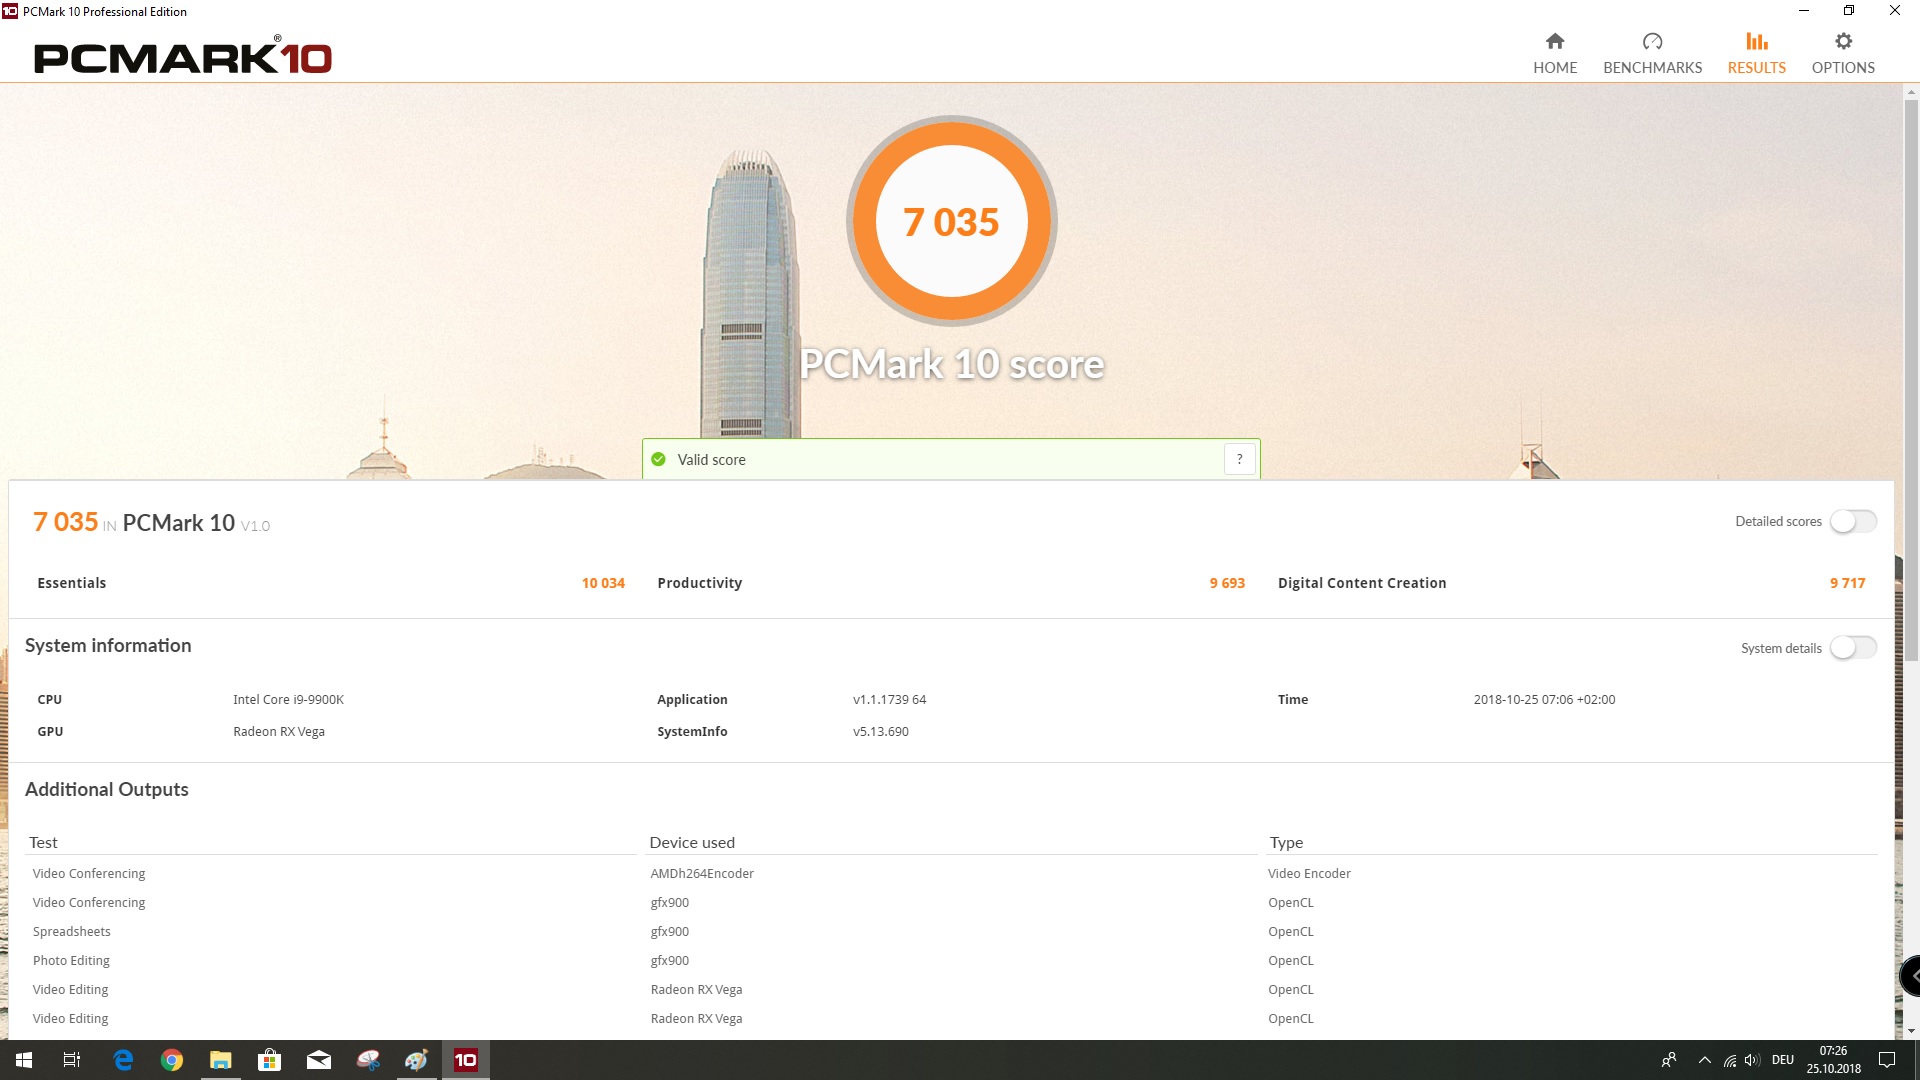
The Core i9-9900K scores well in PCMark 8 too, demonstrating that it is more than a pure gaming CPU. Our test CPU finished around 20% better than the Ryzen 7 2700X in certain PCMark 8 tests. Numerous programs will benefit from the Core i9-9900K’s improved core and thread count, while the processor will easily handle high-resolution videos.
Our test system showed no great weaknesses in daily use either, even though we used a conventional SATA SSD. Using an NVMe SSD would have improved the benchmark scores and would make our test system feel snappier. However, the Core i9-9900K is so powerful that we did not notice the bottleneck associated with the slower SATA SSD. The Core i9-9900K also performs noticeably better than the Core i7-8700K in multi-threaded applications thanks to the two additional cores and four threads at its disposal.
| PCMark 8 | |
| Work Score Accelerated v2 | |
| Intel Core i9-9900K | |
| AMD Ryzen 7 2700X | |
| Intel Core i7-8700K | |
| AMD Ryzen 5 2600X | |
| AMD Ryzen Threadripper 2950X | |
| AMD Ryzen Threadripper 1950X | |
| Creative Score Accelerated v2 | |
| Intel Core i9-9900K | |
| AMD Ryzen 7 2700X | |
| AMD Ryzen Threadripper 1950X | |
| Intel Core i7-8700K | |
| AMD Ryzen 5 2600X | |
| AMD Ryzen Threadripper 2950X | |
| Home Score Accelerated v2 | |
| Intel Core i9-9900K | |
| Intel Core i7-8700K | |
| AMD Ryzen 7 2700X | |
| AMD Ryzen 5 2600X | |
| AMD Ryzen Threadripper 1950X | |
| AMD Ryzen Threadripper 2950X | |
| PCMark 10 - Score | |
| AMD Ryzen 7 2700X | |
| AMD Ryzen Threadripper 2950X | |
| AMD Ryzen 5 2600X | |
| AMD Ryzen Threadripper 1950X | |
| Intel Core i9-9900K | |
| Intel Core i7-8700K | |
Emissions
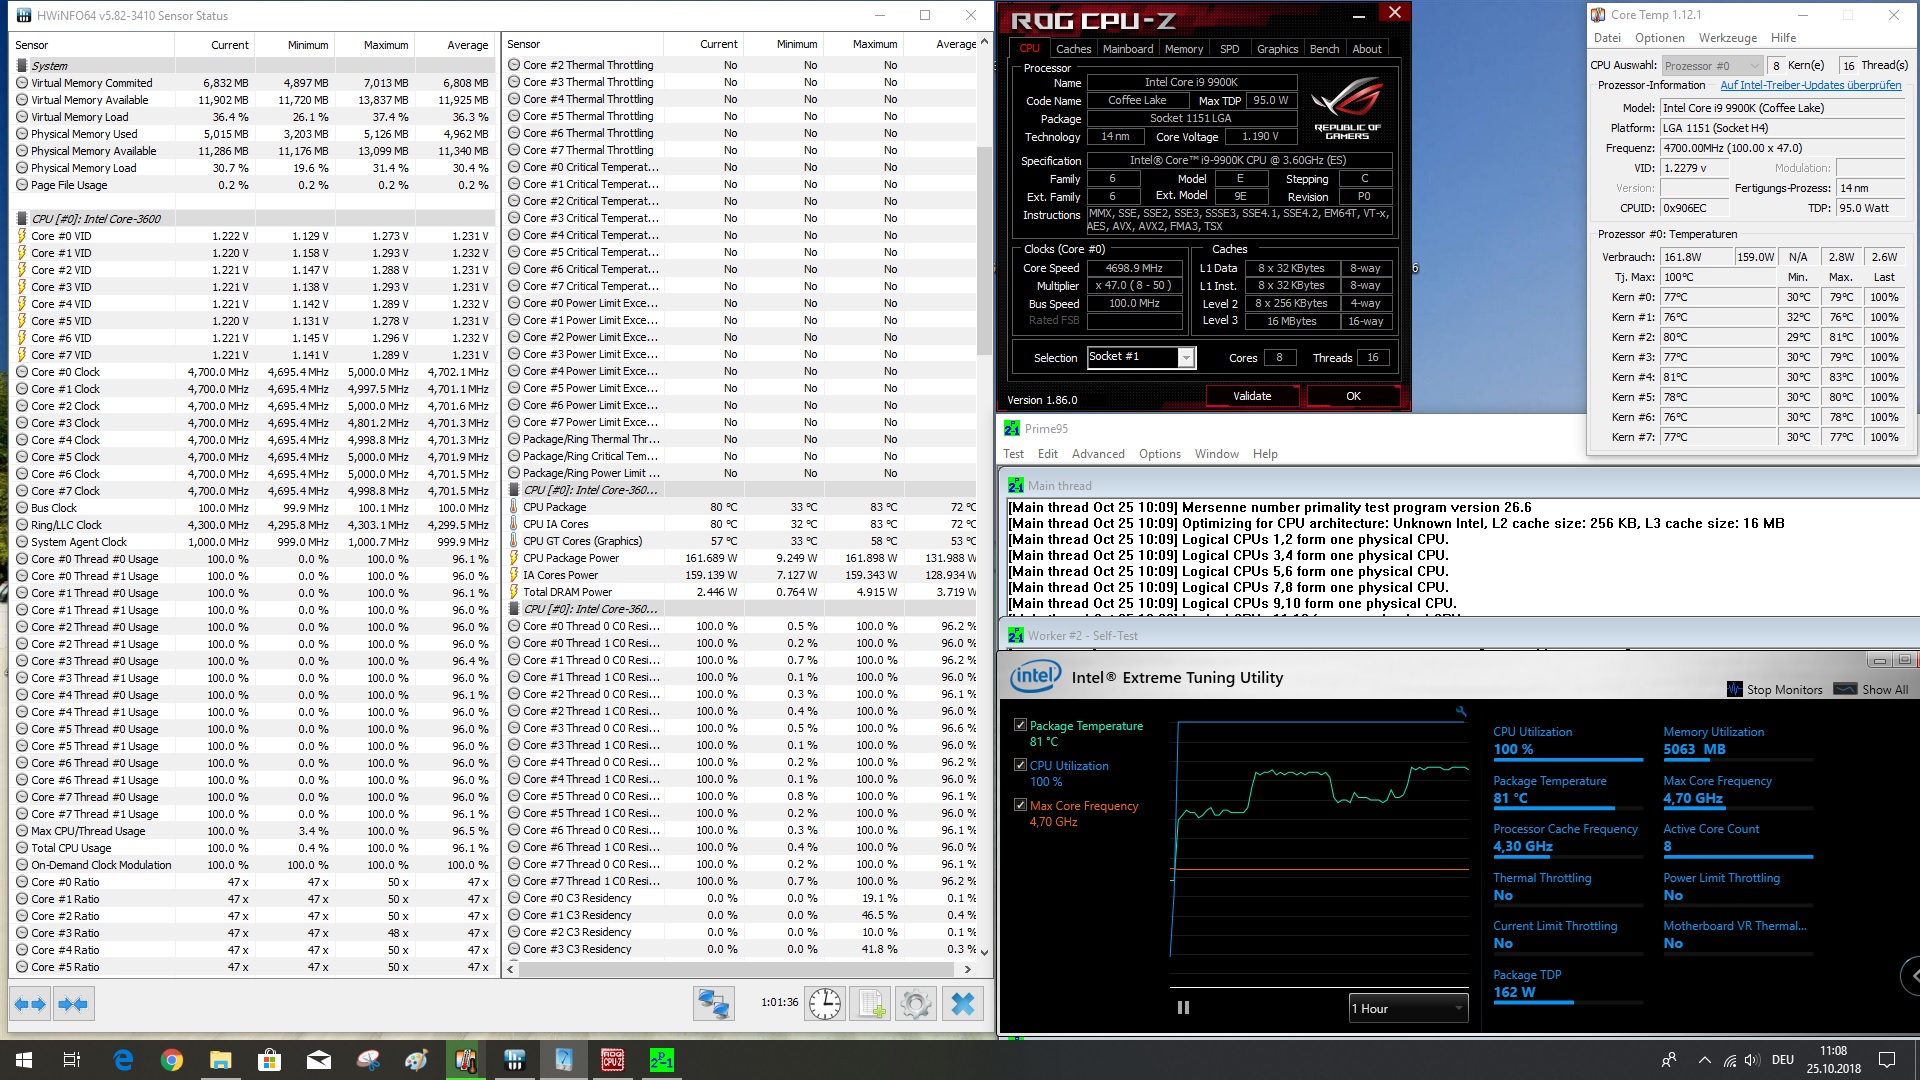
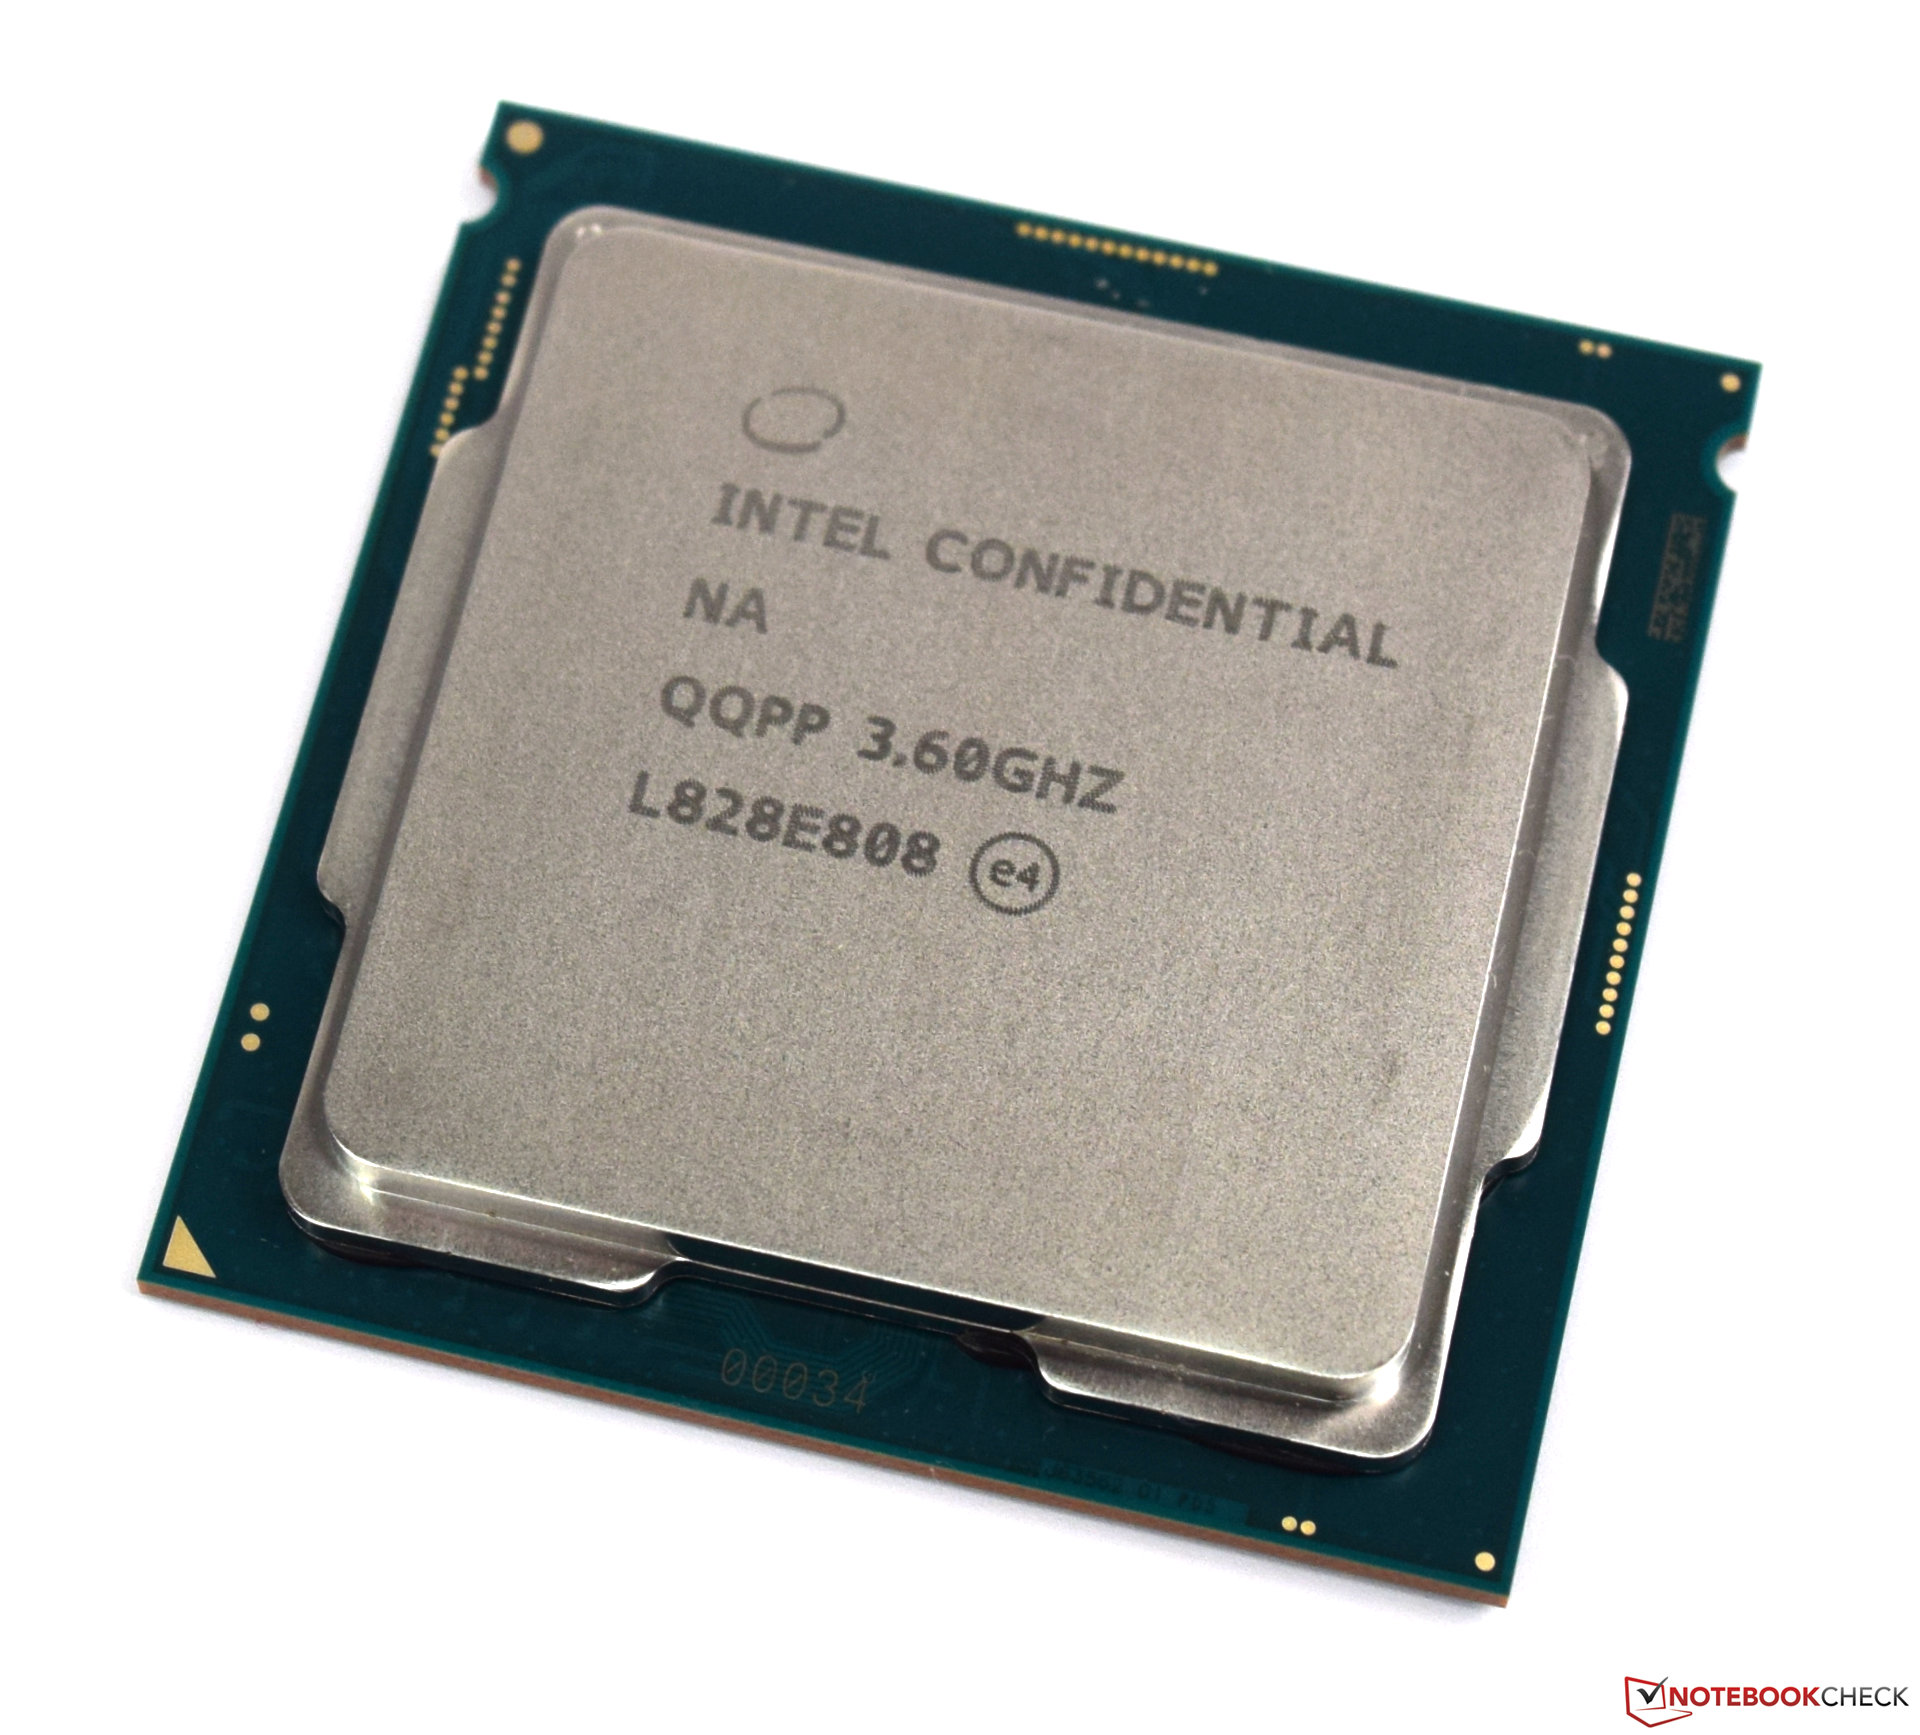
Intel states that its three 9th generation Core processors all have a 95-W maximum TDP. However, our test CPU consumed significantly more than Intel’s claims during our tests. HWiNFO measured the Core i9-9900K consuming an average of 131 W during a one-hour stress test, during which power consumption peaked at 161 W.
The Core i9-9900K gets hot when operating under sustained load too. HWiNFO measured a maximum core temperature of 83 °C (~181 °F) during the same stress test, in which the processor achieved a stable 4.7 GHz across all cores. We chose a 360-mm radiator for our tests primarily because the Core i9-9900K runs hot. We would recommend pairing the CPU with at least one 240-mm radiator to cool the chip efficiently.
It is possible to de-lid the Core i9-9900K like other processors, but Intel’s decision to solder the heat spreader to the lid makes this a riskier experience than de-lidding the Core i7-8700K. Moreover, initial tests online have shown no great improvements from de-lidding the Core i9-9900K. In short, the increased risk of damaging the CPU is not worth it.
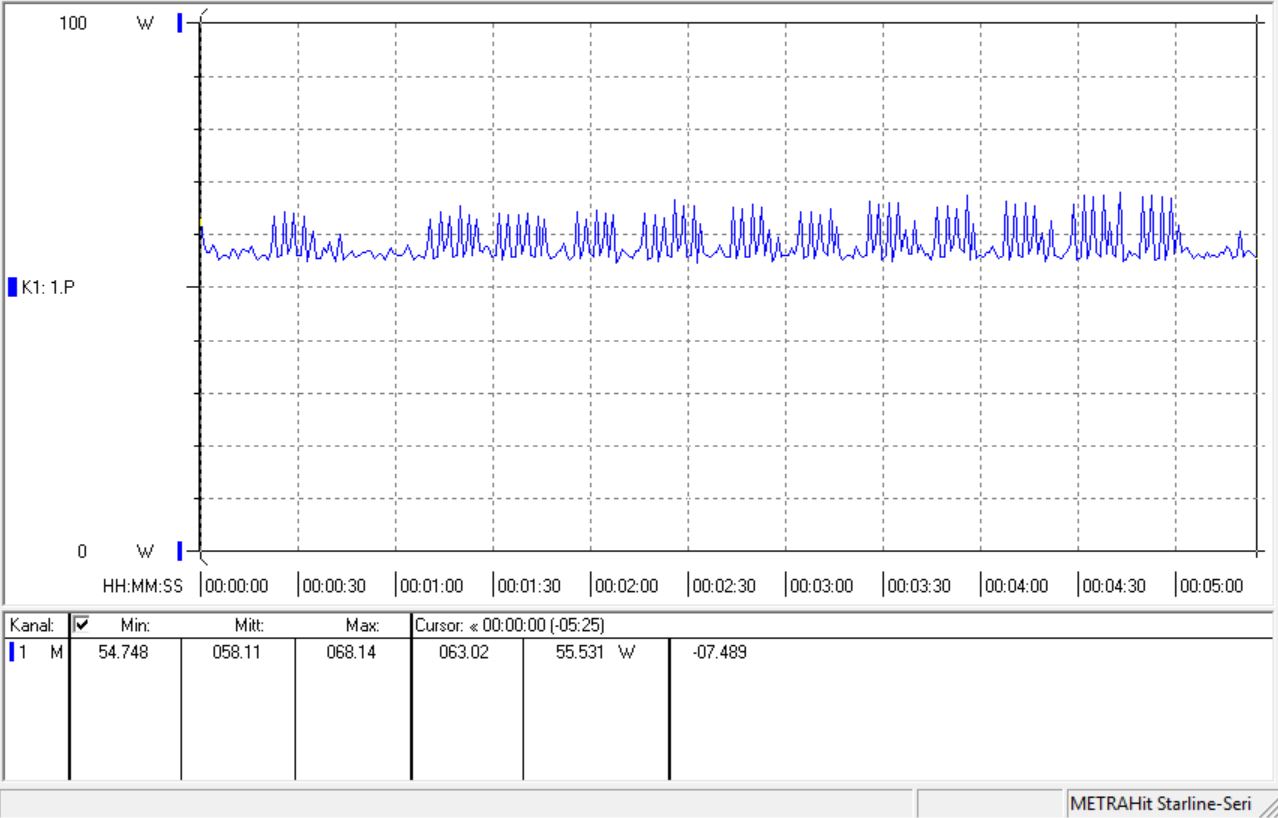
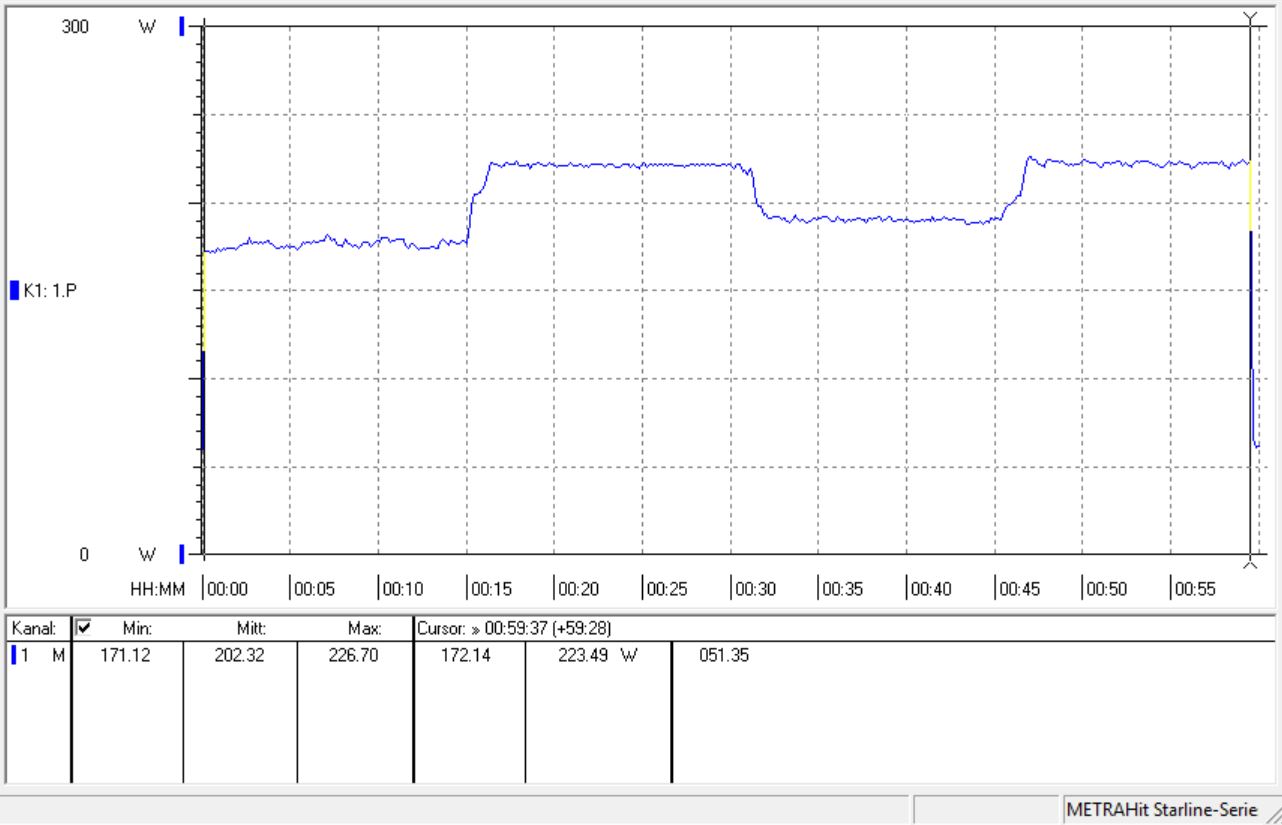
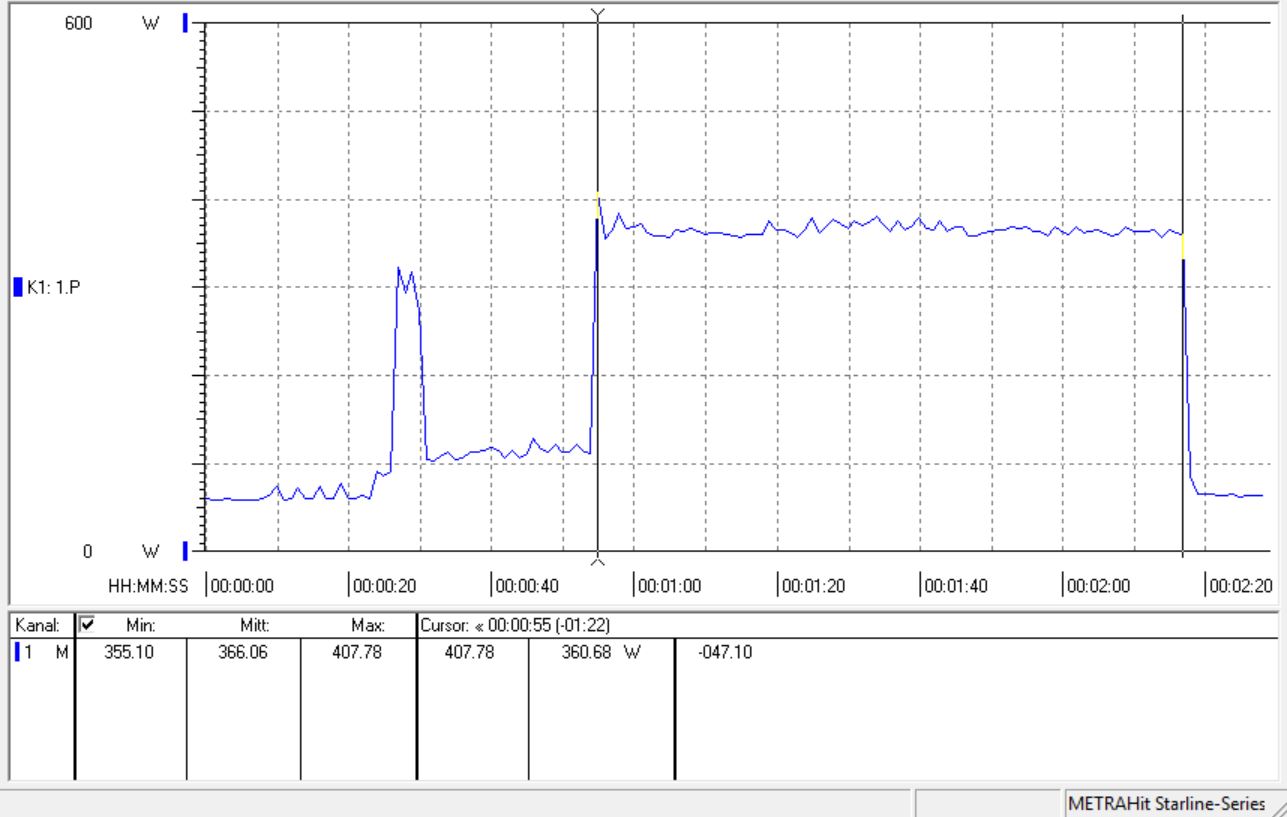
We also took a closer look at how much power our test system consumed in various scenarios. Our test system draws around 58 W from the mains when idling, which ramped up to an average of 202 W during a one-hour stress test. Power consumption further increases to 366 W on average when gaming, of which the AMD Radeon RX Vega 64 consumes its fair share too.
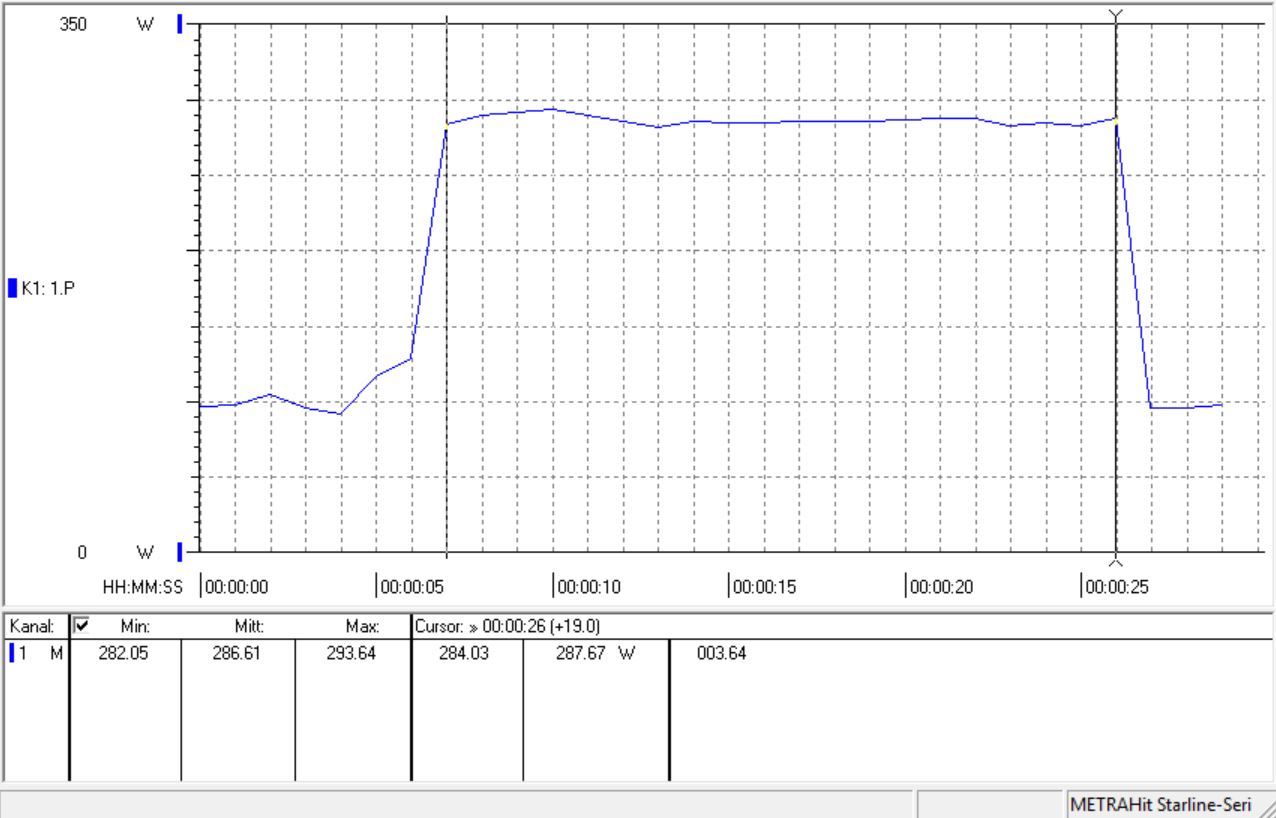
Our Test System - Power Consumption
Overclocking
The Core i9-9900K is easy to overclock thanks its unlocked multiplier and should have all the power that most users would need when paired with a Z390 chipset.
We would recommend becoming familiarwith the BIOS settings and security features before overclocking the CPU. You must adjust numerous settings before the motherboard will allow you to unlock the Core i9-9900K’s full performance, otherwise it will power the system down when power consumption gets higher than pre-defined limits.
As mentioned earlier, not all CPUs are of the same quality either so your success will vary when overclocking your Core i9-9900K. Online retailers like Caseking pre-check their processors before shipping them to buyers to ensure that they reach specified clock speeds.
Our test CPU reached a maximum of 5.0 GHz across all cores, during which the core temperature quickly reached 99 °C (~210 °F), which is 1 °C (~2 °F) short of its maximum safe operating temperature. We increased the voltage and deactivated the default safety features in the BIOS, which allowed the CPU to consume up to 200 W under sustained load. The test system also averaged 286 W as we re-ran the Cinebench R15 multi-thread benchmark loop. By contrast, our test system consumed an average of 203 W in the same benchmark loop with the CPU at stock settings. Moreover, our test AIO struggles to dissipate the additional waste heat generated by the overclocked CPU.
Verdict

It is clear to see what Intel wanted to achieve with its 9th generation Core Desktop processors. AMD has until now had Intel beat with its Ryzen 7 2700X APU, which has eight cores and sixteen simultaneous threads to the Core i7-8700K’s six cores and twelve threads. The release of the octa-core Core i9-9900K redresses the balance, despite it being harder for Intel to scale its processors than it is for AMD.
The Core i9-9900K is considerably more powerful than its effective predecessor and has the edge over the Ryzen 7 2700X too. The difference between the new i9 and the Ryzen 7 is slim in multi-core applications, but Intel has maintained its dominance in terms of single-core performance. We wait with bated breath whether AMD can catch up with next year’s 3000 series.
Intel advertises the Core i9-9900K as the best gaming CPU currently on the market, which is a claim that we can verify when comparing the processor in an identically equipped test system. The Core i9-9900K can squeeze out considerably more graphics performance from the same GPU than its competitors. The benefit at higher resolutions is drastically lower though.
Currently, the Core i9-9900K’s biggest drawback is its price. The CPU currently sells online for between €600 (~£586/$763) to an eye watering €1,000 (~£875/$1,140). By contrast, AMD sells the Ryzen 7 2700X for €307.99 on Amazon.de, while the APU costs $309.89 and £296.98 on Amazon US and UK respectively at the time of writing. The Core i9-9900K is the more powerful processor, but any improvements are not worth an additional €300. We would question whether they are worth the difference between Intel’s recommended price and what the Ryzen 7 2700X currently sells for too. The Core i9-9900K is simply too expensive.
If you want the fastest gaming system and money is no object, then choose the Intel Core i9-9900K. Otherwise, check out other better value for money AMD or Intel processors, the Core i9-9900K cannot justify its extortionate cost.
The Core i9-9900K costs a lot more to run than other processors too. Our test CPU consumes considerably more power than its stated maximum TDP, which drastically increased when we overclocked it. The Core i9-9900K delivers great performance at stock settings anyway, and the benefits of overclocking are minimal to non-existent. Hence, we would recommend against permanently overclocking the Core i9-9900K, it is just not worth it.