 Deutsch
 English
 Español
 Français
 Italiano
 Nederlands
 Polski
 Português
 Русский
 Türkçe
 Svenska
 Chinese
 Magyar
Dell XPS 13 9310 Core i7 Laptop Review: The 11th Gen Tiger Lake Difference
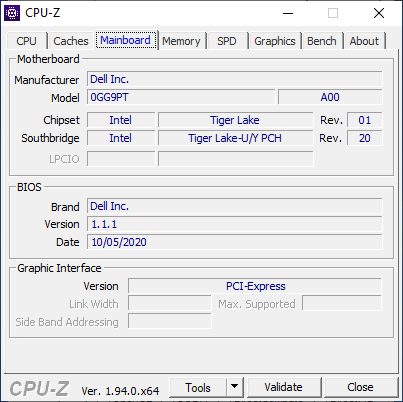
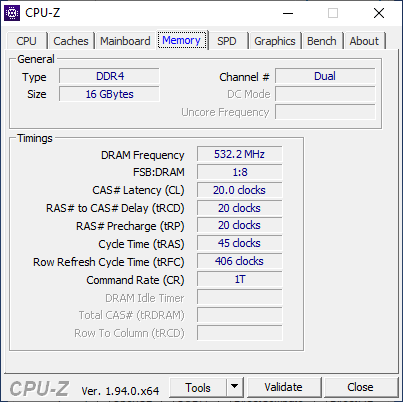
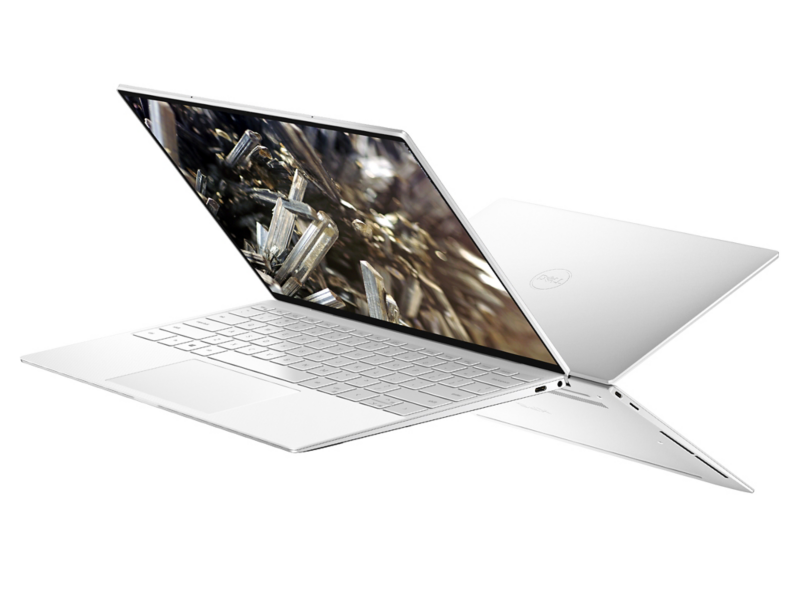
The Dell XPS 13 9300 is barely a year old and its successor is already available. Called the XPS 13 9310, the newer model replaces the 10th gen Intel Ice Lake CPU with 11th gen Tiger Lake options alongside faster memory clock rates. Otherwise, the XPS 13 9310 is visually identical to its immediate predecessor.
For this review, we'll be comparing the performance of the 9310 with the 9300 to see how much of a performance gain users can expect and how temperatures, runtimes, display quality, or power consumption may be different between them — if at all. More information on the chassis and other physical features can be found on our existing XPS 13 9300 review here.
More Dell reviews:
Rating | Date | Model | Weight | Height | Size | Resolution | Best Price |
|---|---|---|---|---|---|---|---|
| 88.1 % | 10/2020 | Dell XPS 13 9310 Core i7 FHD i7-1165G7, Iris Xe G7 96EUs | 1.3 kg | 14.8 mm | 13.40" | 1920x1200 | |
| 88.9 % | 03/2020 | Dell XPS 13 9300 Core i7-1065G7 i7-1065G7, Iris Plus Graphics G7 (Ice Lake 64 EU) | 1.2 kg | 14.8 mm | 13.40" | 1920x1200 | |
| 92.1 % | 06/2020 | Apple MacBook Pro 13 2020 2GHz i5 10th-Gen i5-1038NG7, Iris Plus Graphics G7 (Ice Lake 64 EU) | 1.4 kg | 15.6 mm | 13.30" | 2560x1600 | |
| 87.4 % | 06/2020 | Huawei MateBook X Pro 2020 i7 i7-10510U, GeForce MX250 | 1.3 kg | 14.6 mm | 13.90" | 3000x2000 | |
| 85.3 % | 08/2020 | Lenovo Yoga Slim 7-14ARE R7 4800U, Vega 8 | 1.4 kg | 14.9 mm | 14.00" | 1920x1080 | |
| 88.4 % | 12/2019 | HP Spectre x360 13-aw0013dx i7-1065G7, Iris Plus Graphics G7 (Ice Lake 64 EU) | 1.2 kg | 16.9 mm | 13.30" | 1920x1080 |
Case
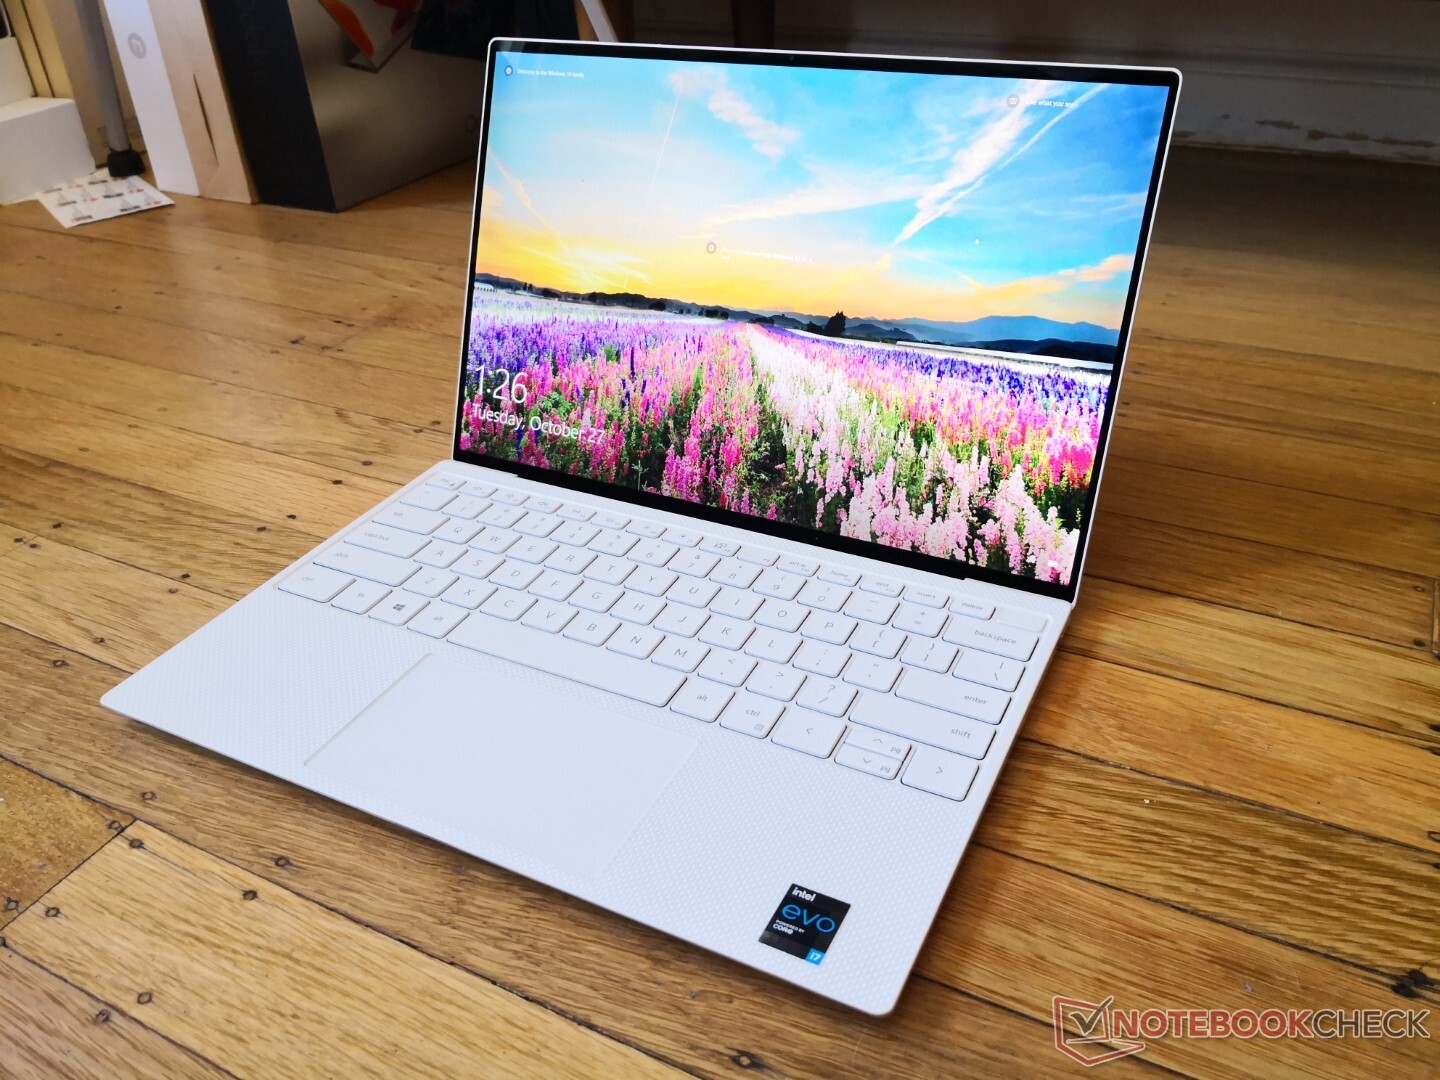
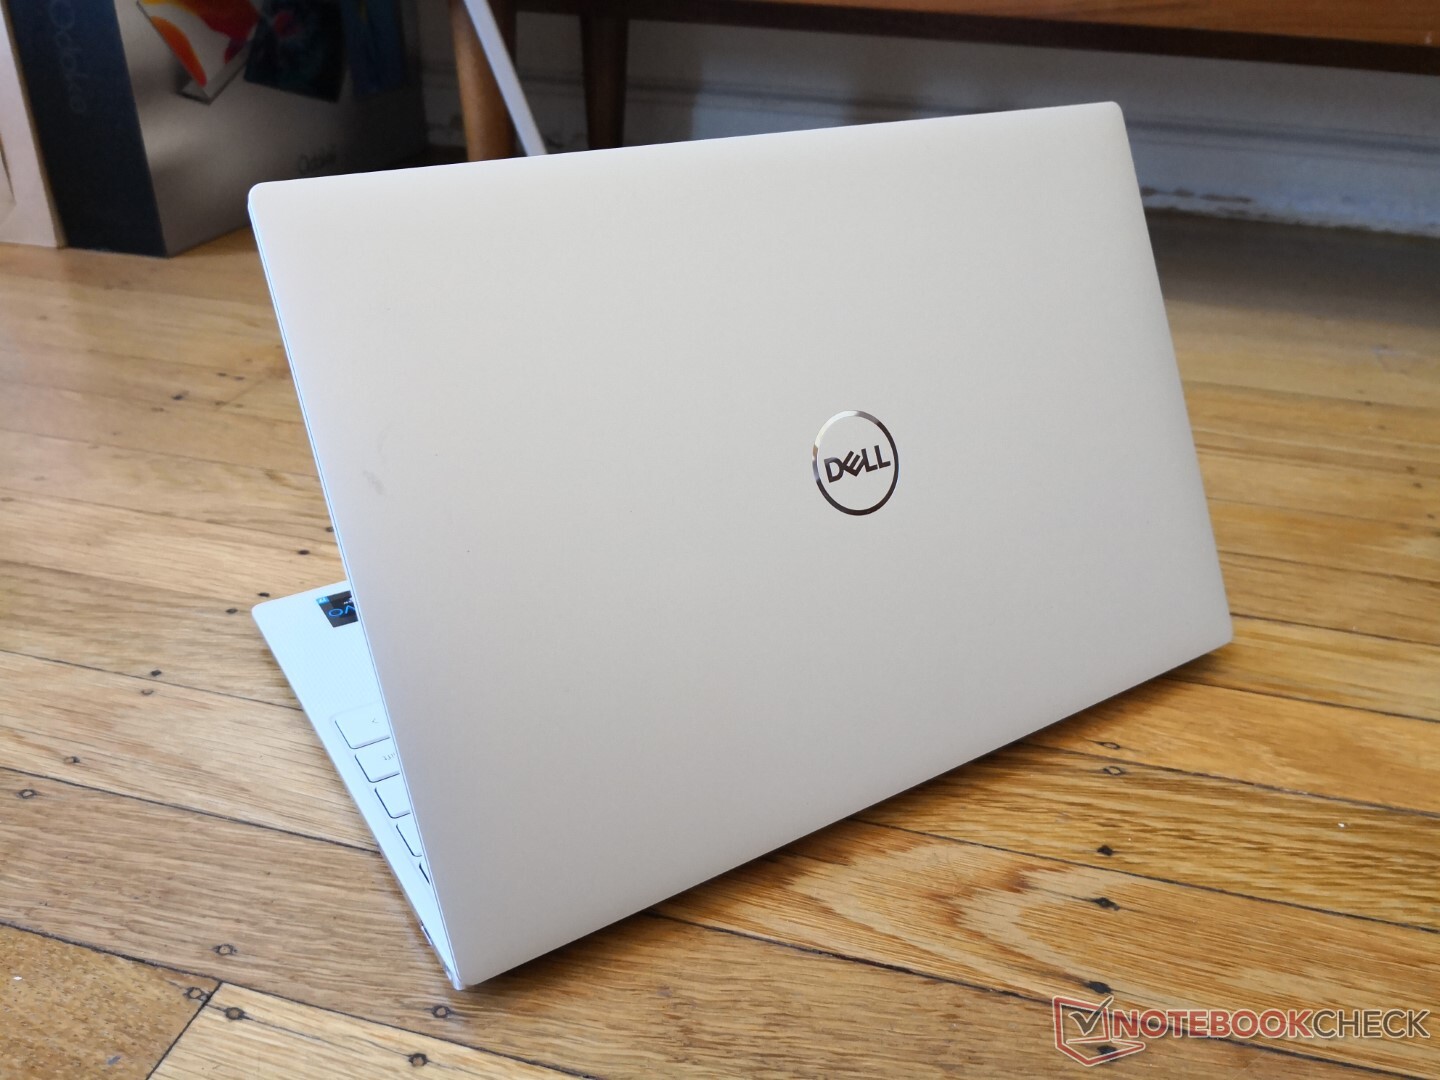
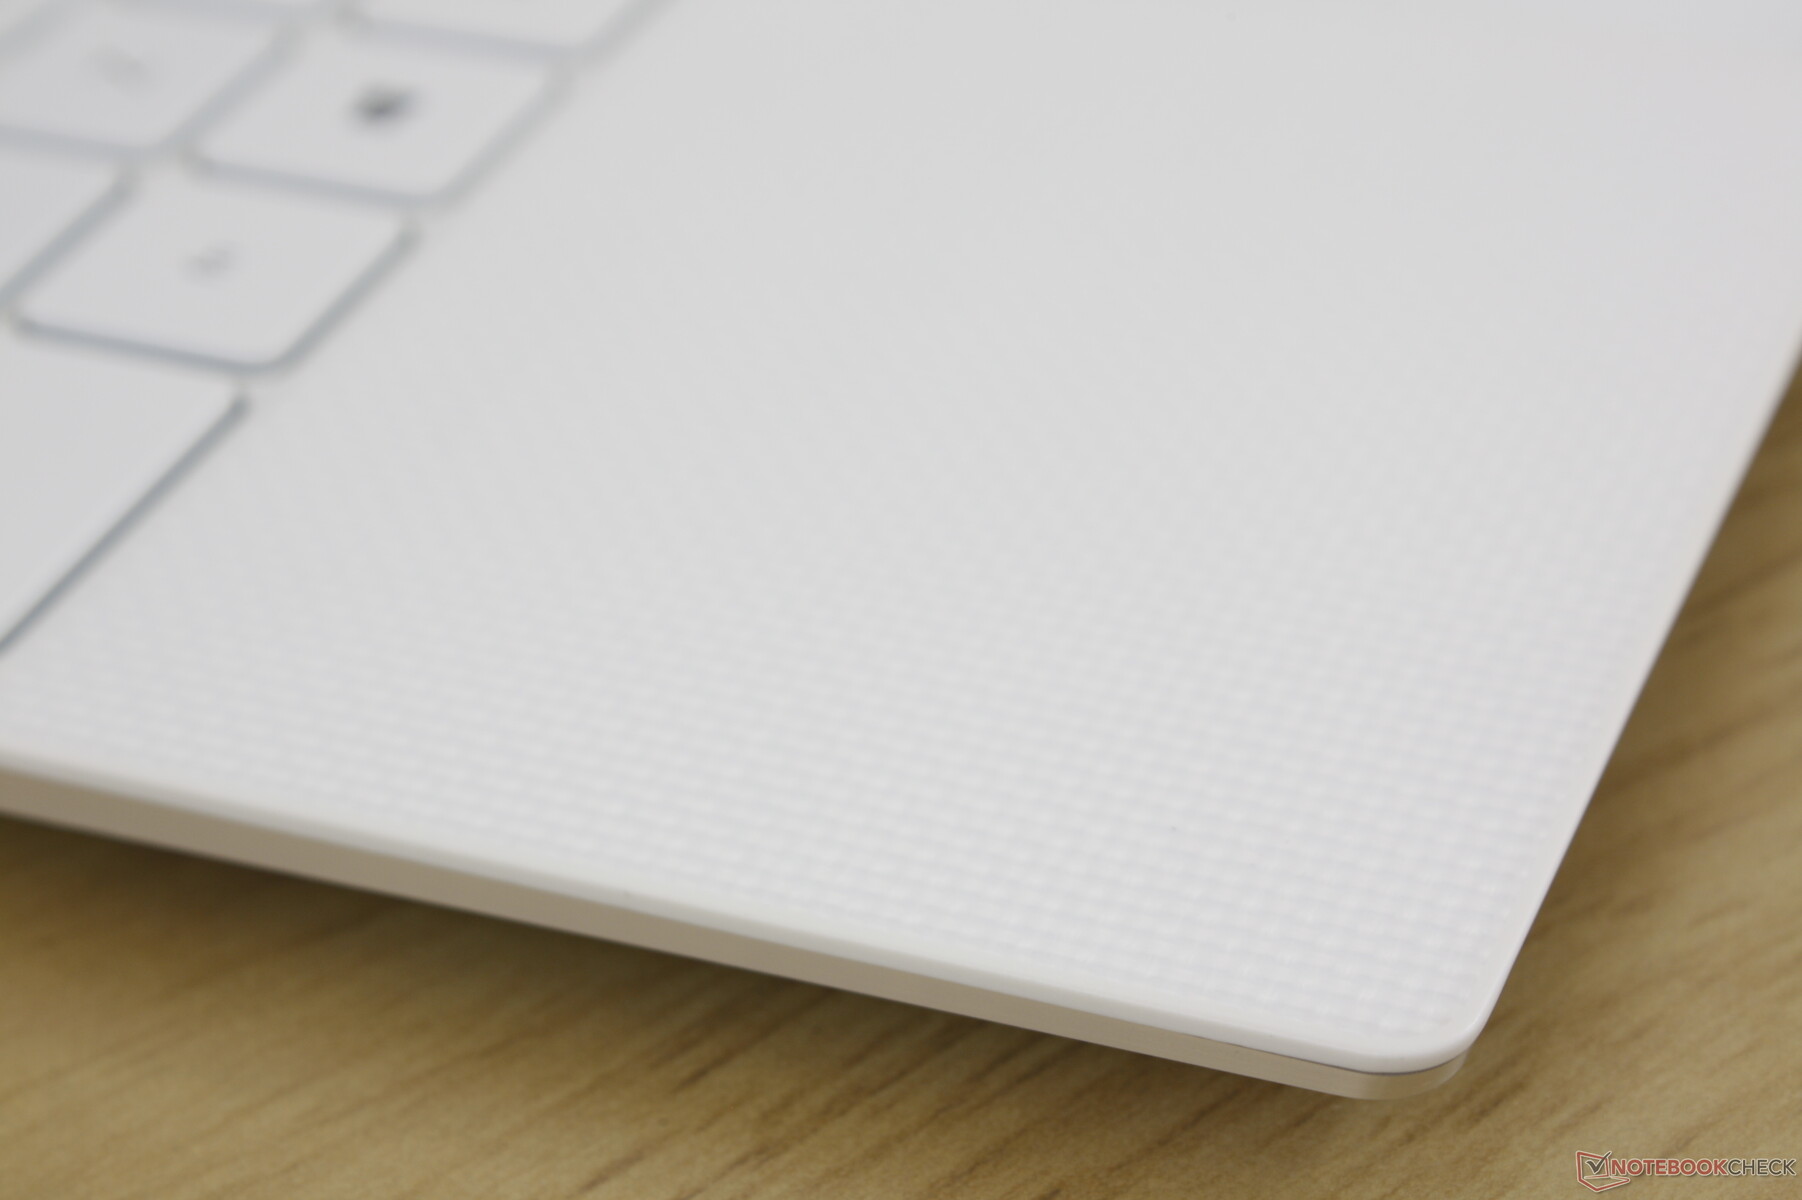
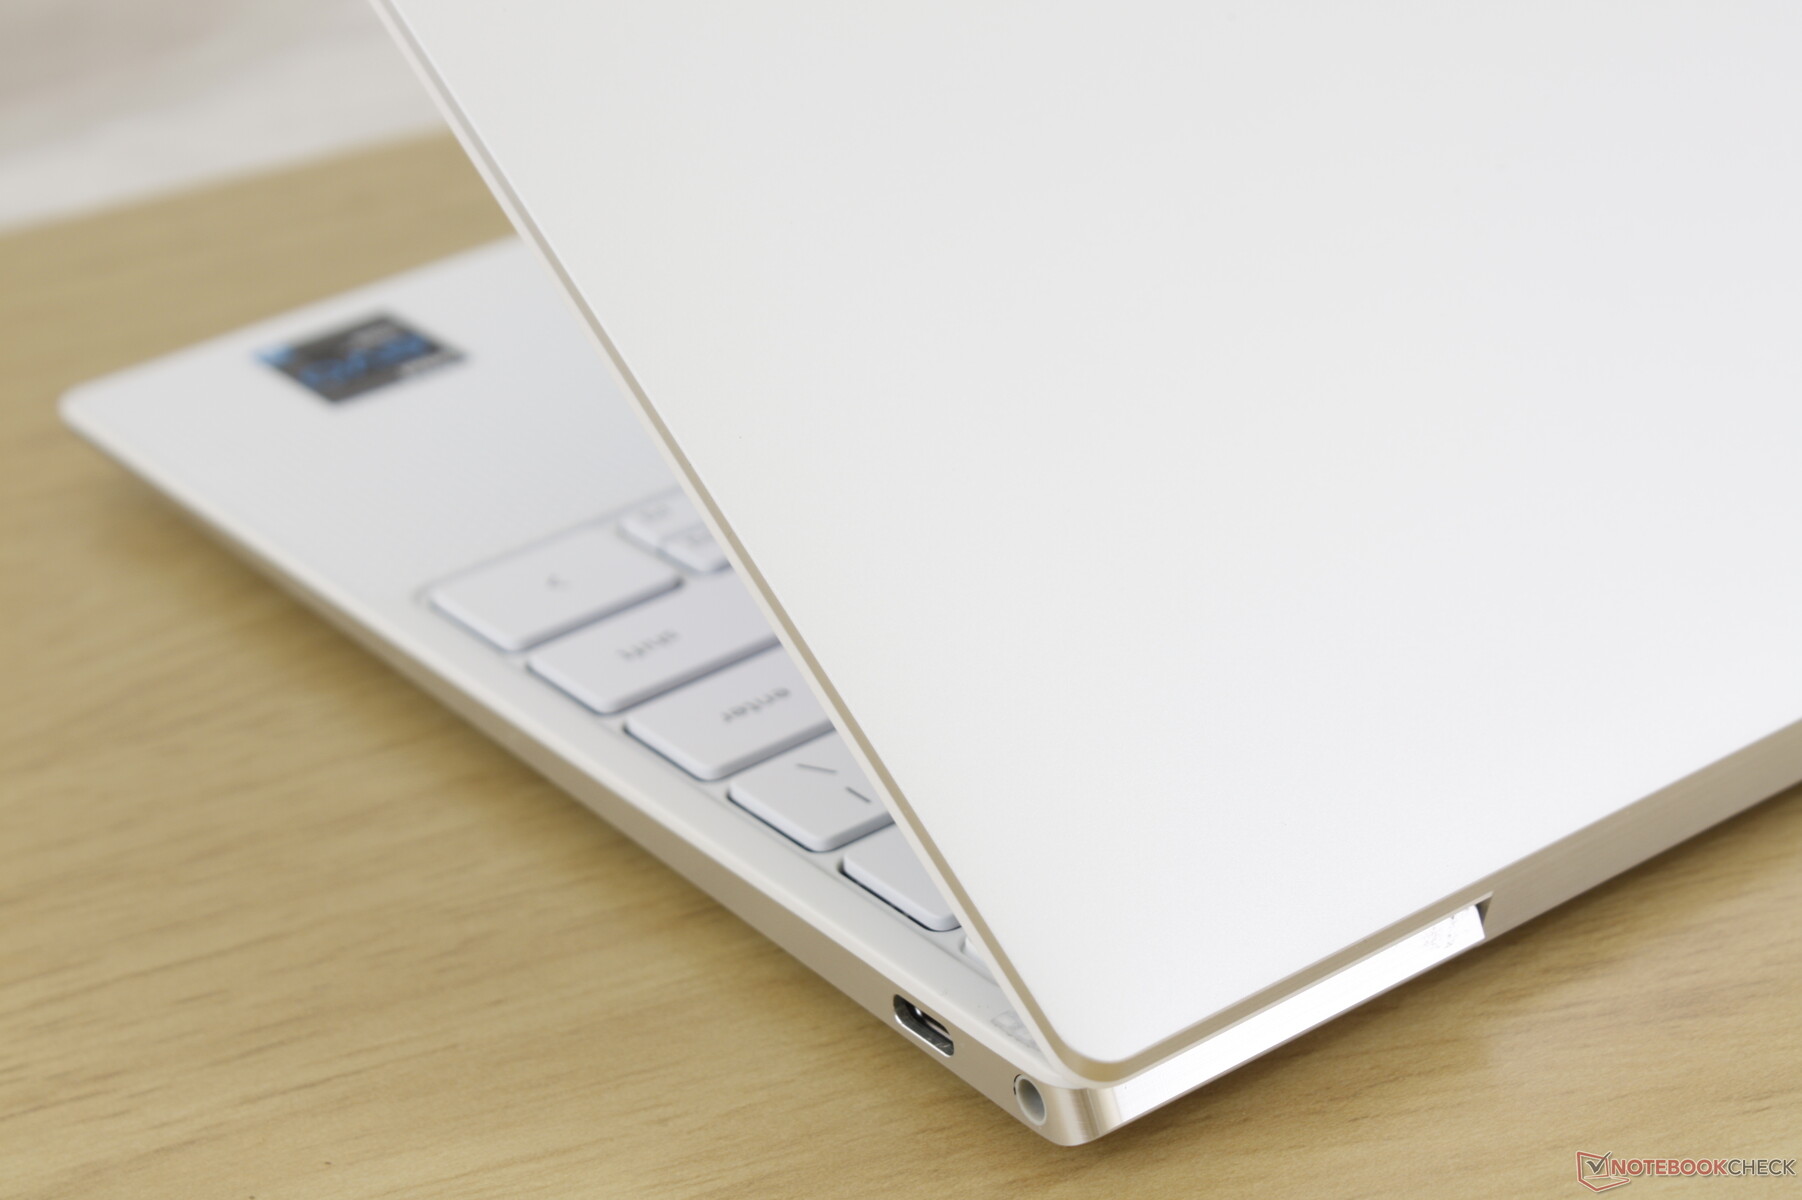
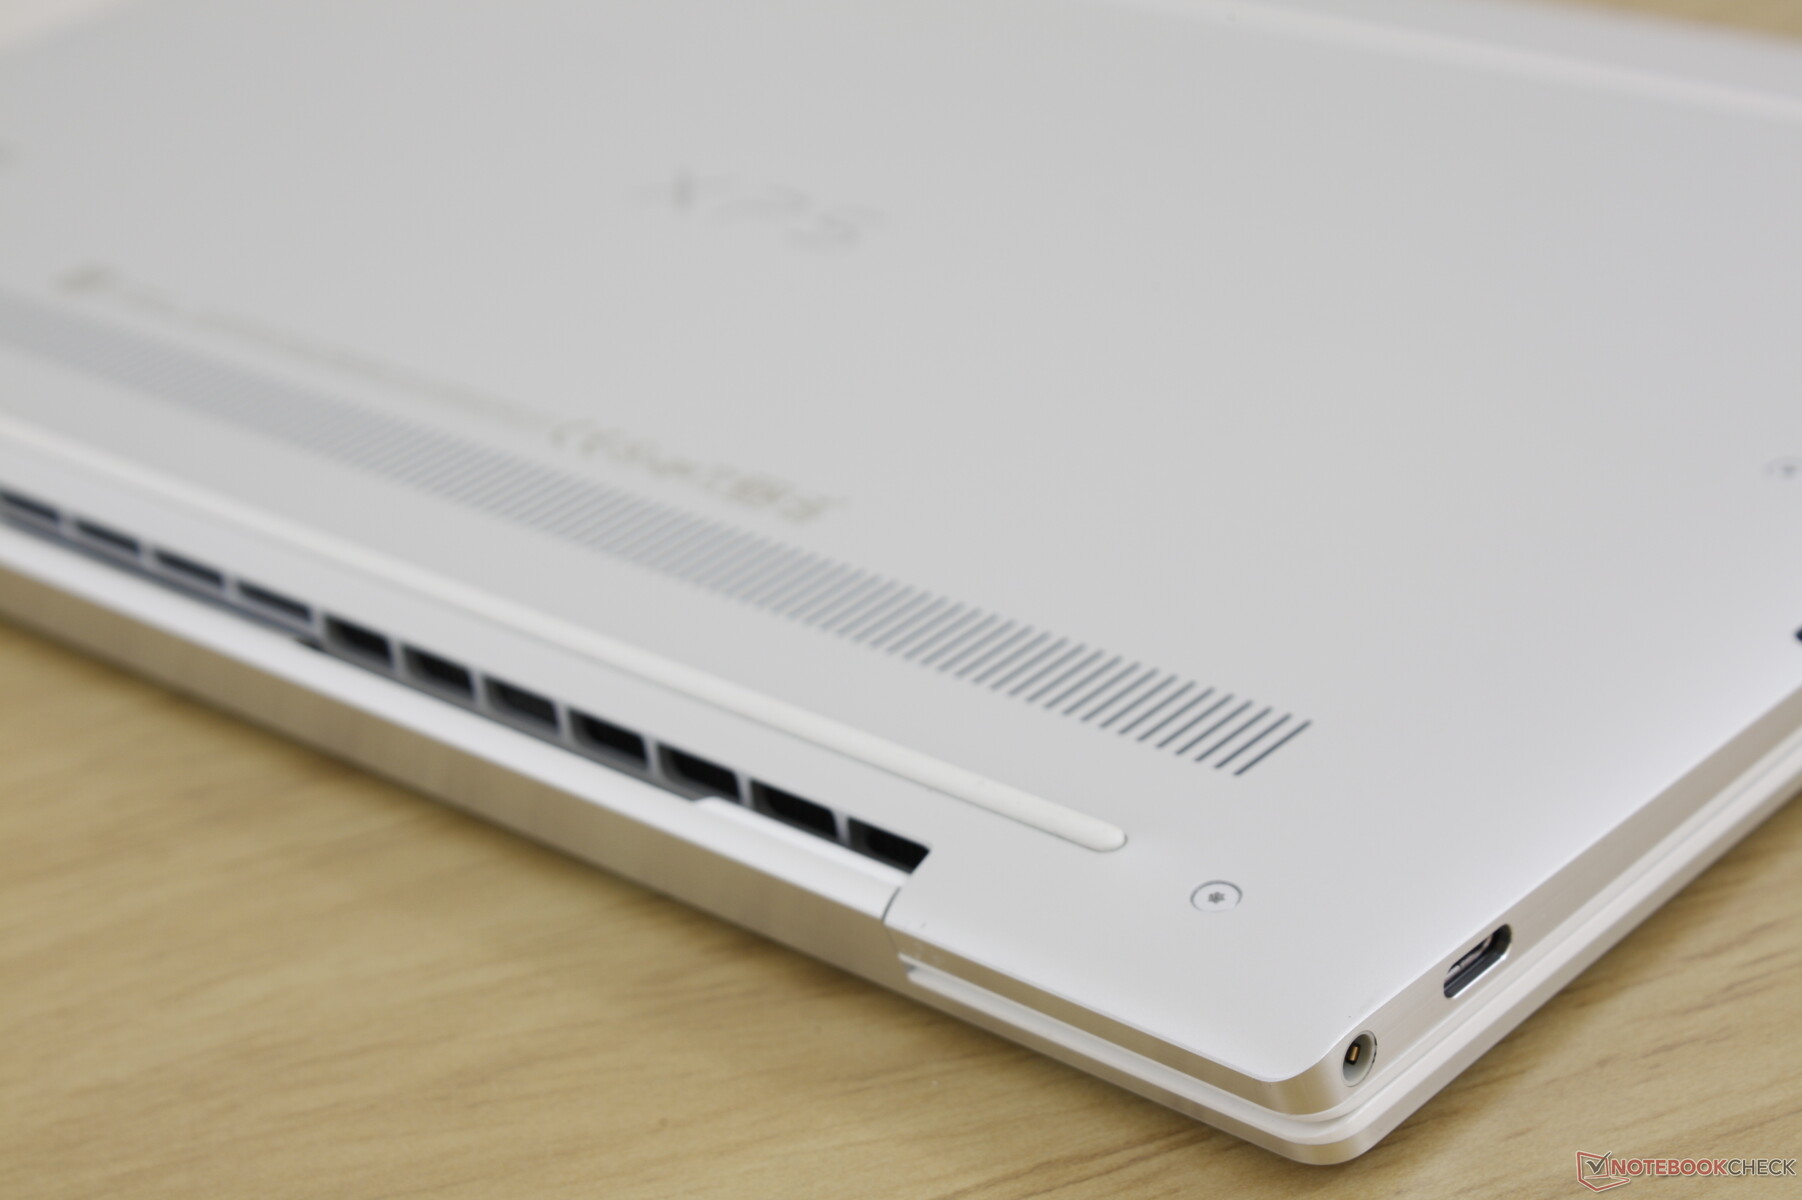
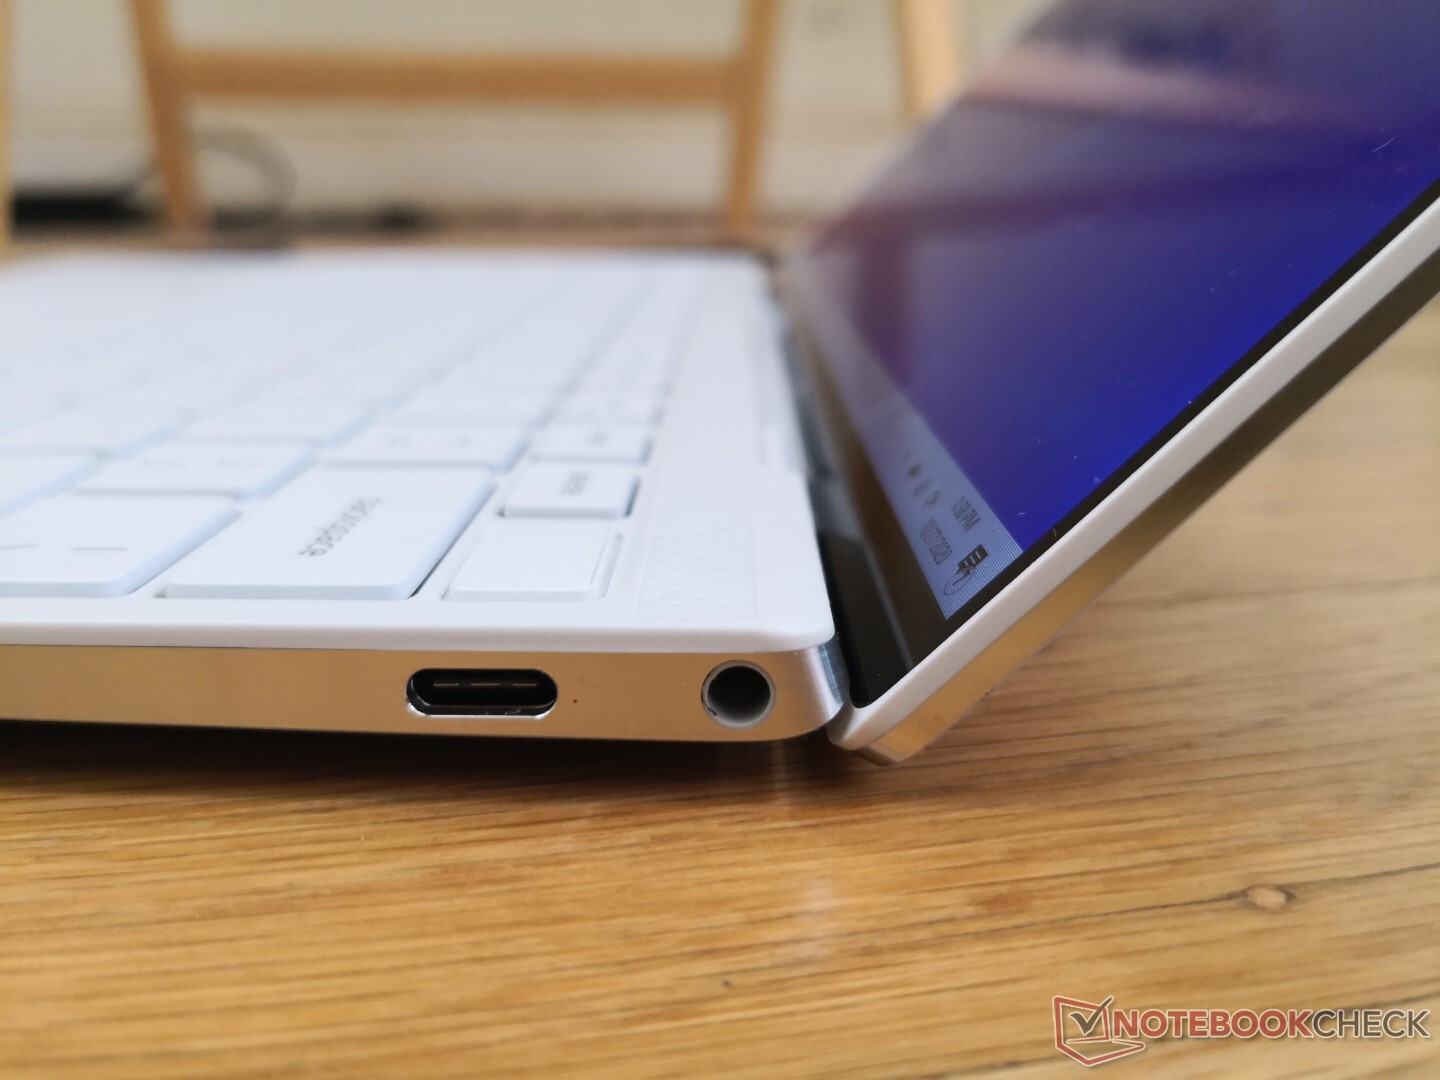
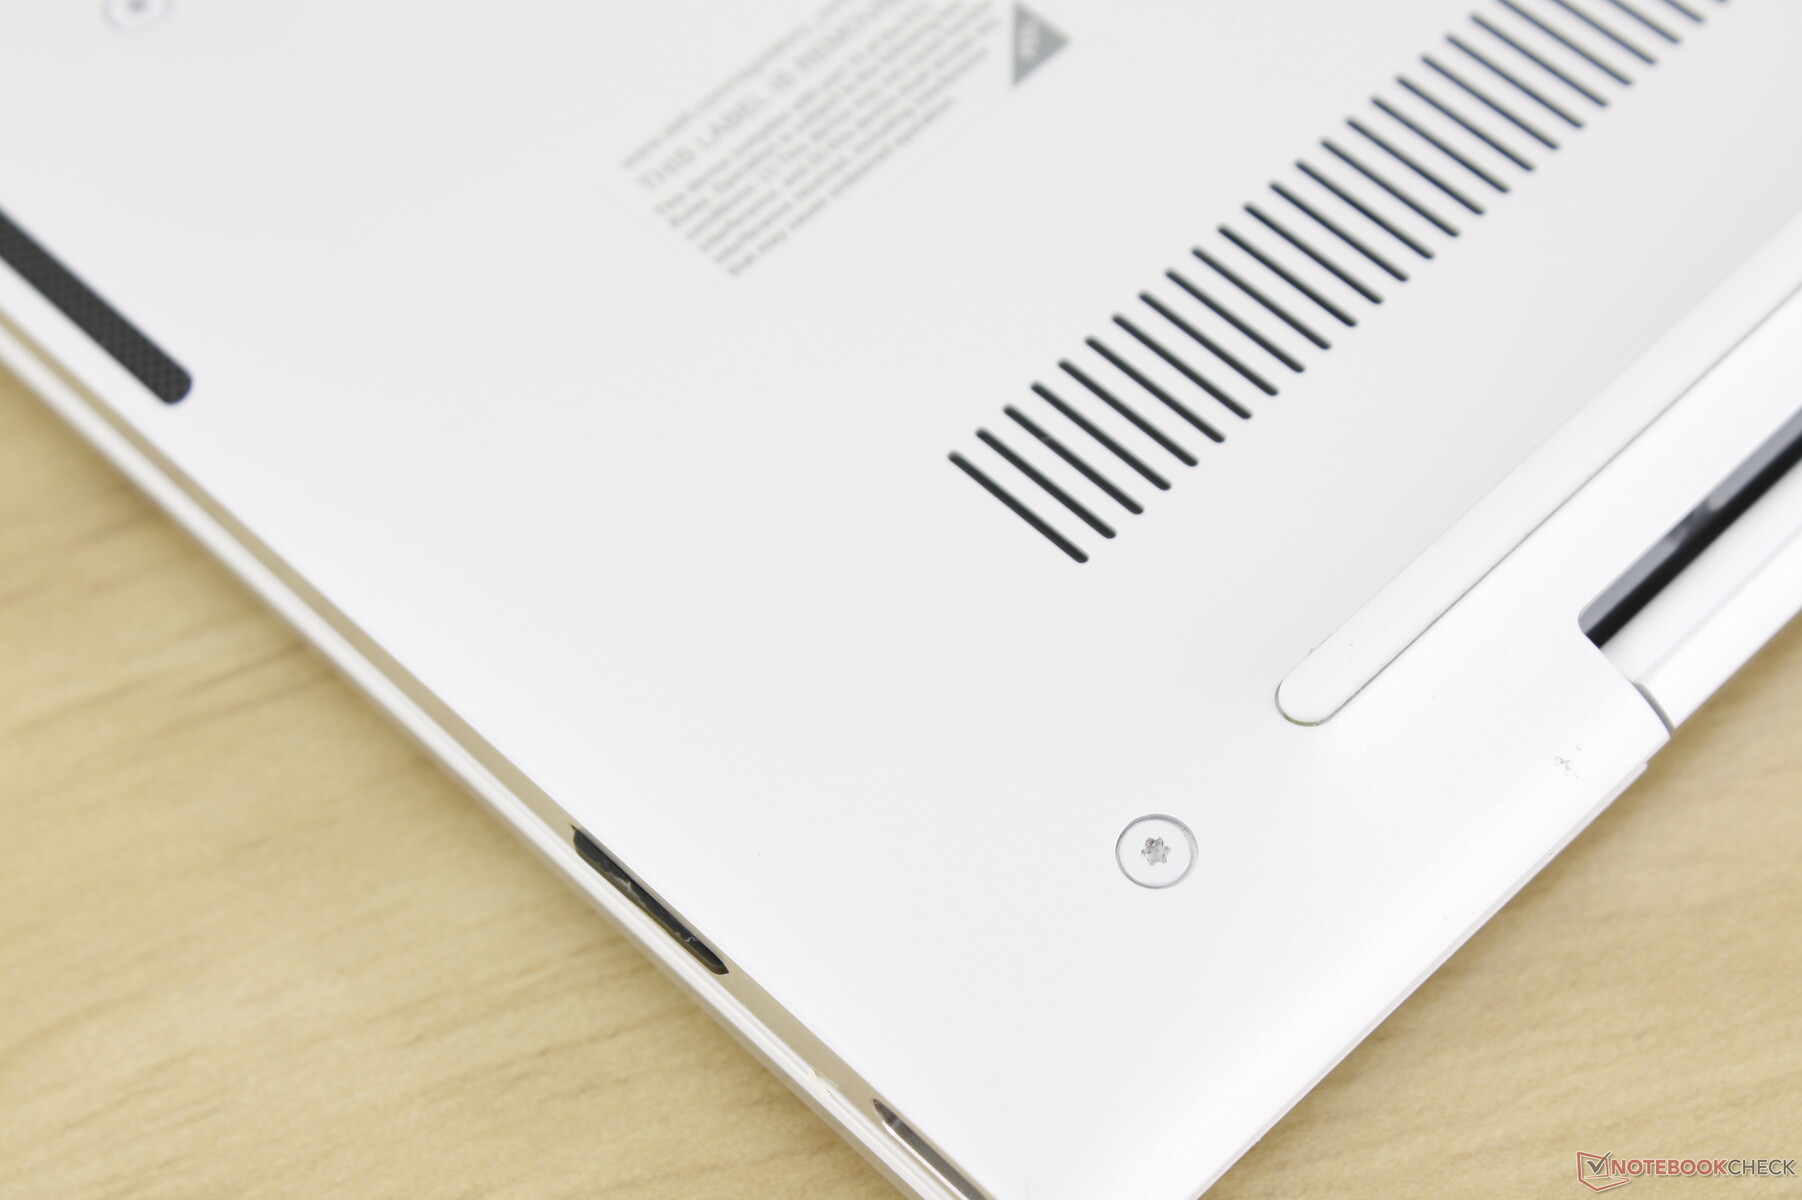
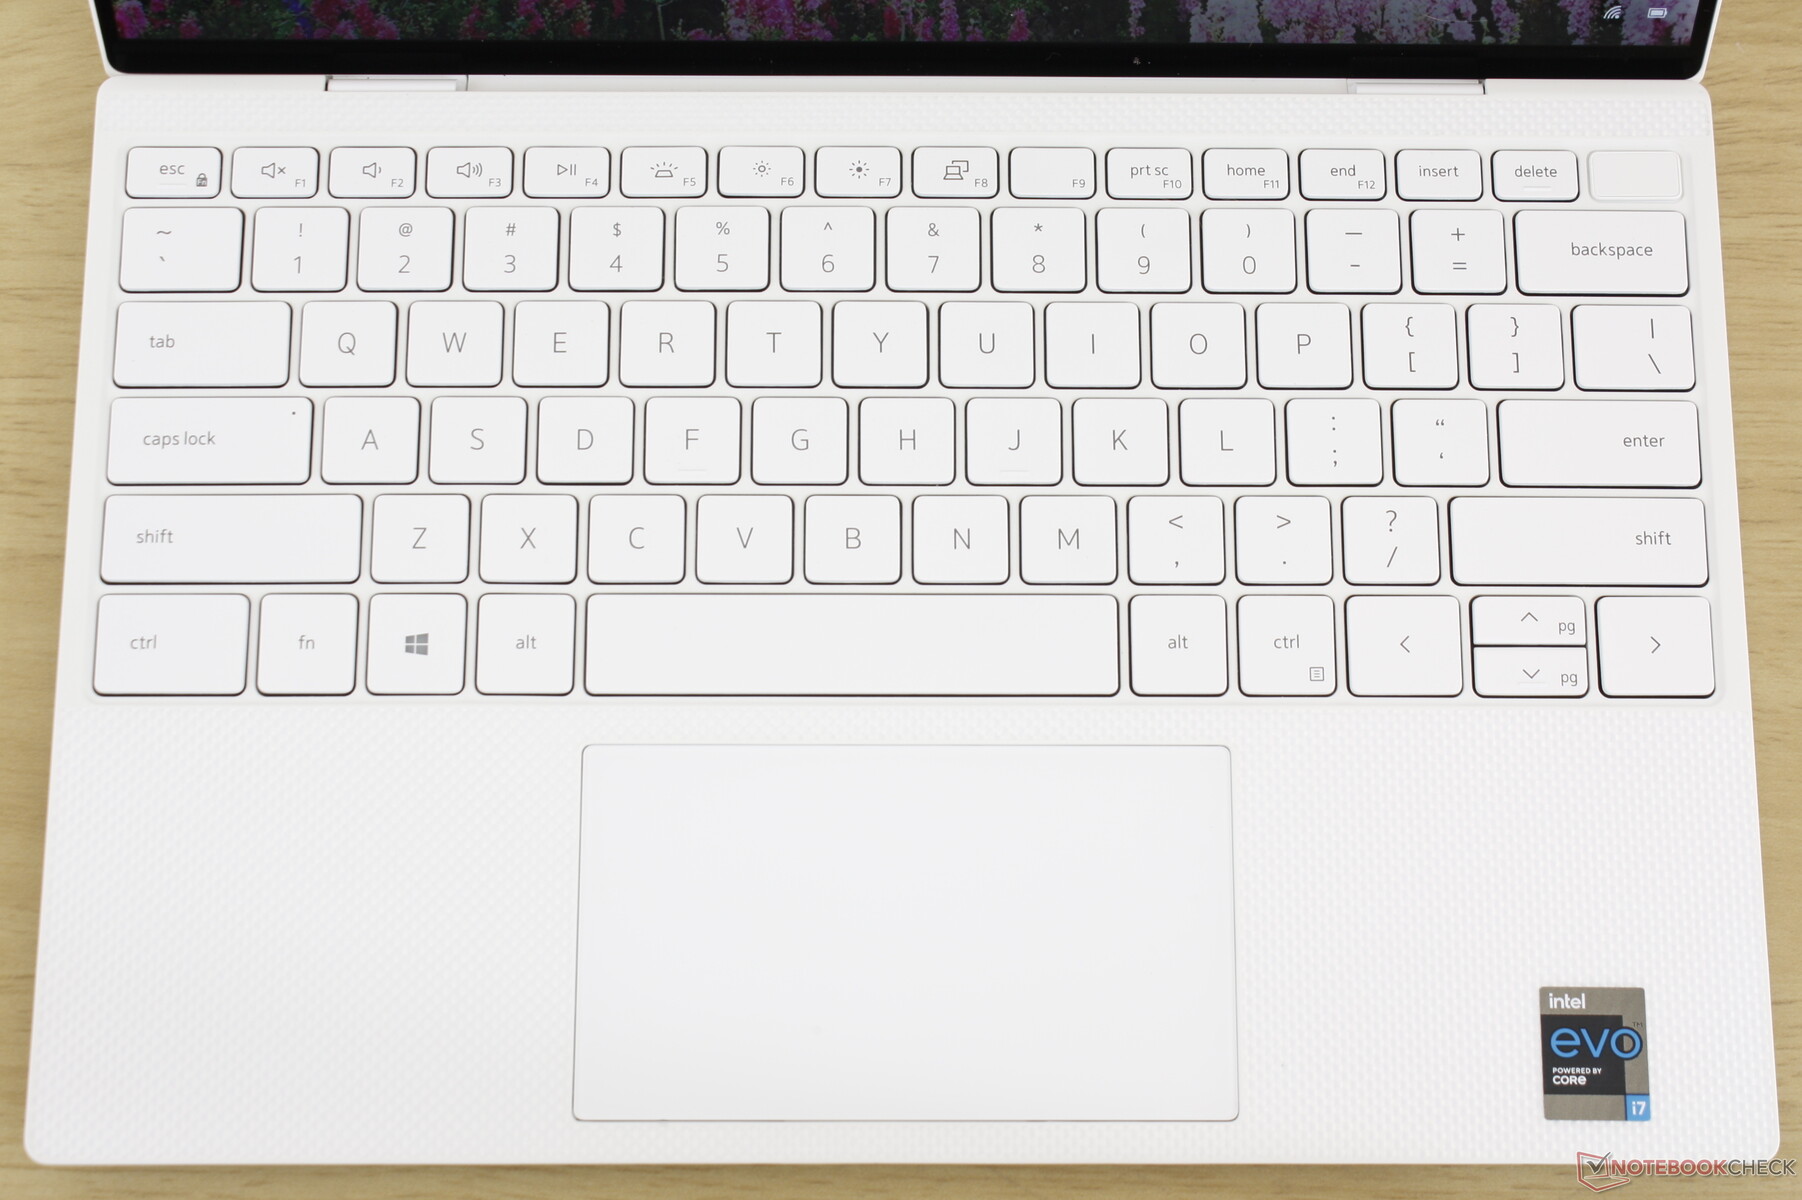
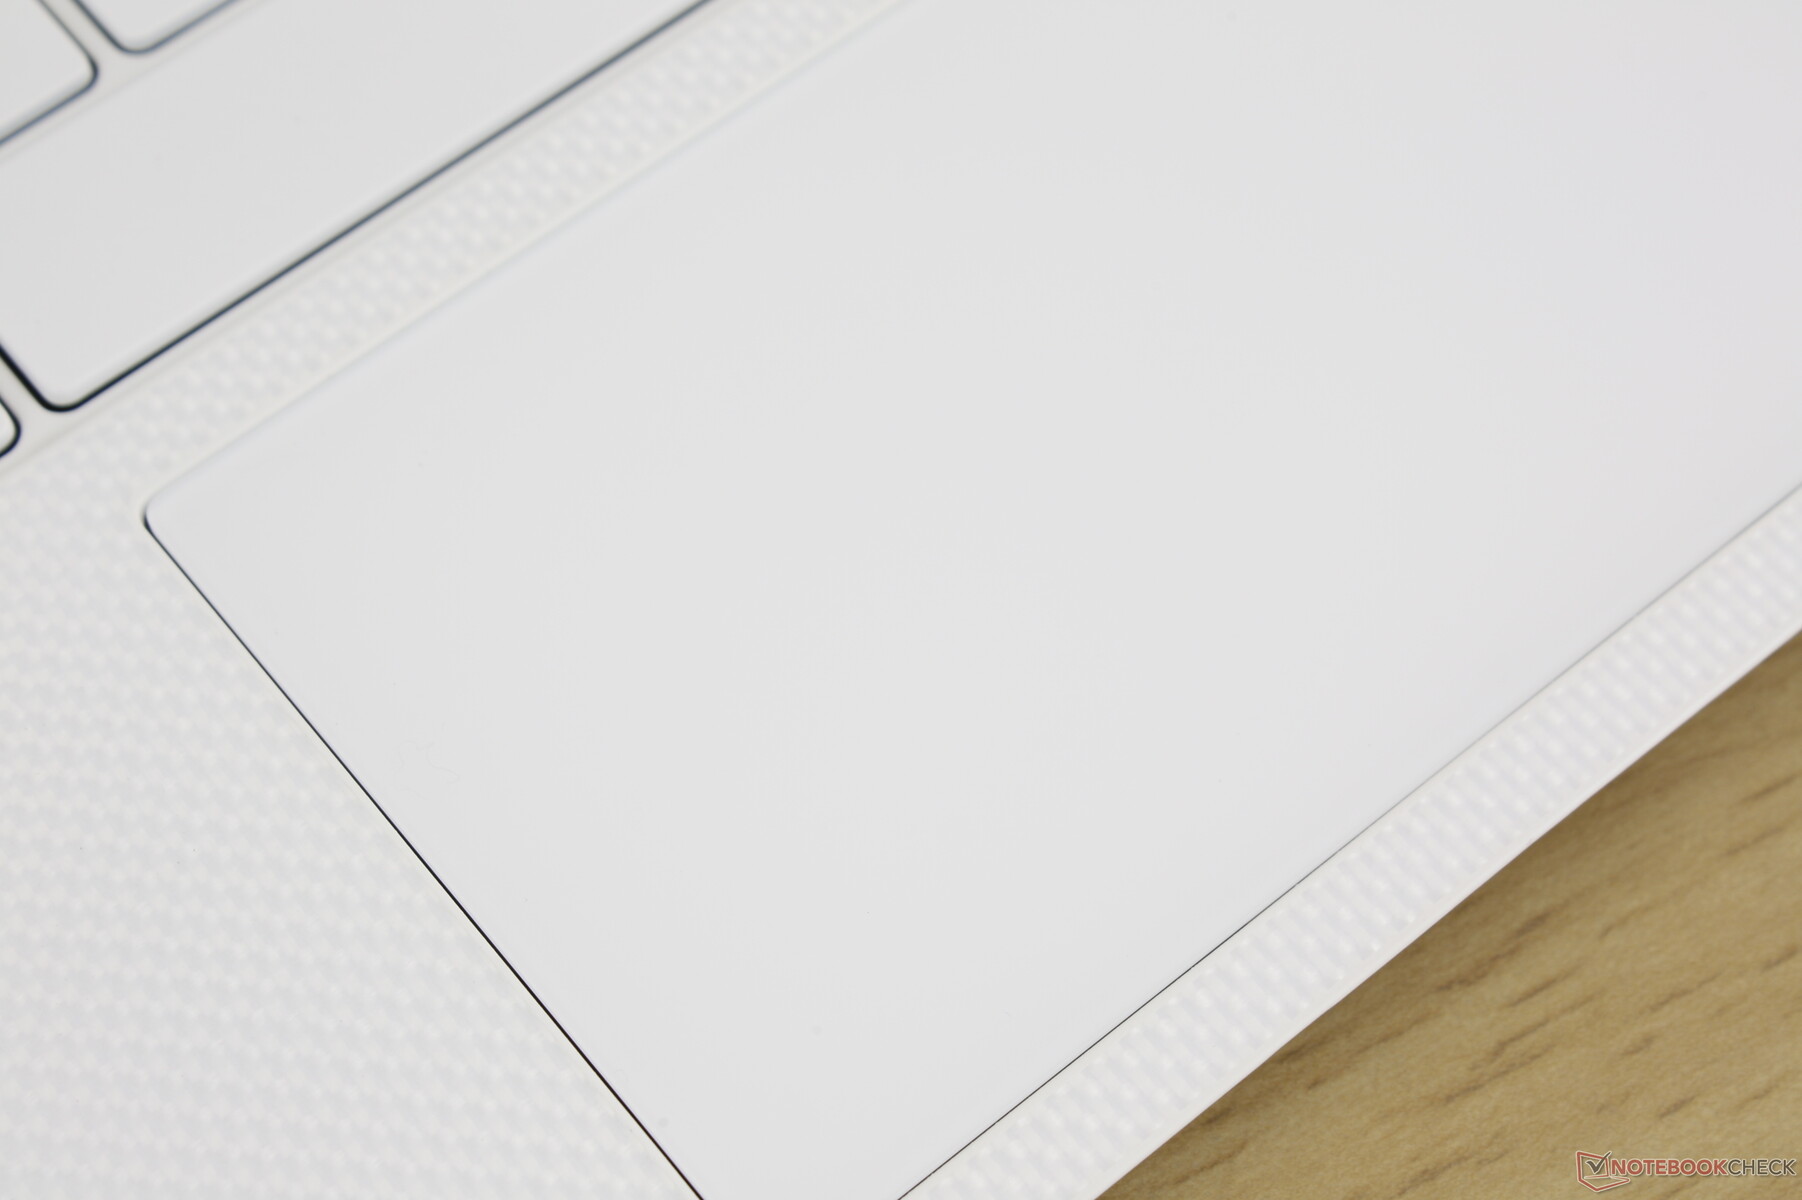
Dell introduced the current 16:10 XPS 13 design earlier this year with the XPS 13 9300 and so the XPS 13 9310 is still relatively new even though there are no major visual updates. Perhaps most notably, the white glass-woven color option of the older 16:9 XPS 13 series has returned whereas the XPS 9300 was available only in black. The main appeal of the white option is mostly aesthetic as unsightly fingerprint buildup won't be as obvious.
Connectivity

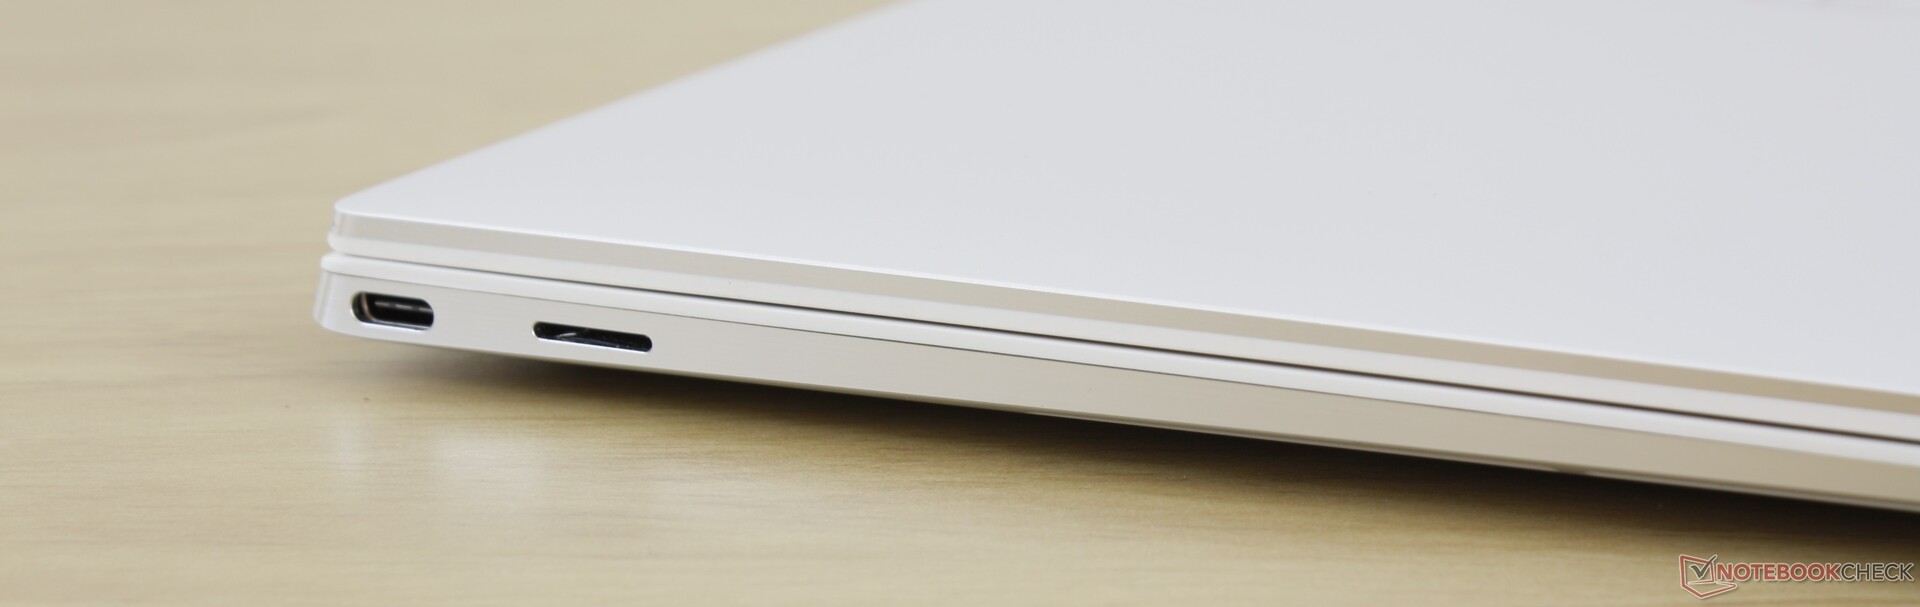
SD Card Reader
| SD Card Reader | |
| average JPG Copy Test (av. of 3 runs) | |
| Dell XPS 13 9310 Core i7 FHD (Toshiba Exceria Pro M501 64 GB UHS-II) | |
| HP Spectre x360 13-aw0013dx (Toshiba Exceria Pro M501 microSDXC 64GB) | |
| Dell XPS 13 9300 Core i7-1065G7 (Toshiba Exceria Pro M501 64 GB UHS-II) | |
| Lenovo Yoga Slim 7-14ARE (Toshiba Exceria Pro M501 64 GB UHS-II) | |
| maximum AS SSD Seq Read Test (1GB) | |
| Dell XPS 13 9310 Core i7 FHD (Toshiba Exceria Pro M501 64 GB UHS-II) | |
| Dell XPS 13 9300 Core i7-1065G7 (Toshiba Exceria Pro M501 64 GB UHS-II) | |
| HP Spectre x360 13-aw0013dx (Toshiba Exceria Pro M501 microSDXC 64GB) | |
| Lenovo Yoga Slim 7-14ARE (Toshiba Exceria Pro M501 64 GB UHS-II) | |
Communication
The Intel Killer AX1650s comes standard once again for Wi-Fi 6 and Bluetooth 5.1 connectivity. Though we didn't experience any connectivity issues when paired to our Netgear RAX200 router, transmit rates are not nearly as fast as receive rates for a second year in a row.
Webcam


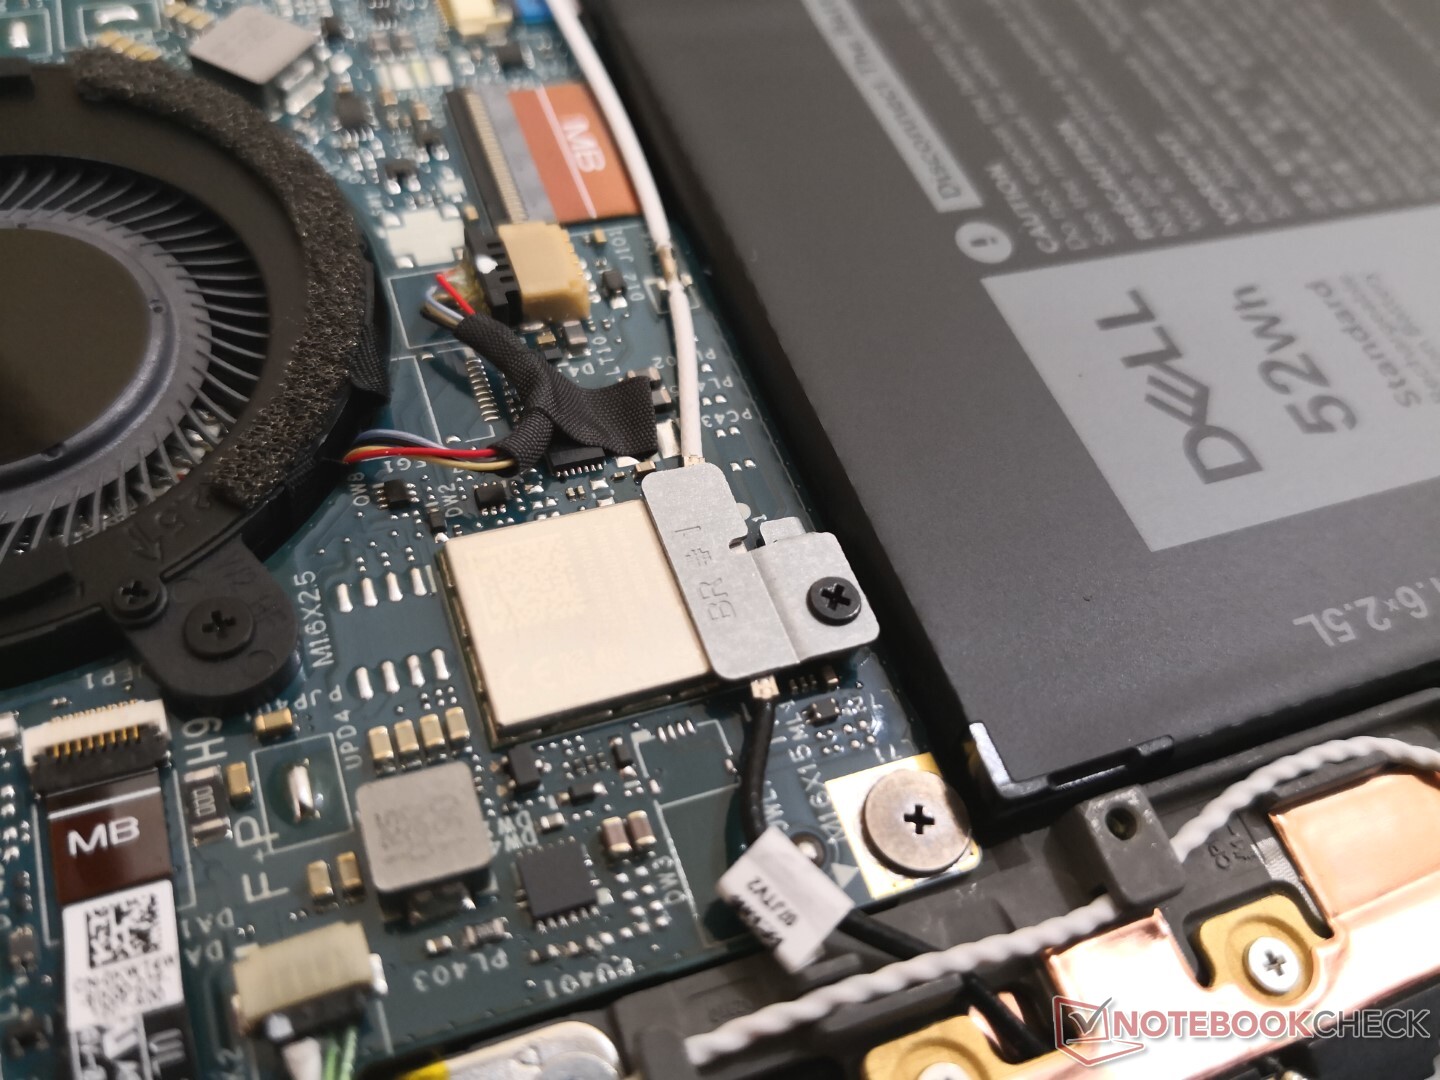
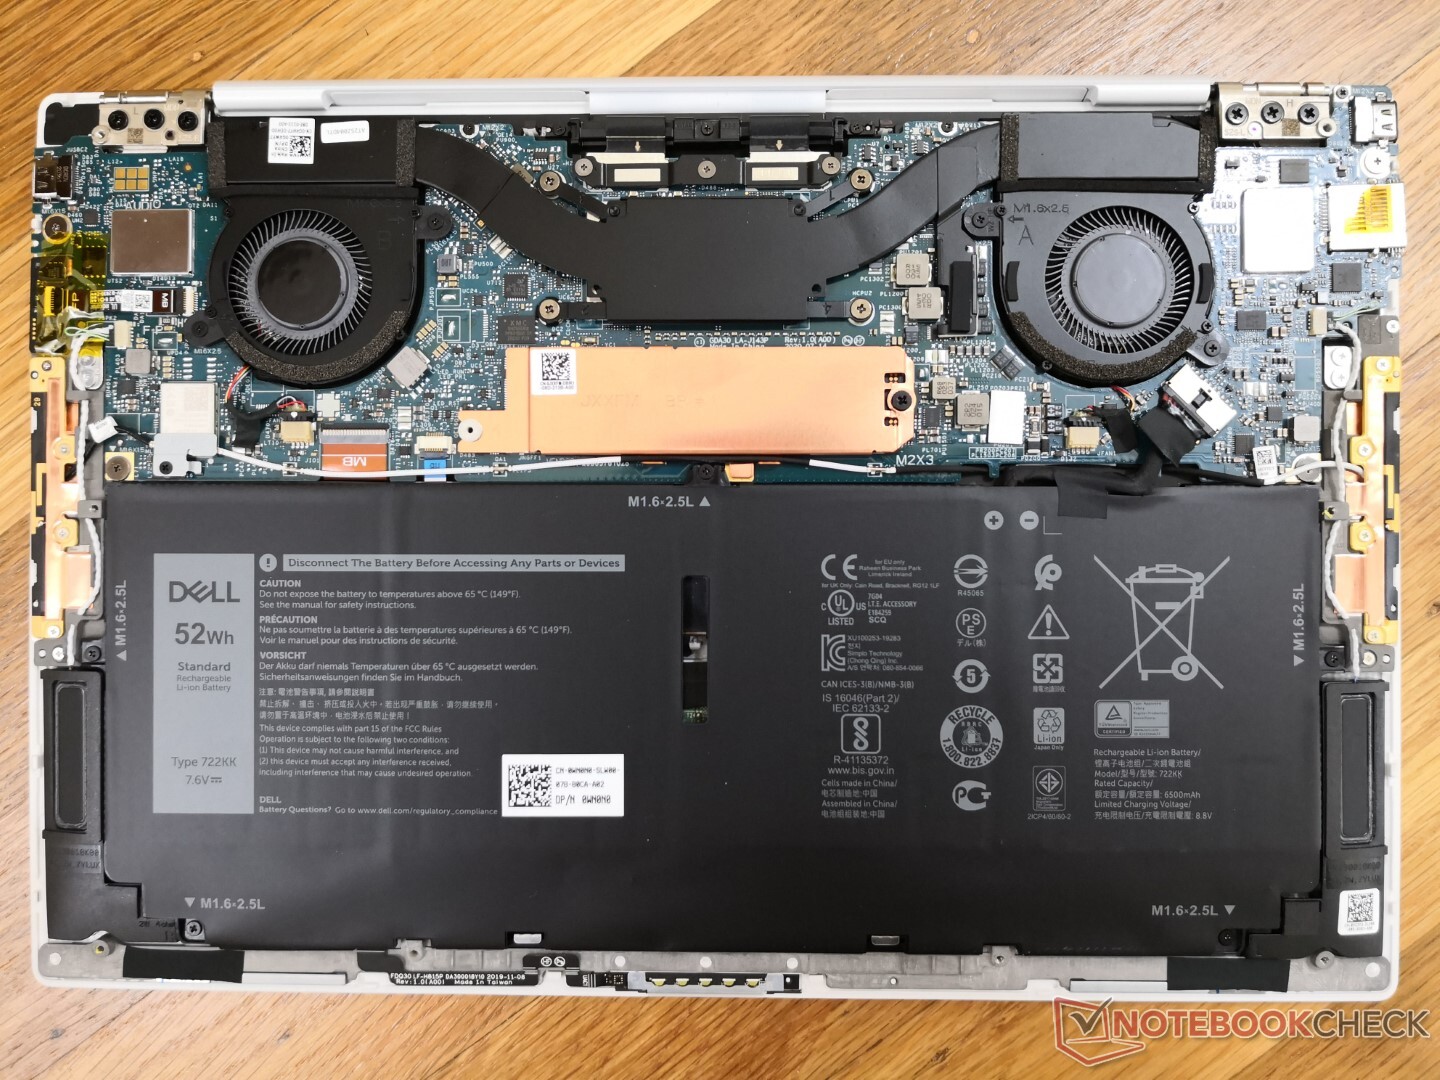
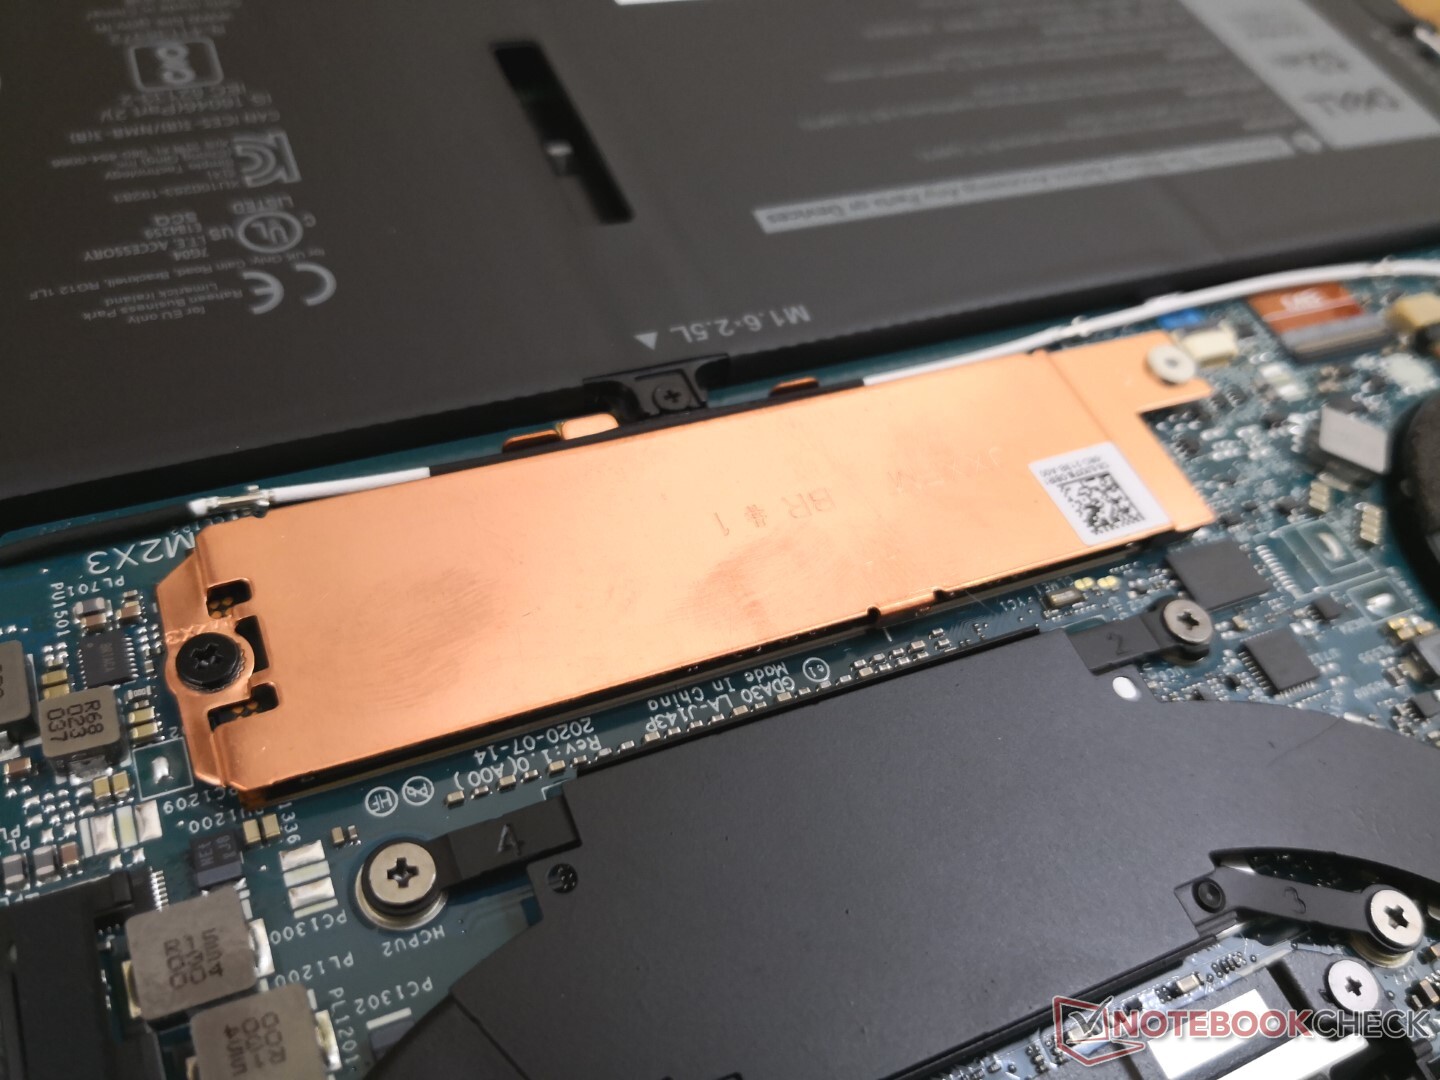
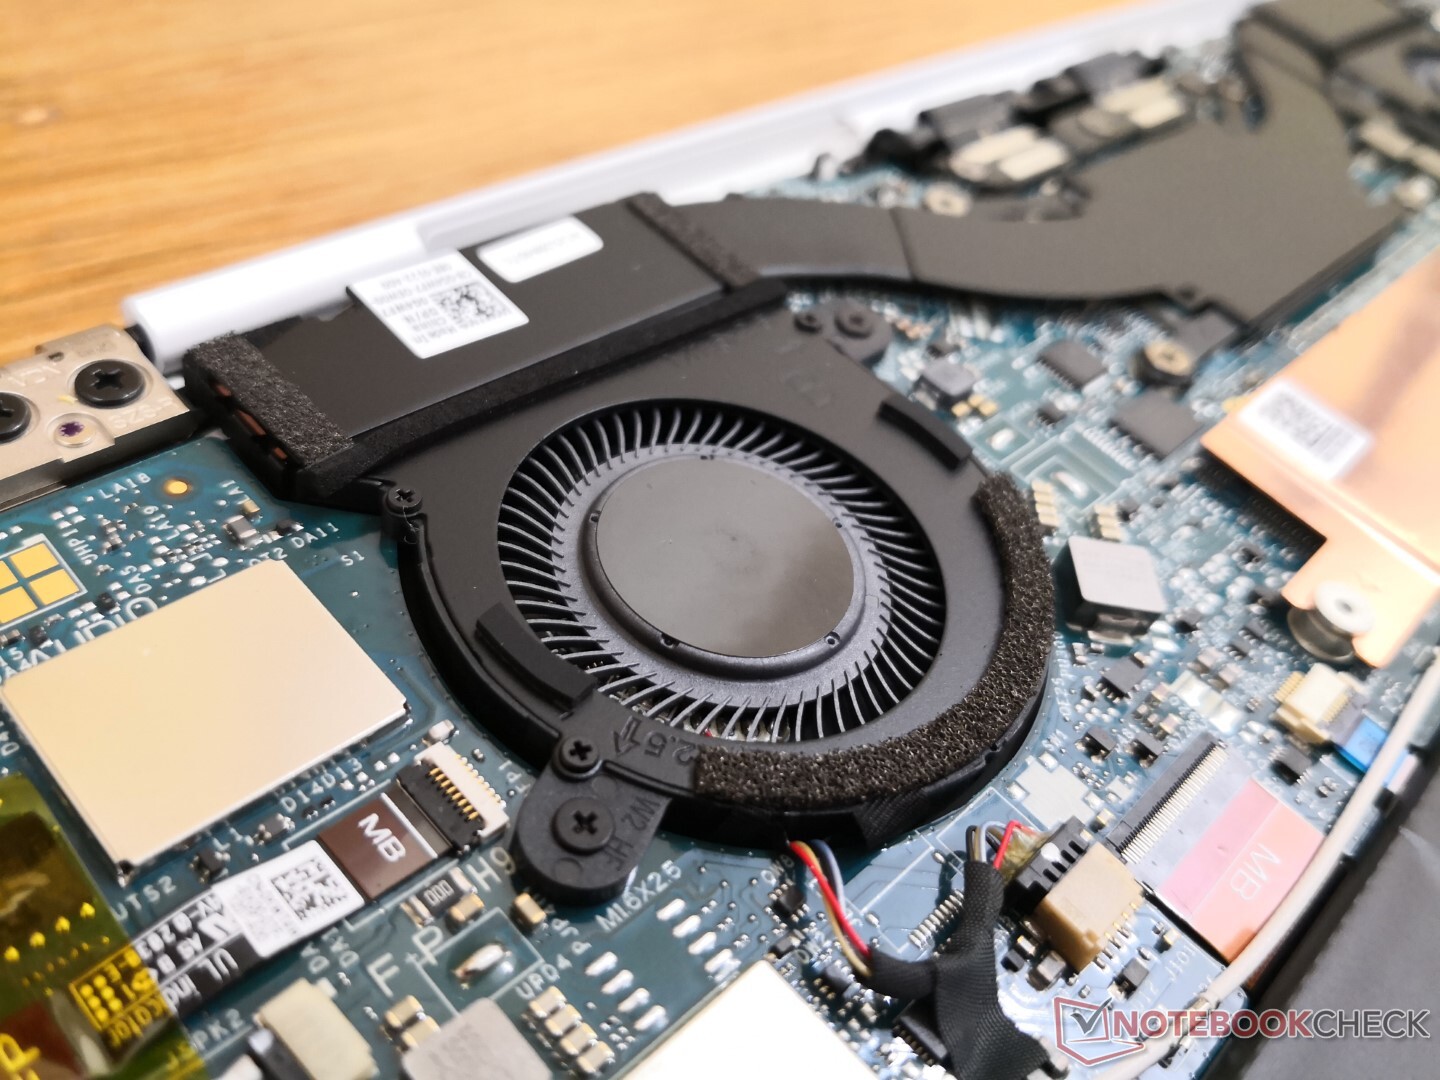
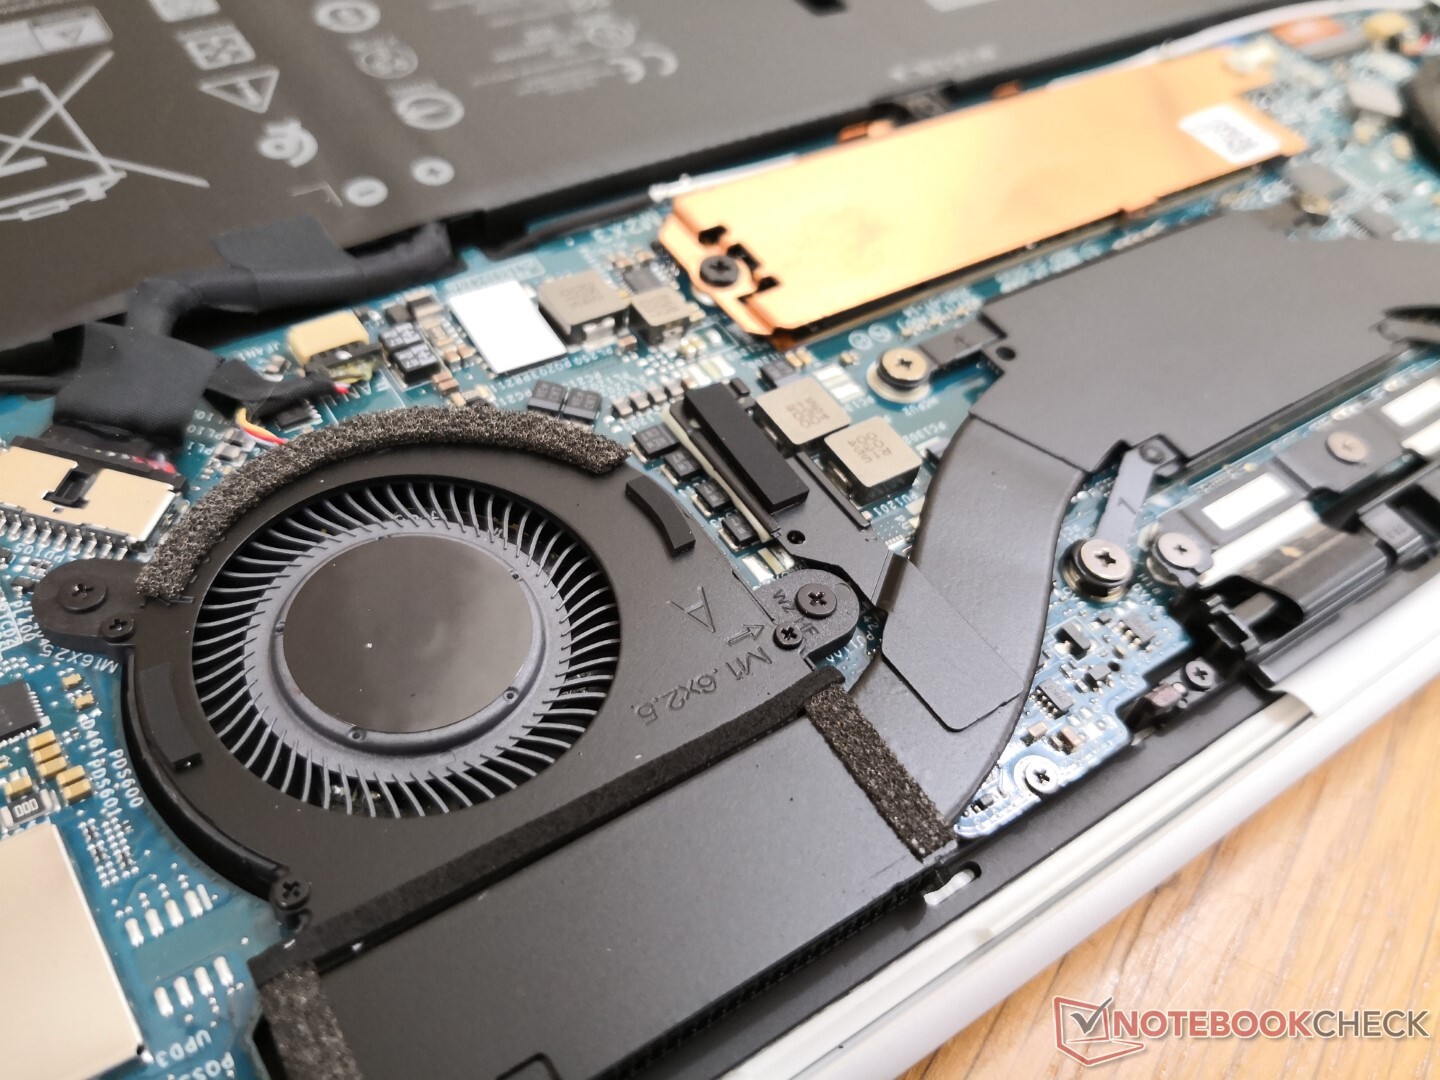
Maintenance
No major changes to the internals of the system
Accessories
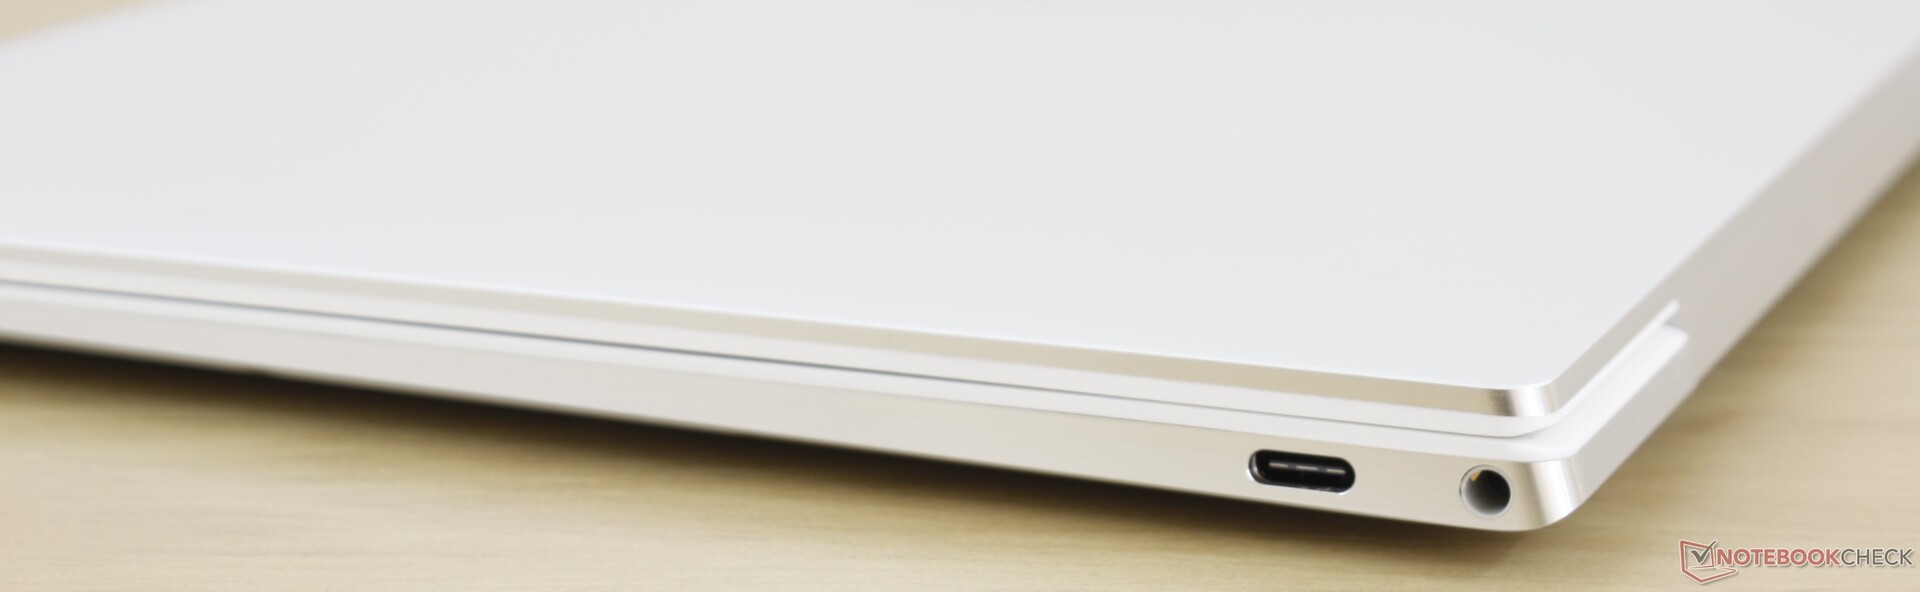
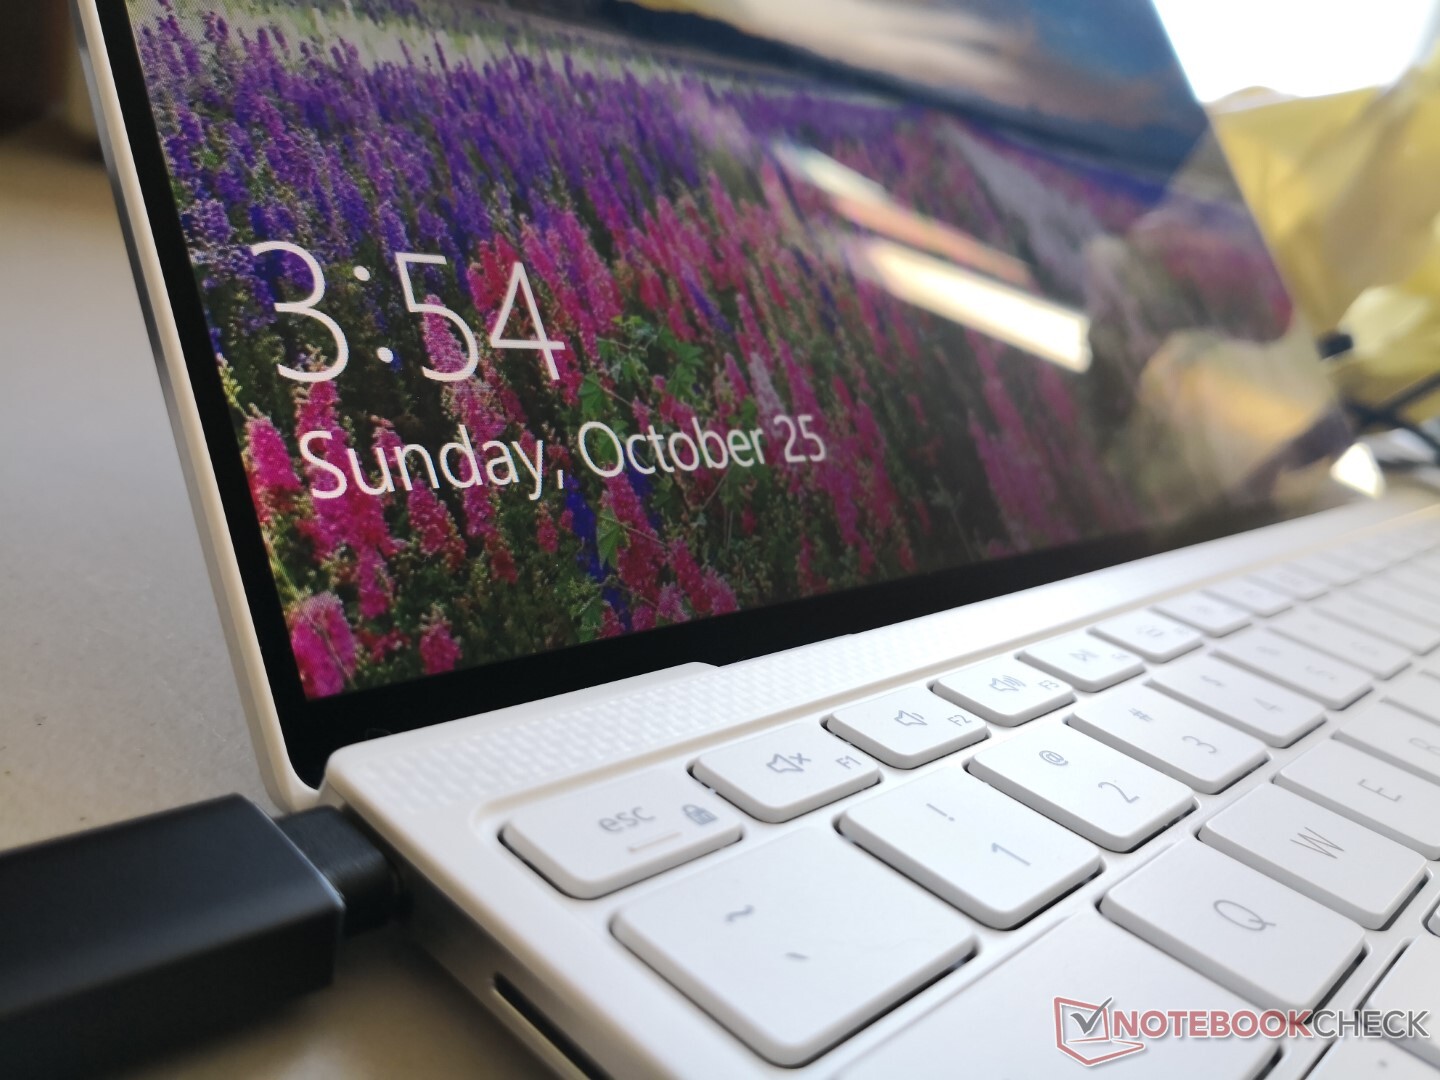
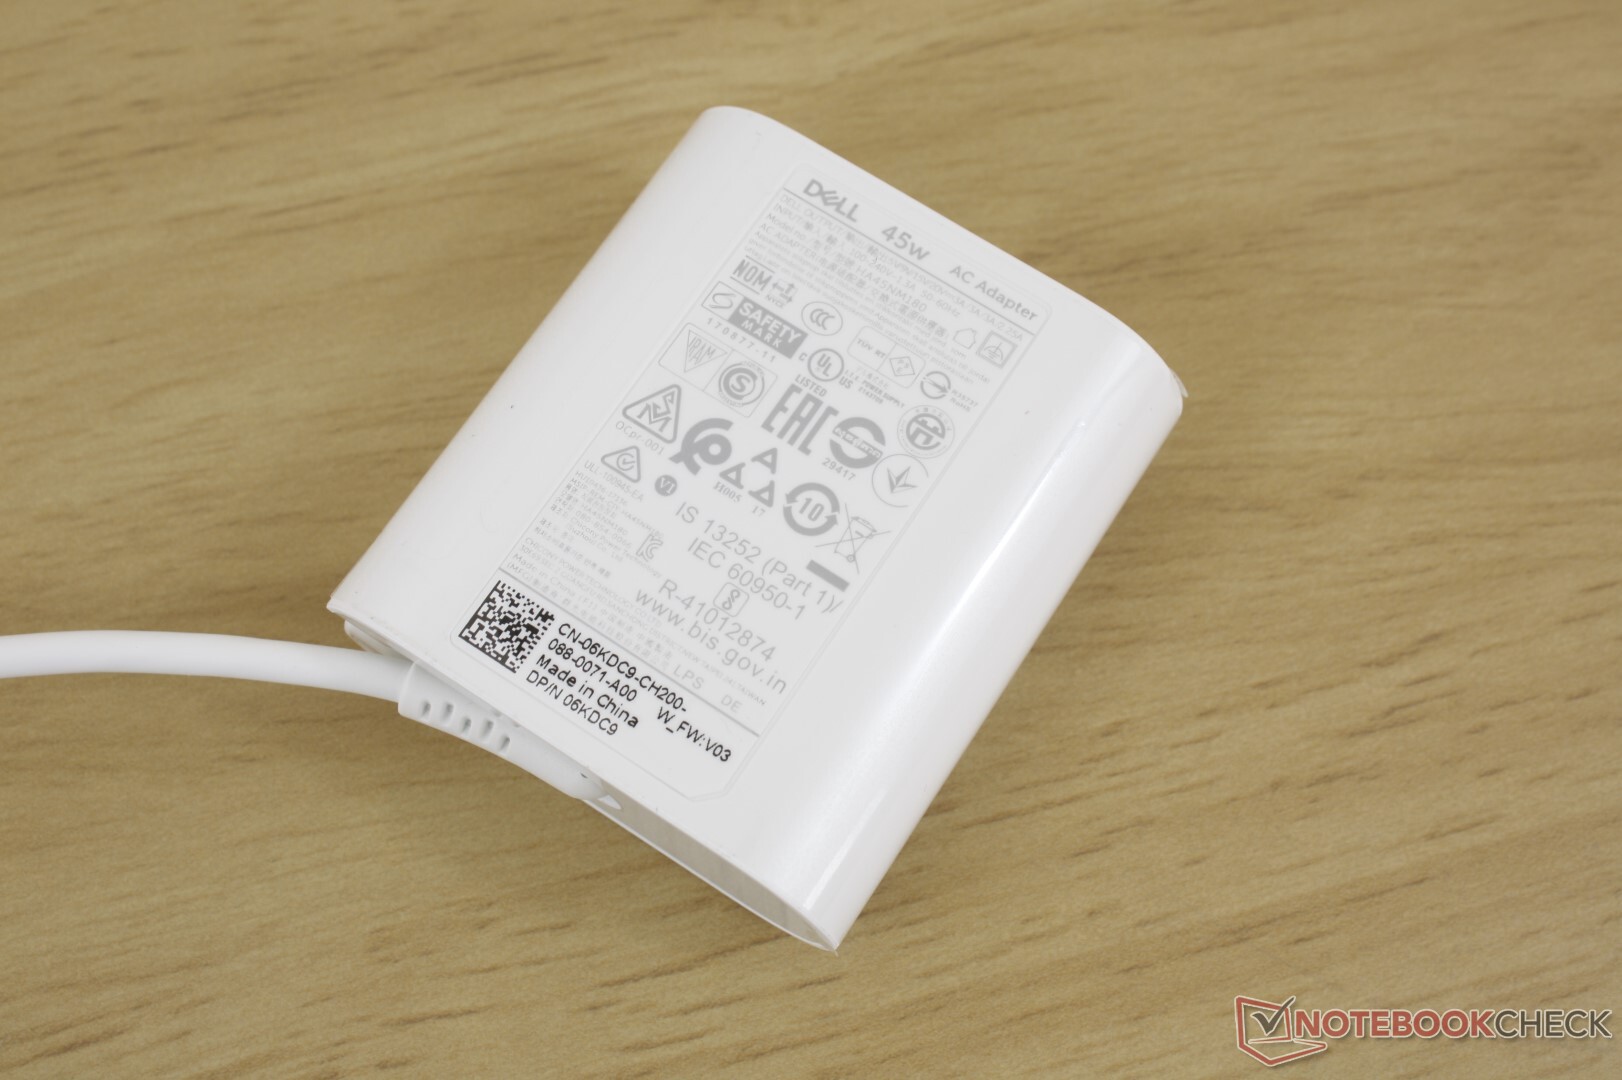
The box includes a USB-C to USB-A adapter and a handy power cable adapter so you won't need to carry a two-prong or three-prong power cable with you everywhere you go.
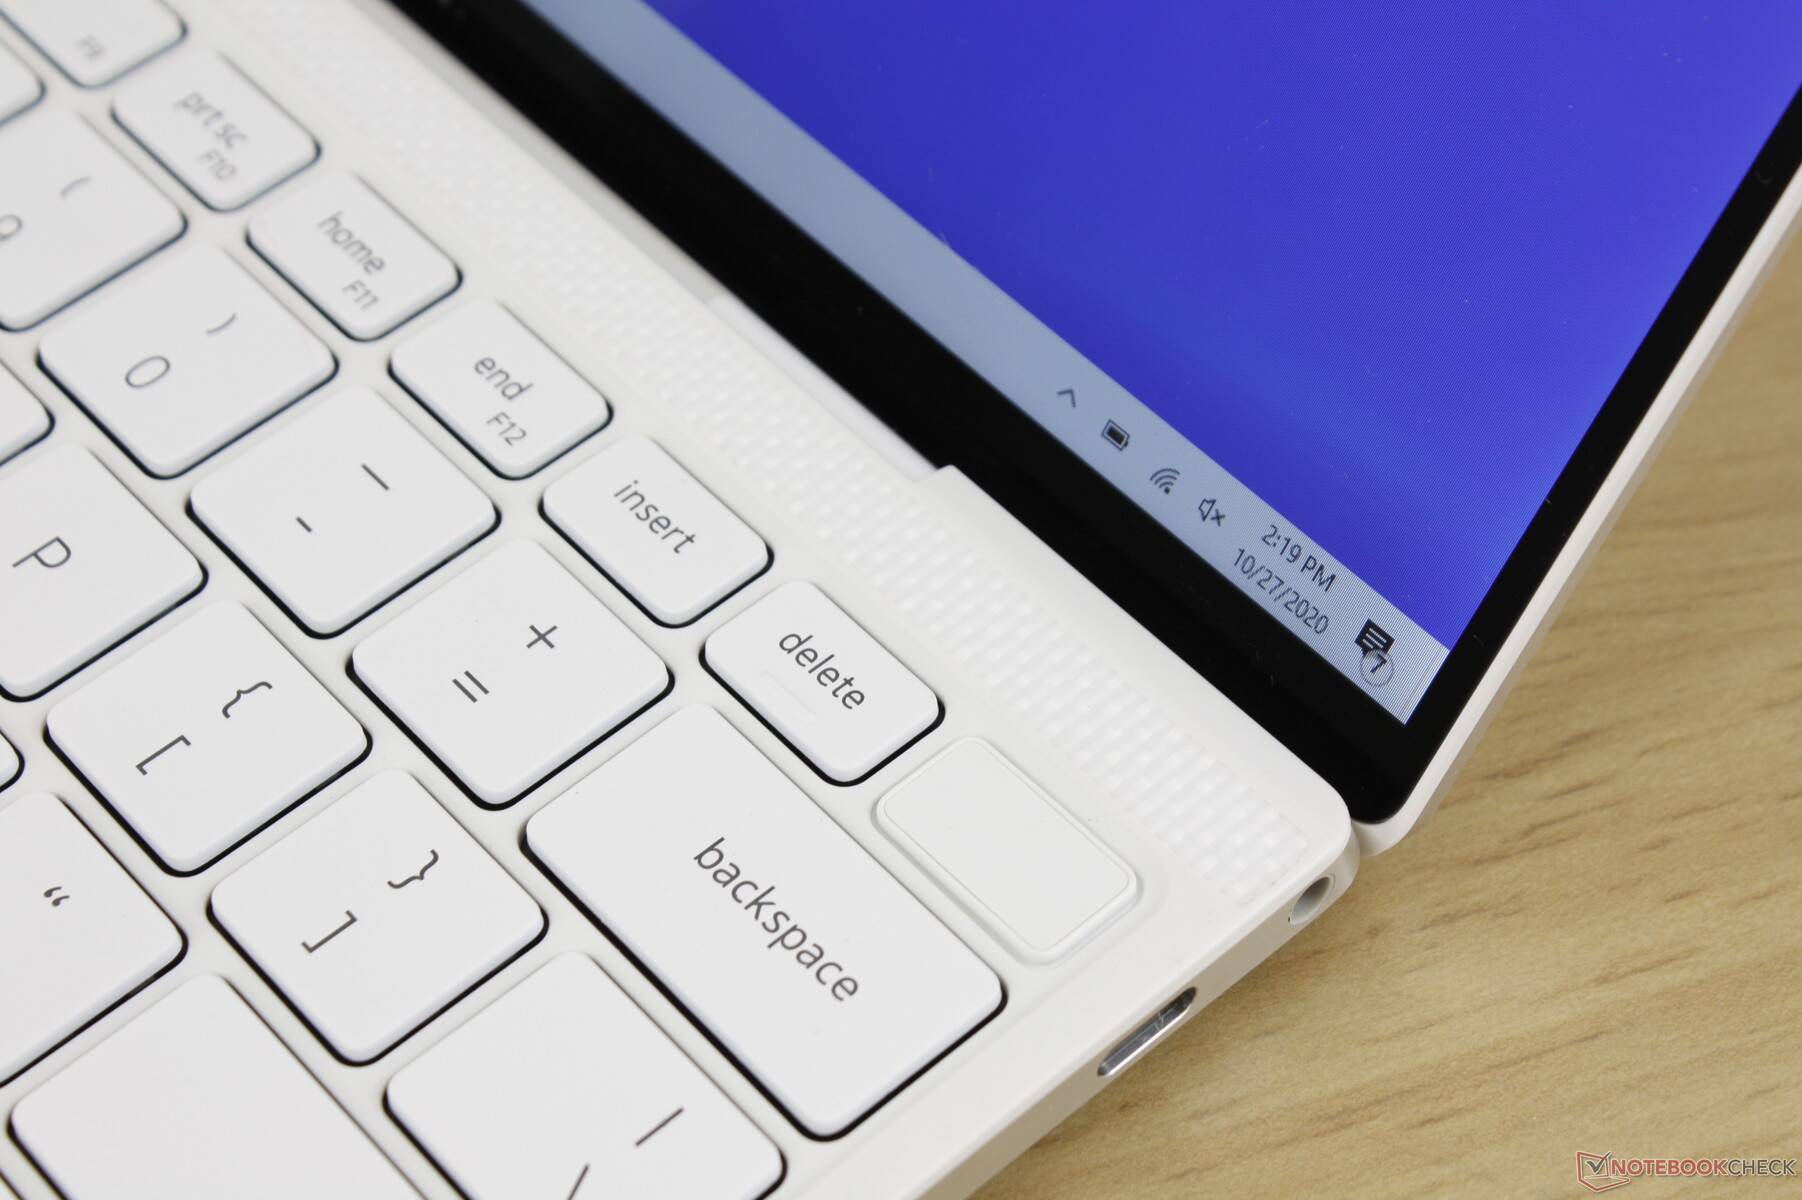
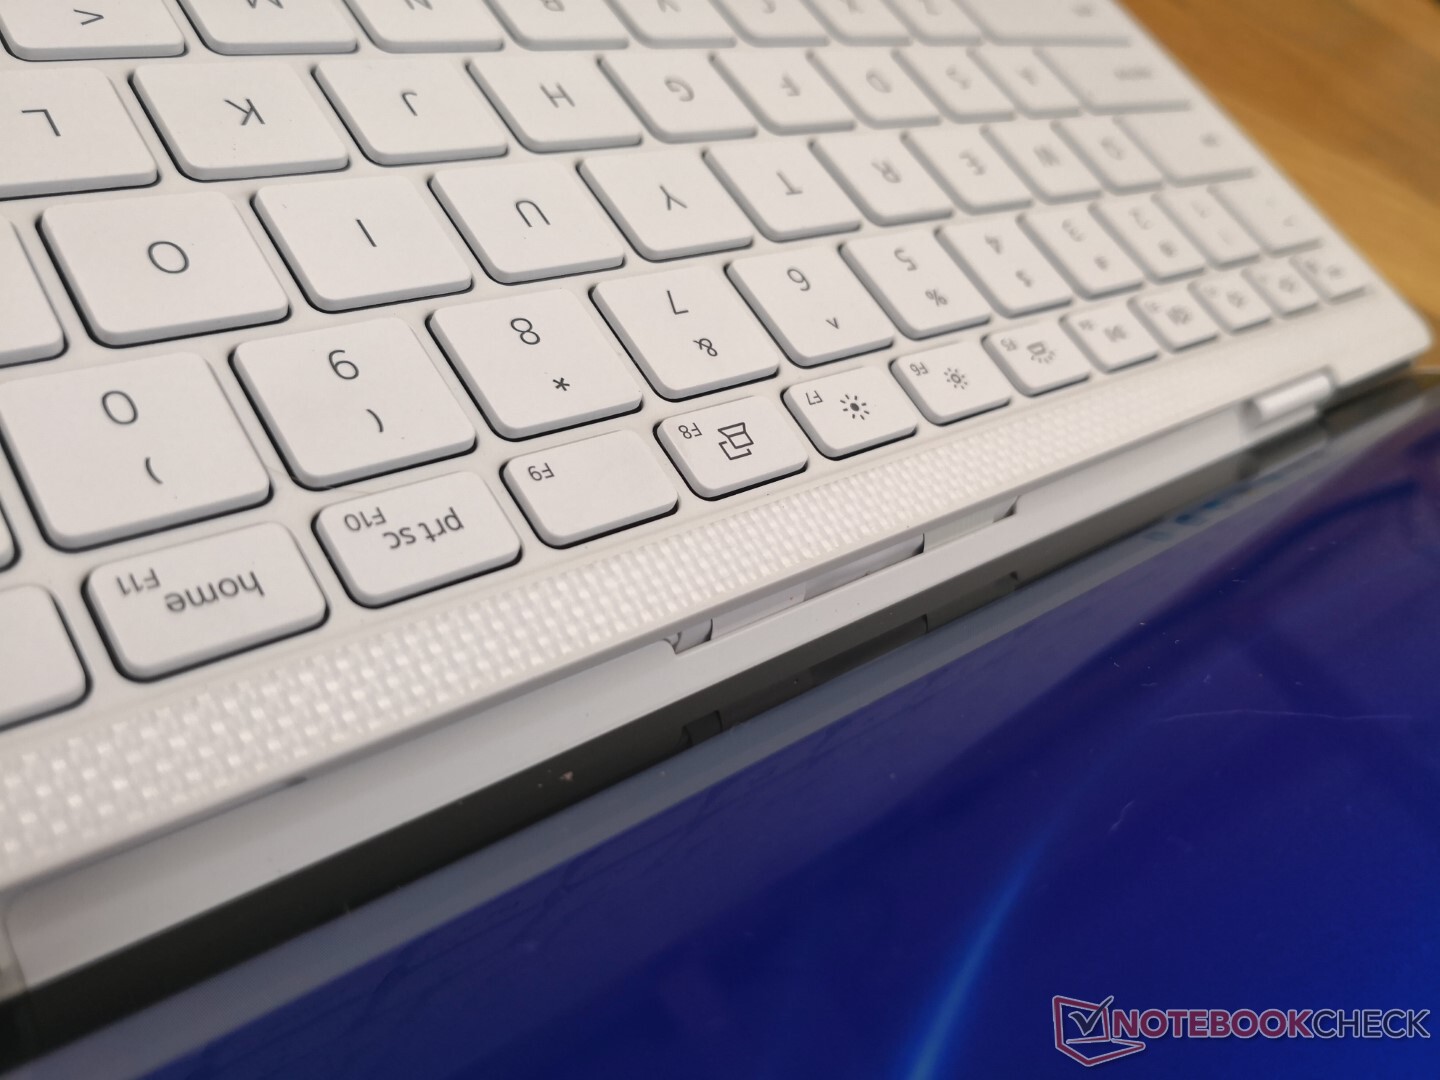
Input Devices


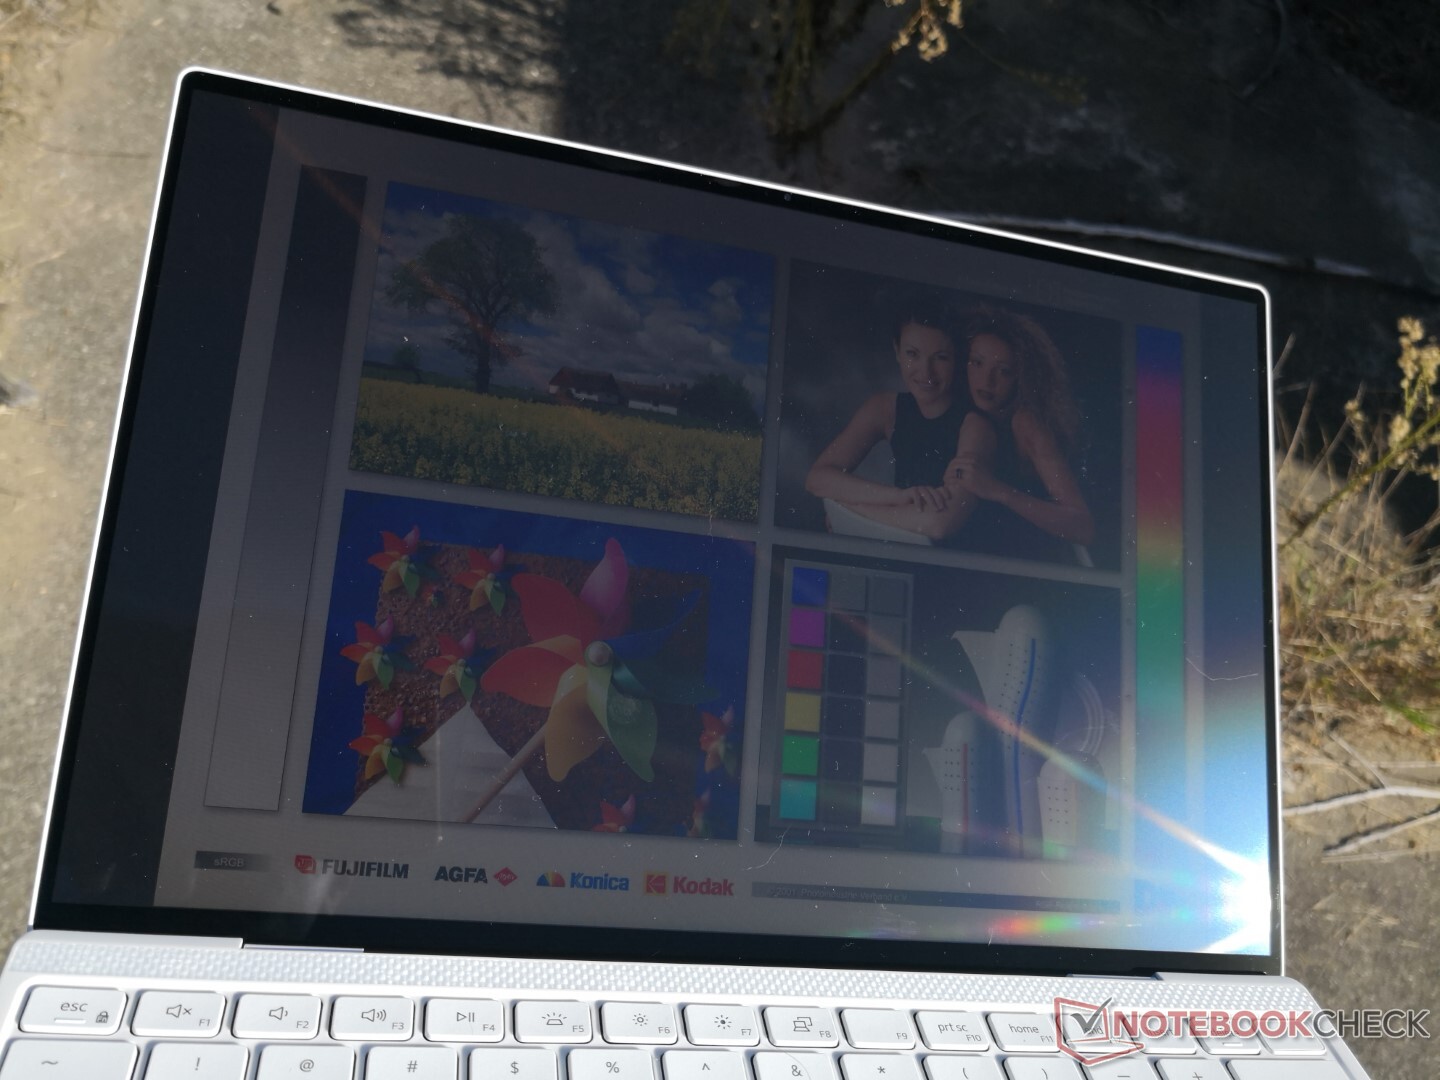
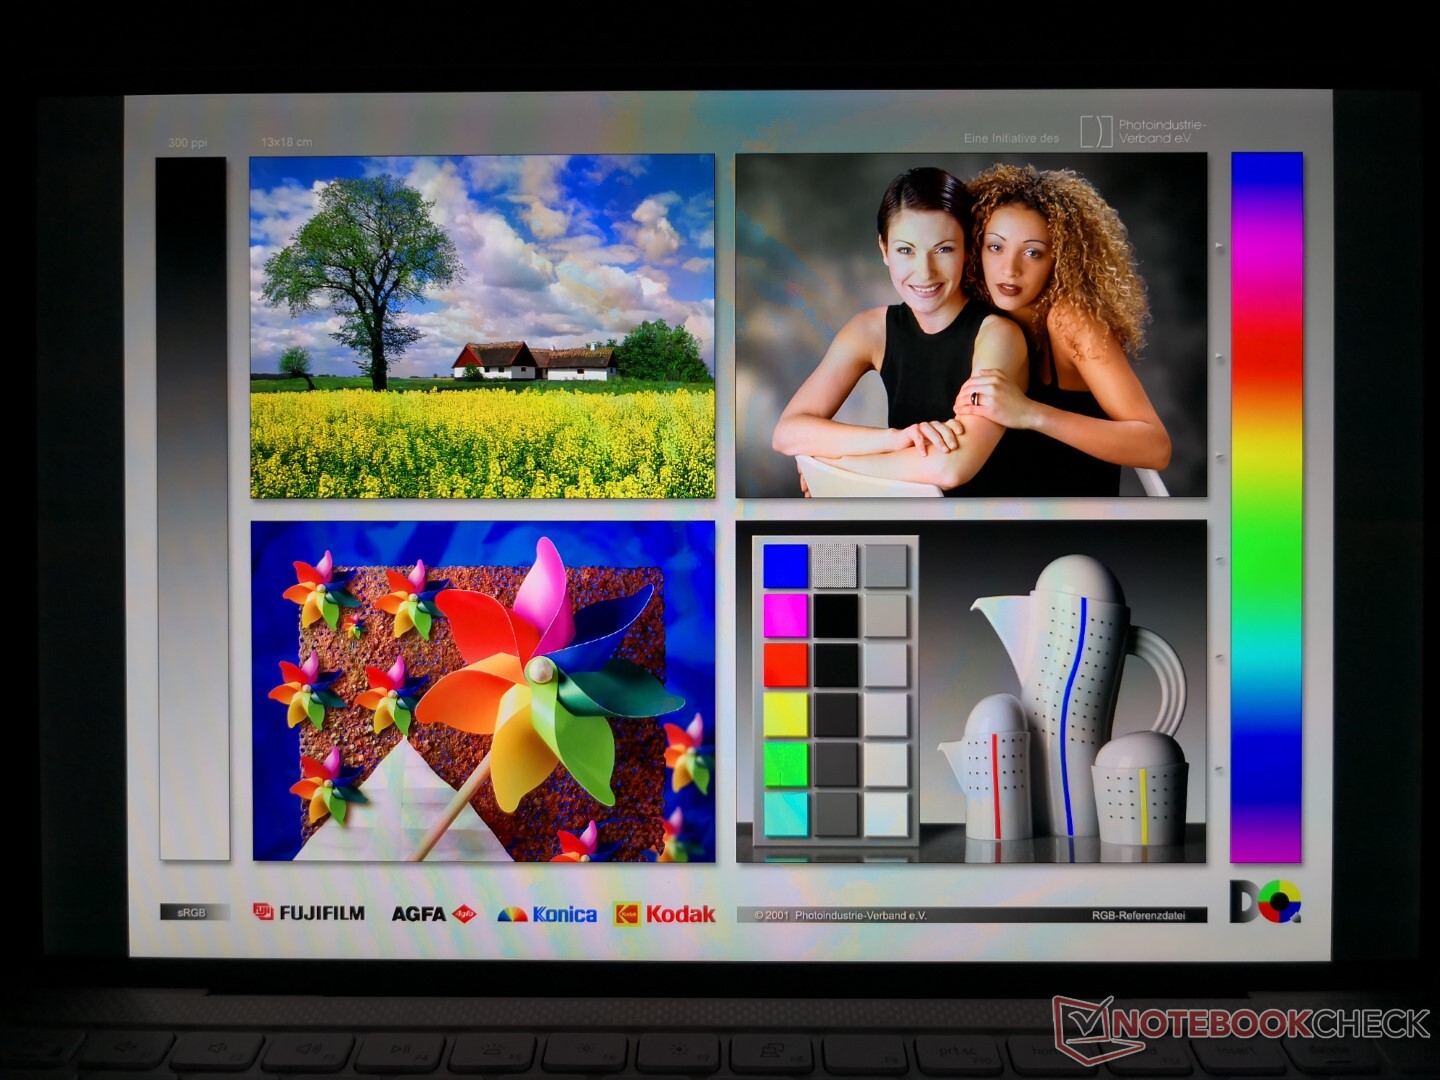
Display
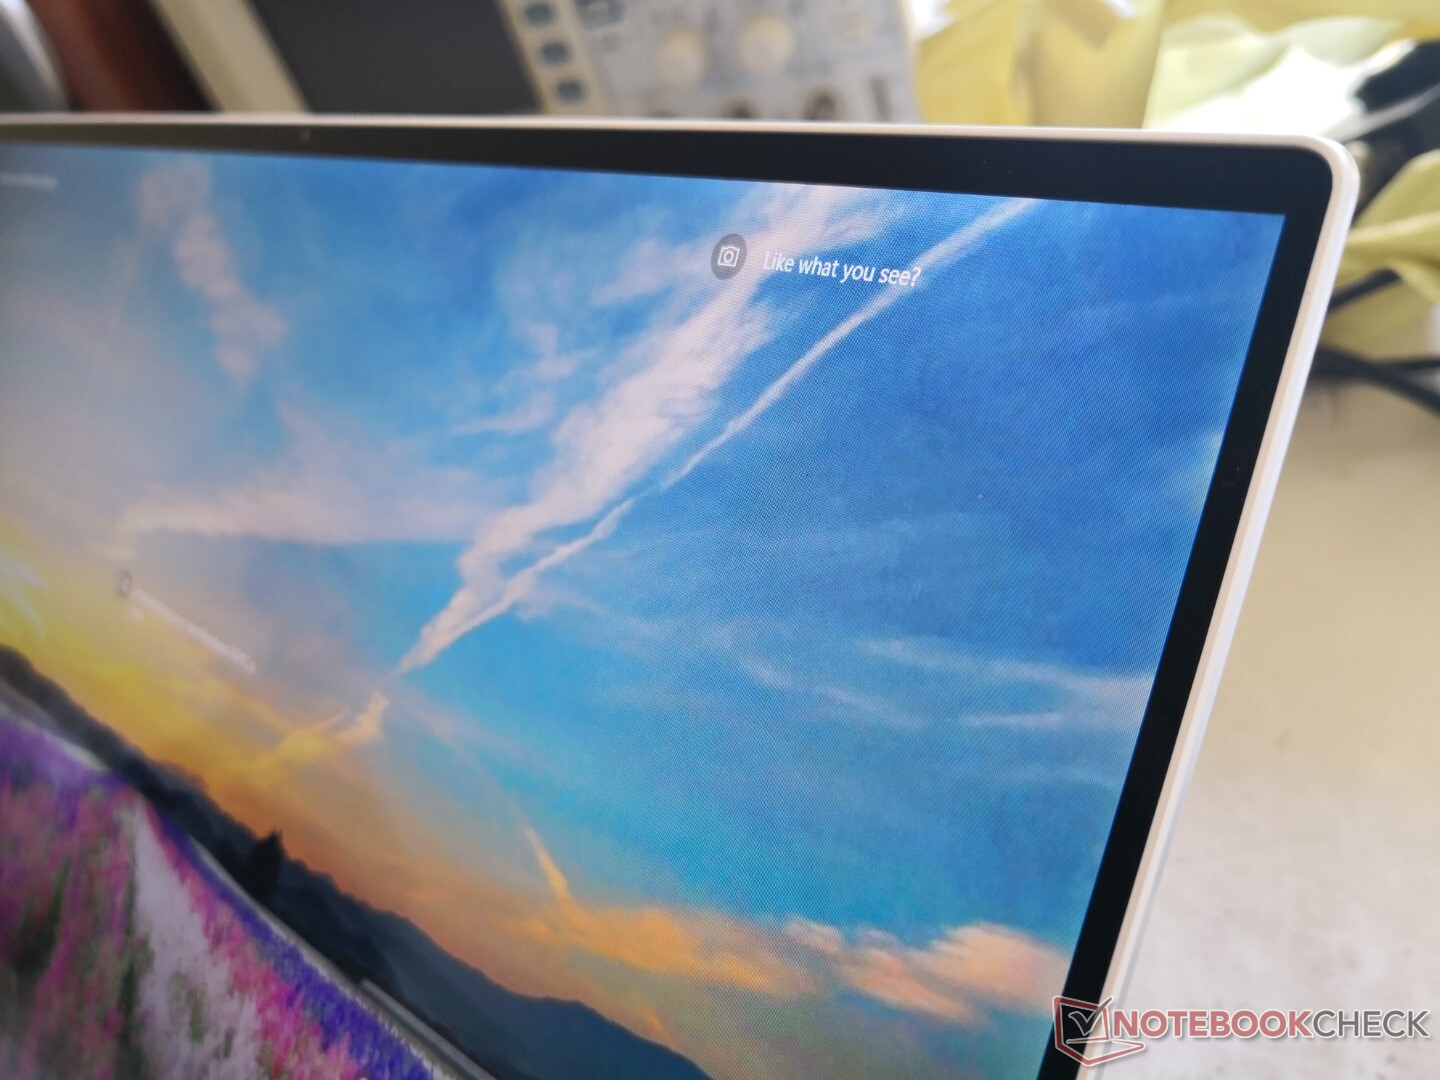
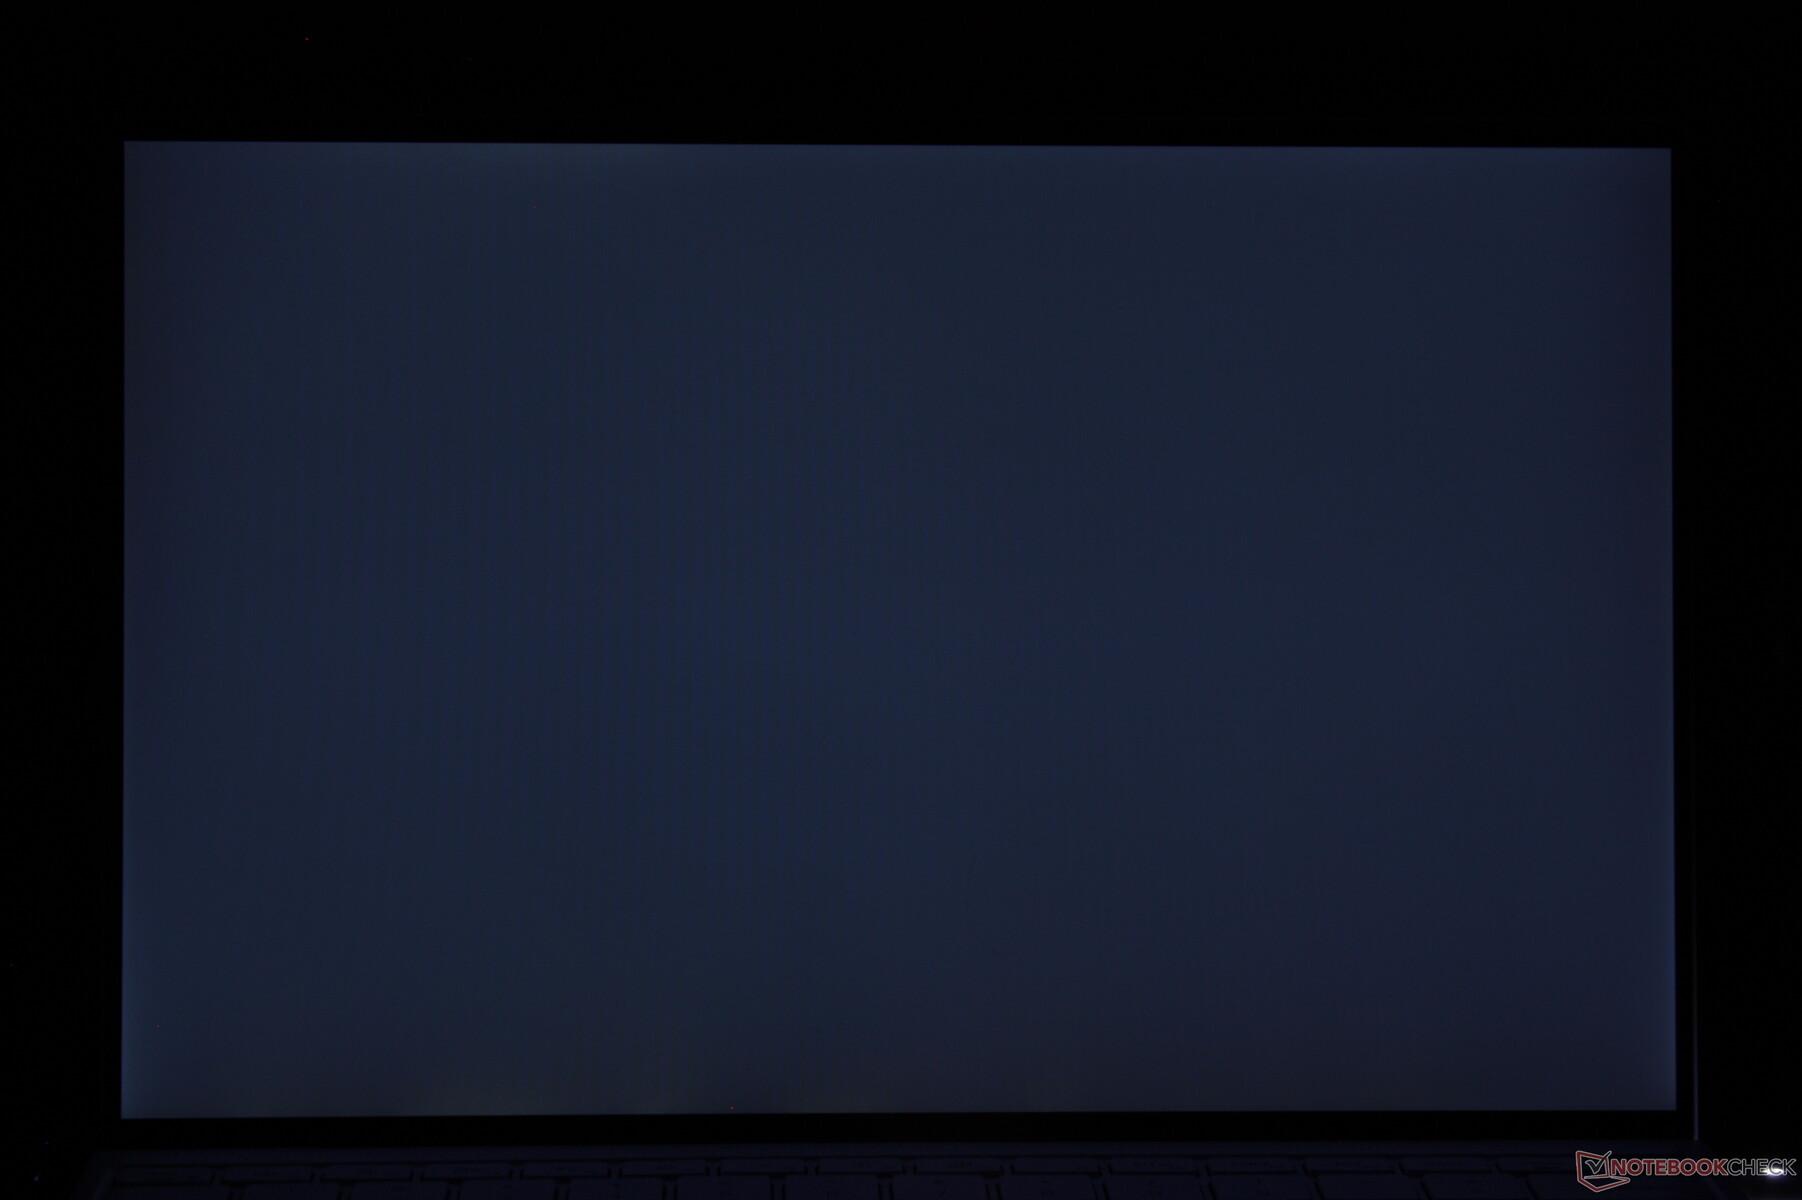
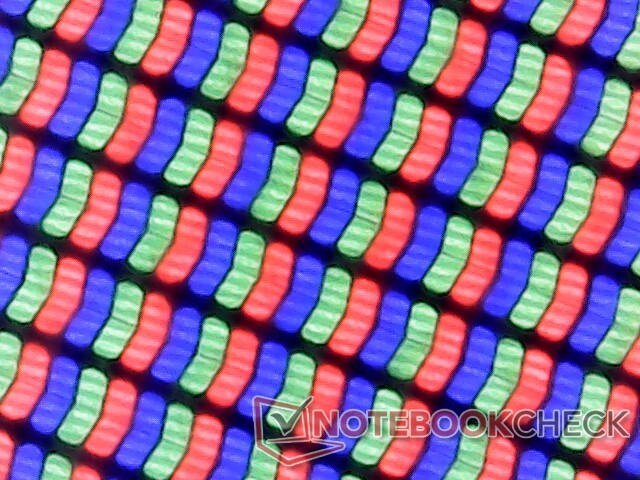
The 9310 uses the same Sharp LQ134N1 IPS panel as found on the XPS 13 9300 but with slightly different brightness levels and PWM values. Displays on XPS laptops have always been some of the best in their respective categories and this remains true on the 9310. Major drawbacks continue to be the relatively slow response times and lack of both adaptive sync and OLED options. The AMD-powered Lenovo Yoga Slim 7, for example, comes with adaptive sync to reduce screen tearing.
| |||||||||||||||||||||||||
Brightness Distribution: 92 %
Center on Battery: 543.3 cd/m²
Contrast: 1430:1 (Black: 0.38 cd/m²)
ΔE Color 3.02 | 0.5-29.43 Ø5, calibrated: 1.23
ΔE Greyscale 5 | 0.57-98 Ø5.3
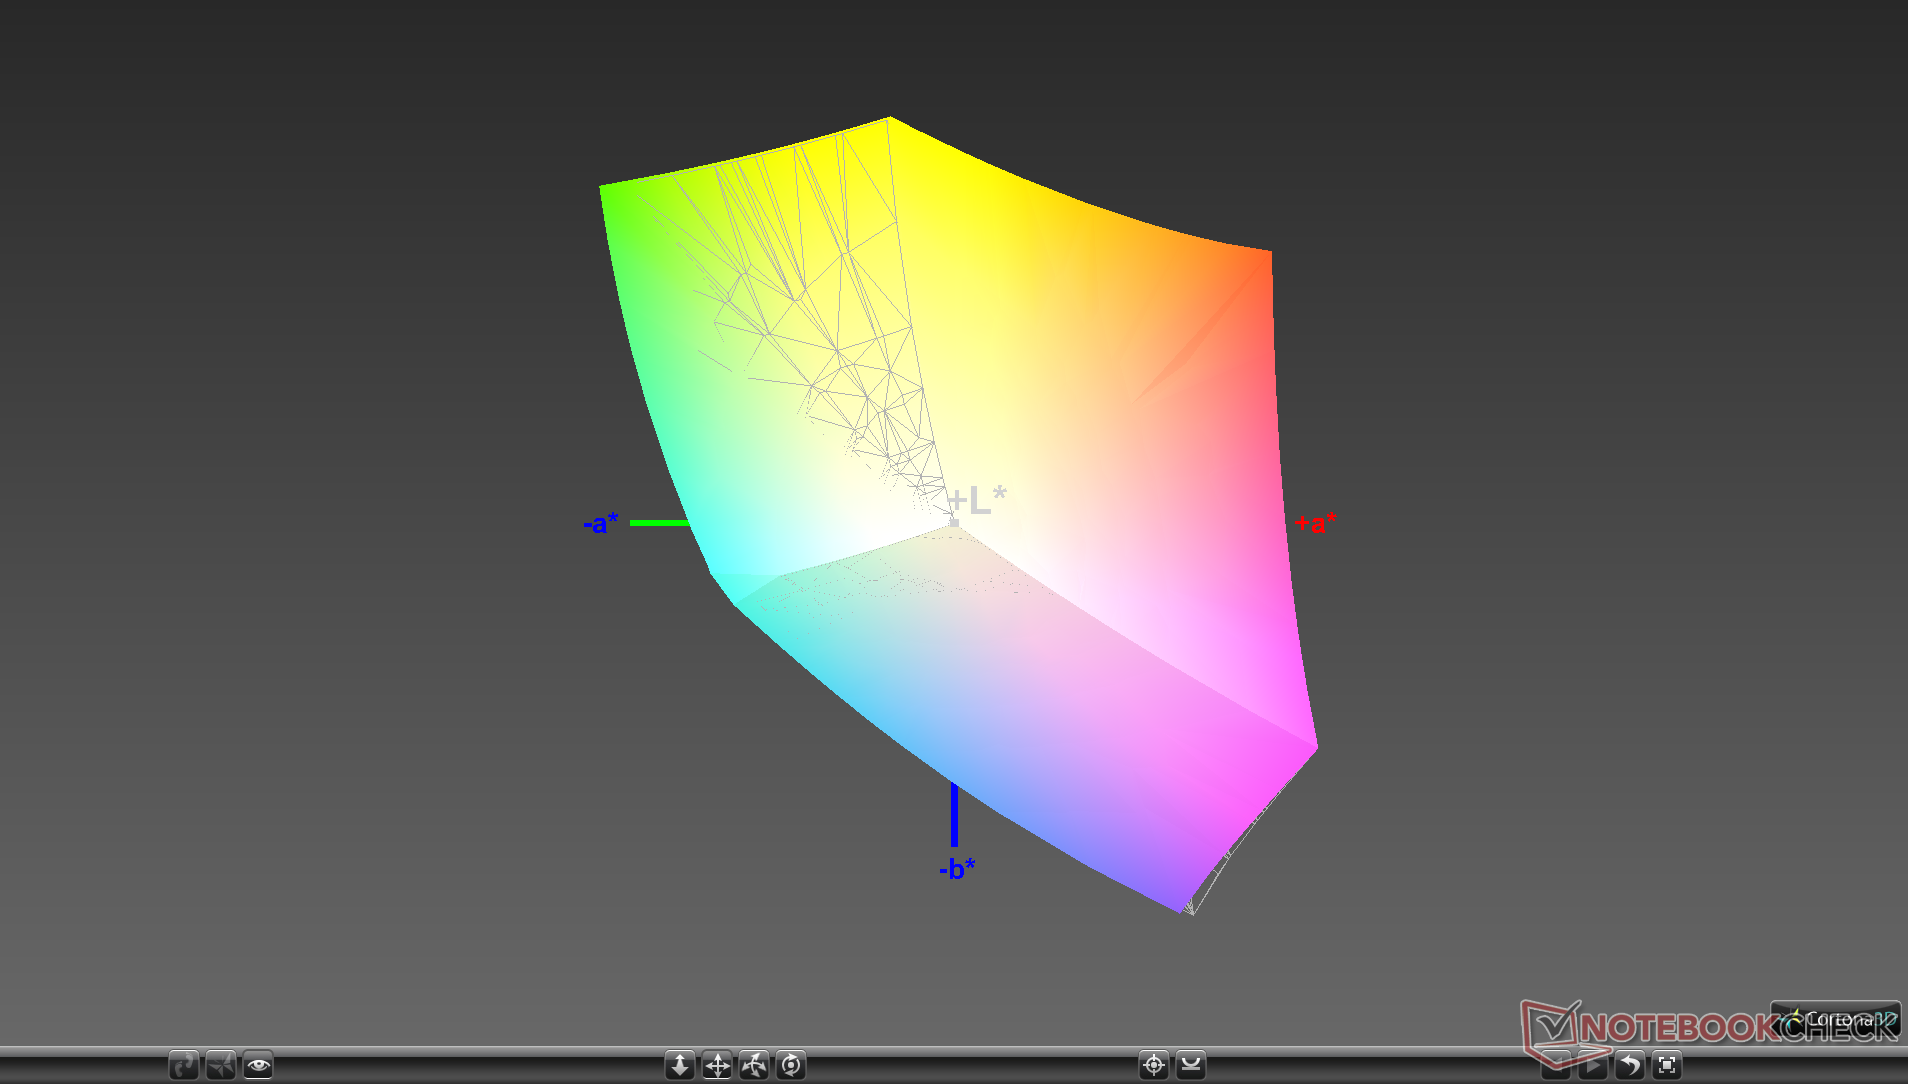
99.6% sRGB (Argyll 1.6.3 3D)
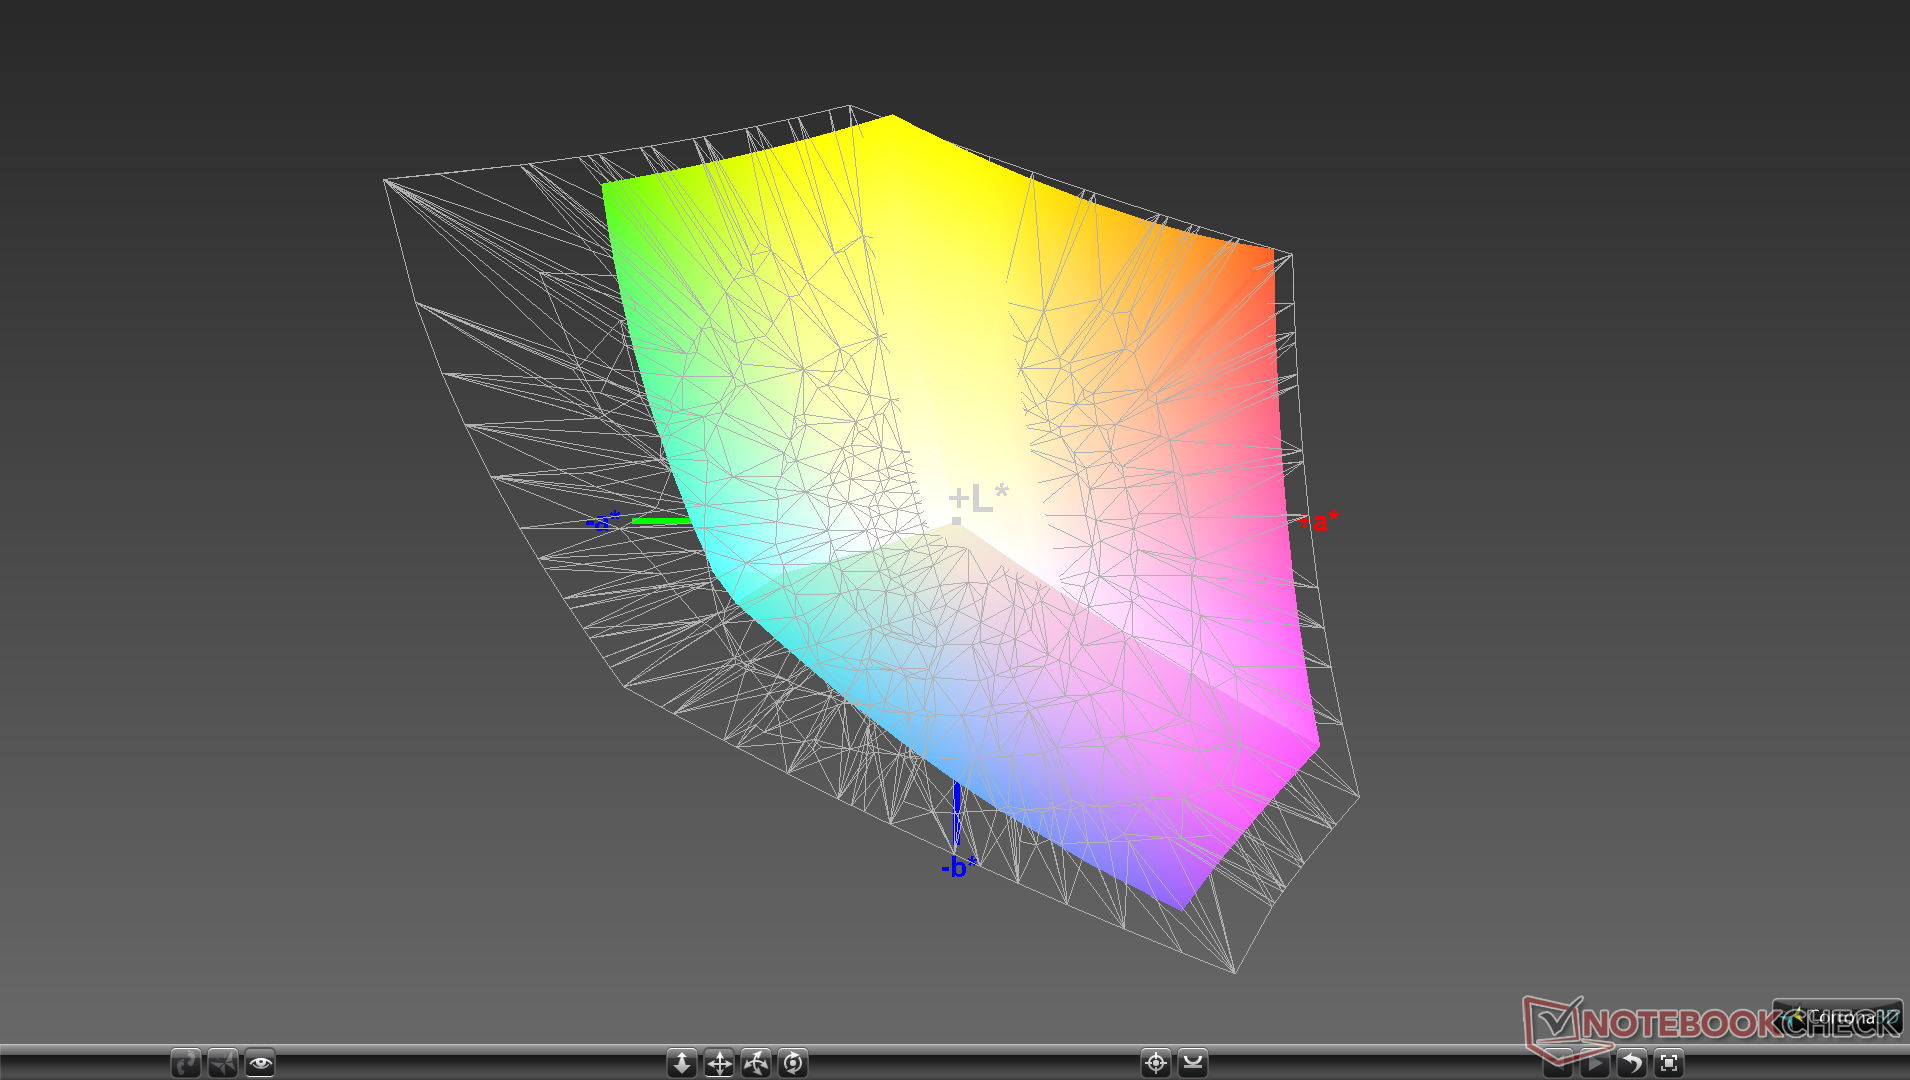
66.8% AdobeRGB 1998 (Argyll 1.6.3 3D)
72.9% AdobeRGB 1998 (Argyll 2.2.0 3D)
99.1% sRGB (Argyll 2.2.0 3D)
70.9% Display P3 (Argyll 2.2.0 3D)
Gamma: 2.02
| Dell XPS 13 9310 Core i7 FHD Sharp LQ134N1, IPS, 13.40, 1920x1200 | Dell XPS 13 9300 Core i7-1065G7 Sharp LQ134N1, IPS, 13.40, 1920x1200 | Apple MacBook Pro 13 2020 2GHz i5 10th-Gen APPA03D, IPS, 13.30, 2560x1600 | Huawei MateBook X Pro 2020 i7 JDI LPM139M422A, LTPS, 13.90, 3000x2000 | Lenovo Yoga Slim 7-14ARE AU Optronics B140HAN06.8, IPS, 14.00, 1920x1080 | HP Spectre x360 13-aw0013dx AU Optronics AUO5E2D, IPS, 13.30, 1920x1080 | |
|---|---|---|---|---|---|---|
| Display | -5% | 20% | -4% | 0% | -1% | |
| Display P3 Coverage | 70.9 | 66.3 -6% | 98.8 39% | 66.6 -6% | 71.7 1% | 69.6 -2% |
| sRGB Coverage | 99.1 | 97.3 -2% | 99.9 1% | 99.4 0% | 99.3 0% | 98.9 0% |
| AdobeRGB 1998 Coverage | 72.9 | 68.5 -6% | 86.4 19% | 68.6 -6% | 72.9 0% | 71.5 -2% |
| Response Times | 2% | 1501% | 362% | 12% | -14% | |
| Response Time Grey 50% / Grey 80% * | 52 ? | 50 ? 4% | 46 ? 12% | 49.6 ? 5% | 45.6 ? 12% | 60.8 ? -17% |
| Response Time Black / White * | 33.2 ? | 33.2 ? -0% | 32.4 ? 2% | 30.8 ? 7% | 29.6 ? 11% | 36.8 ? -11% |
| PWM Frequency | 2475 ? | 2500 ? 1% | 113600 ? 4490% | 29070 ? 1075% | ||
| Screen | 1% | 19% | 23% | -9% | -11% | |
| Brightness middle | 543.3 | 607.6 12% | 512 -6% | 557 3% | 399.6 -26% | 447.4 -18% |
| Brightness | 524 | 595 14% | 491 -6% | 532 2% | 385 -27% | 420 -20% |
| Brightness Distribution | 92 | 96 4% | 91 -1% | 87 -5% | 89 -3% | 85 -8% |
| Black Level * | 0.38 | 0.4 -5% | 0.32 16% | 0.33 13% | 0.37 3% | 0.31 18% |
| Contrast | 1430 | 1519 6% | 1600 12% | 1688 18% | 1080 -24% | 1443 1% |
| Colorchecker dE 2000 * | 3.02 | 3.23 -7% | 1.7 44% | 1.4 54% | 3.2 -6% | 4.23 -40% |
| Colorchecker dE 2000 max. * | 7.61 | 8.67 -14% | 3.4 55% | 2.5 67% | 6.44 15% | 9.34 -23% |
| Colorchecker dE 2000 calibrated * | 1.23 | 1.01 18% | 1 19% | 0.7 43% | 1.73 -41% | 1.32 -7% |
| Greyscale dE 2000 * | 5 | 5.5 -10% | 1.9 62% | 2 60% | 4.7 6% | 6.1 -22% |
| Gamma | 2.02 109% | 2.12 104% | 2.19 100% | 2.14 103% | 2.21 100% | 2.11 104% |
| CCT | 6550 99% | 6413 101% | 6817 95% | 6689 97% | 7184 90% | 6136 106% |
| Color Space (Percent of AdobeRGB 1998) | 66.8 | 63 -6% | 77.4 16% | 62.5 -6% | 66.3 -1% | 64.8 -3% |
| Color Space (Percent of sRGB) | 99.6 | 97.5 -2% | 99.9 0% | 99.5 0% | 99.5 0% | 98.9 -1% |
| Total Average (Program / Settings) | -1% /
0% | 513% /
281% | 127% /
78% | 1% /
-5% | -9% /
-10% |
* ... smaller is better
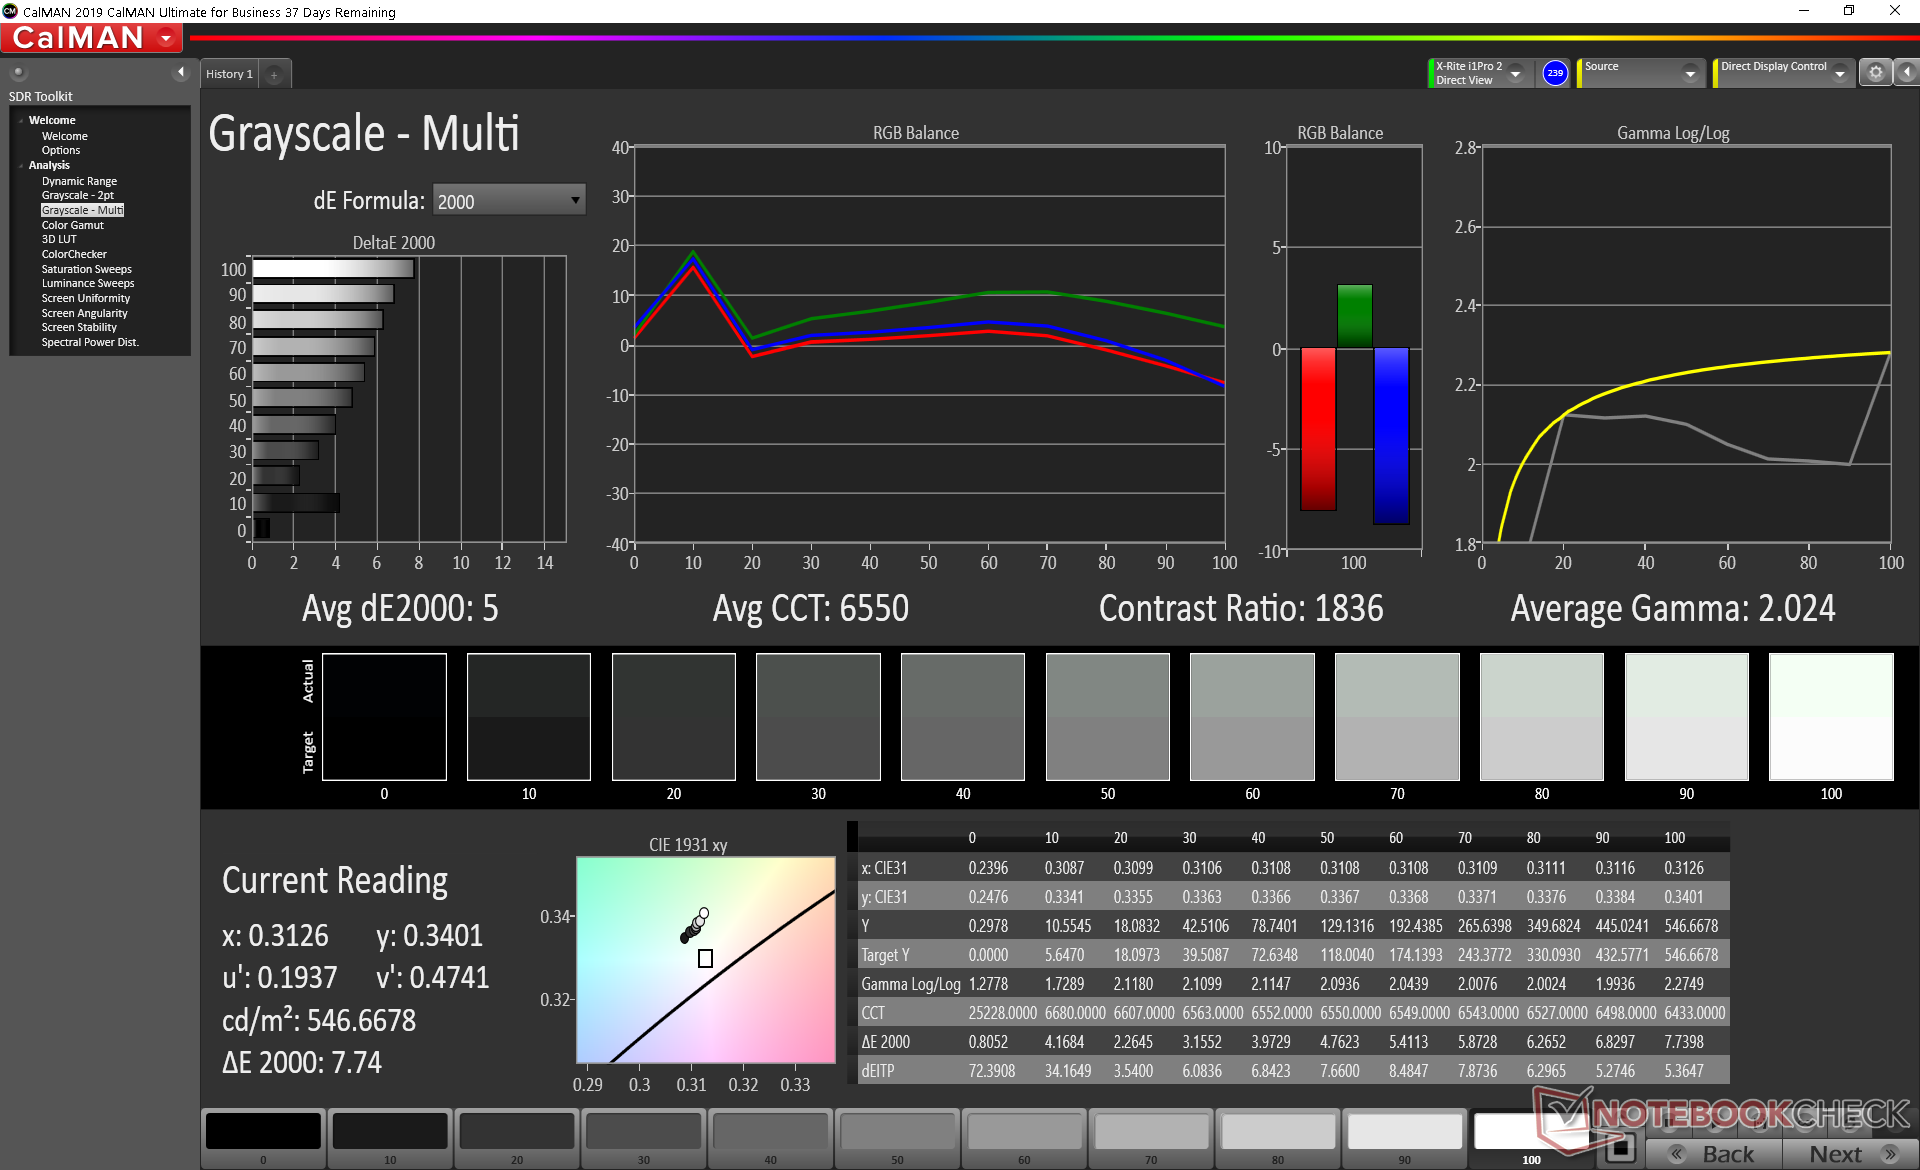
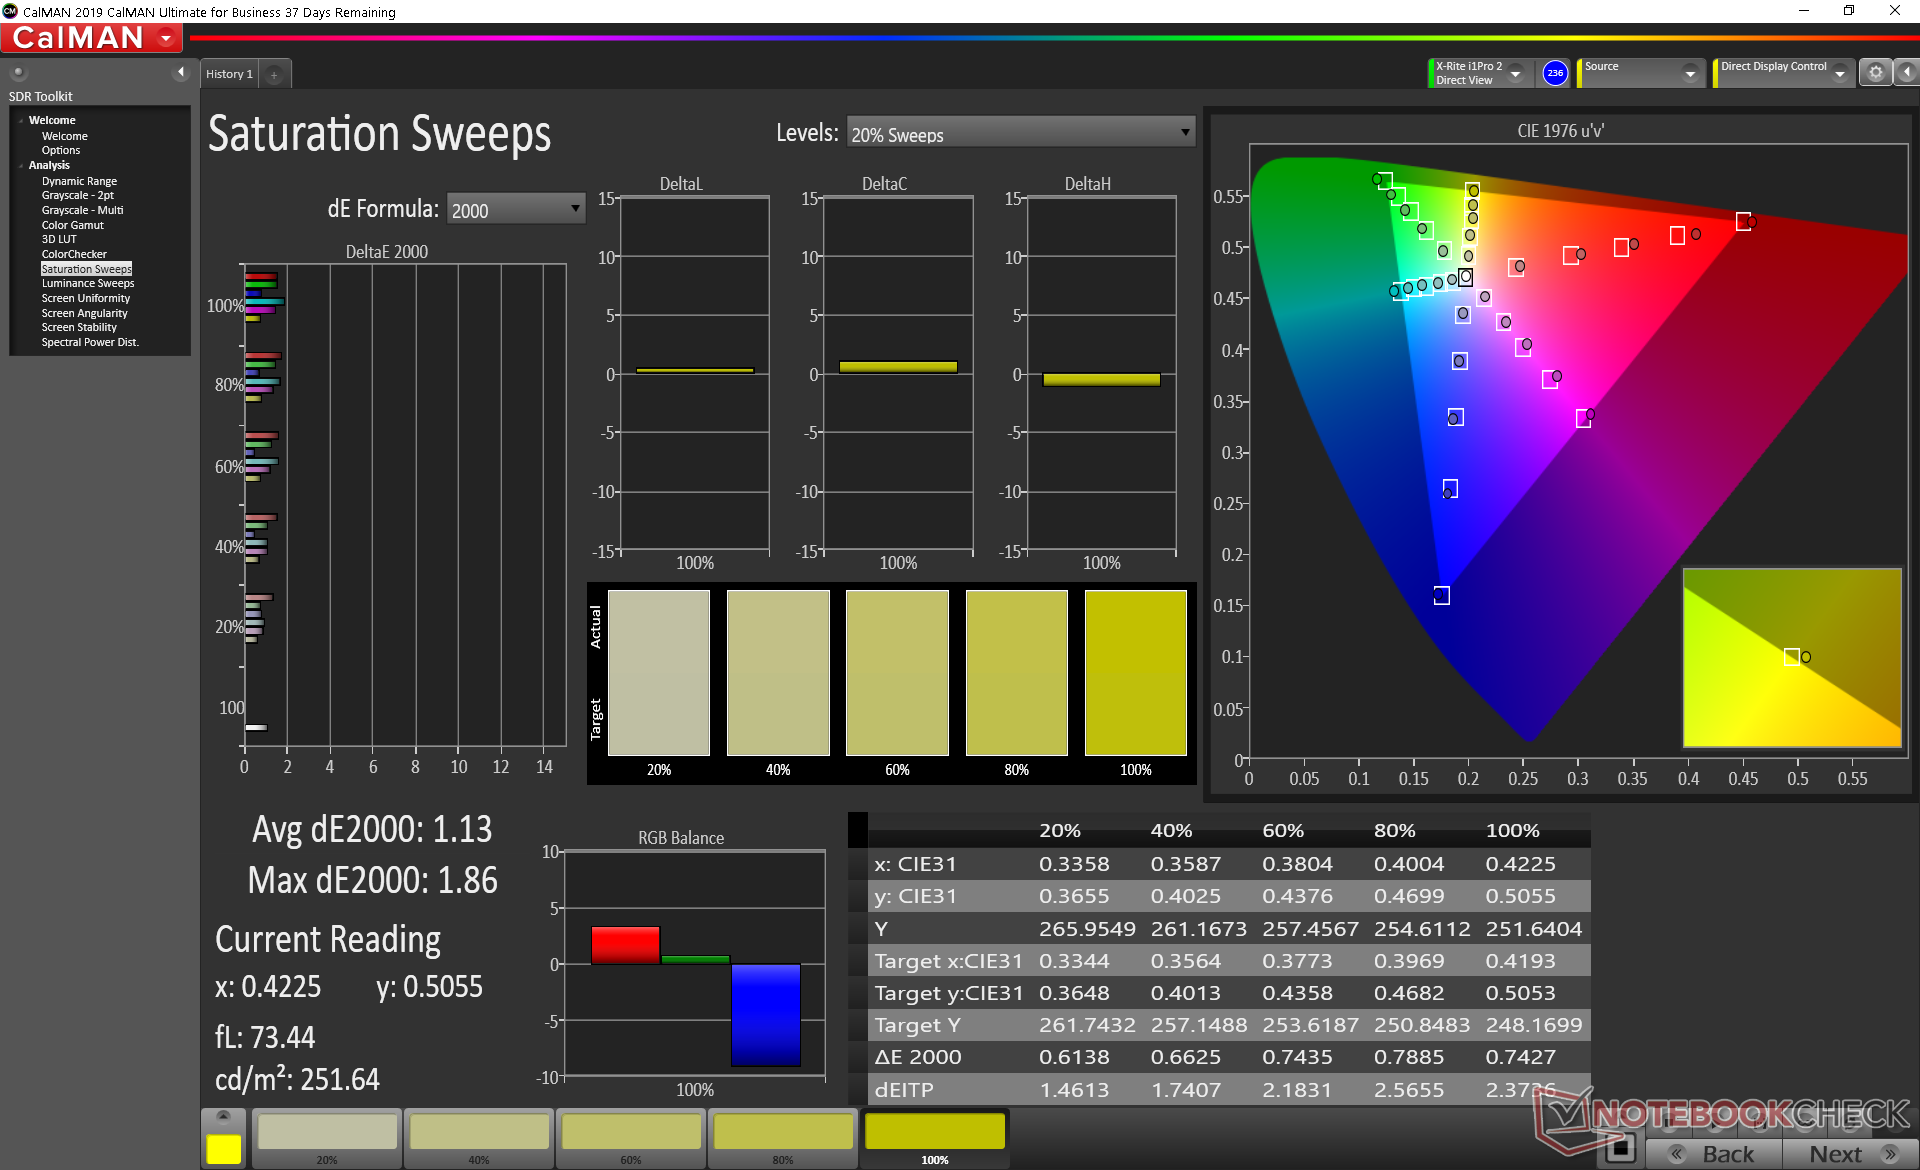
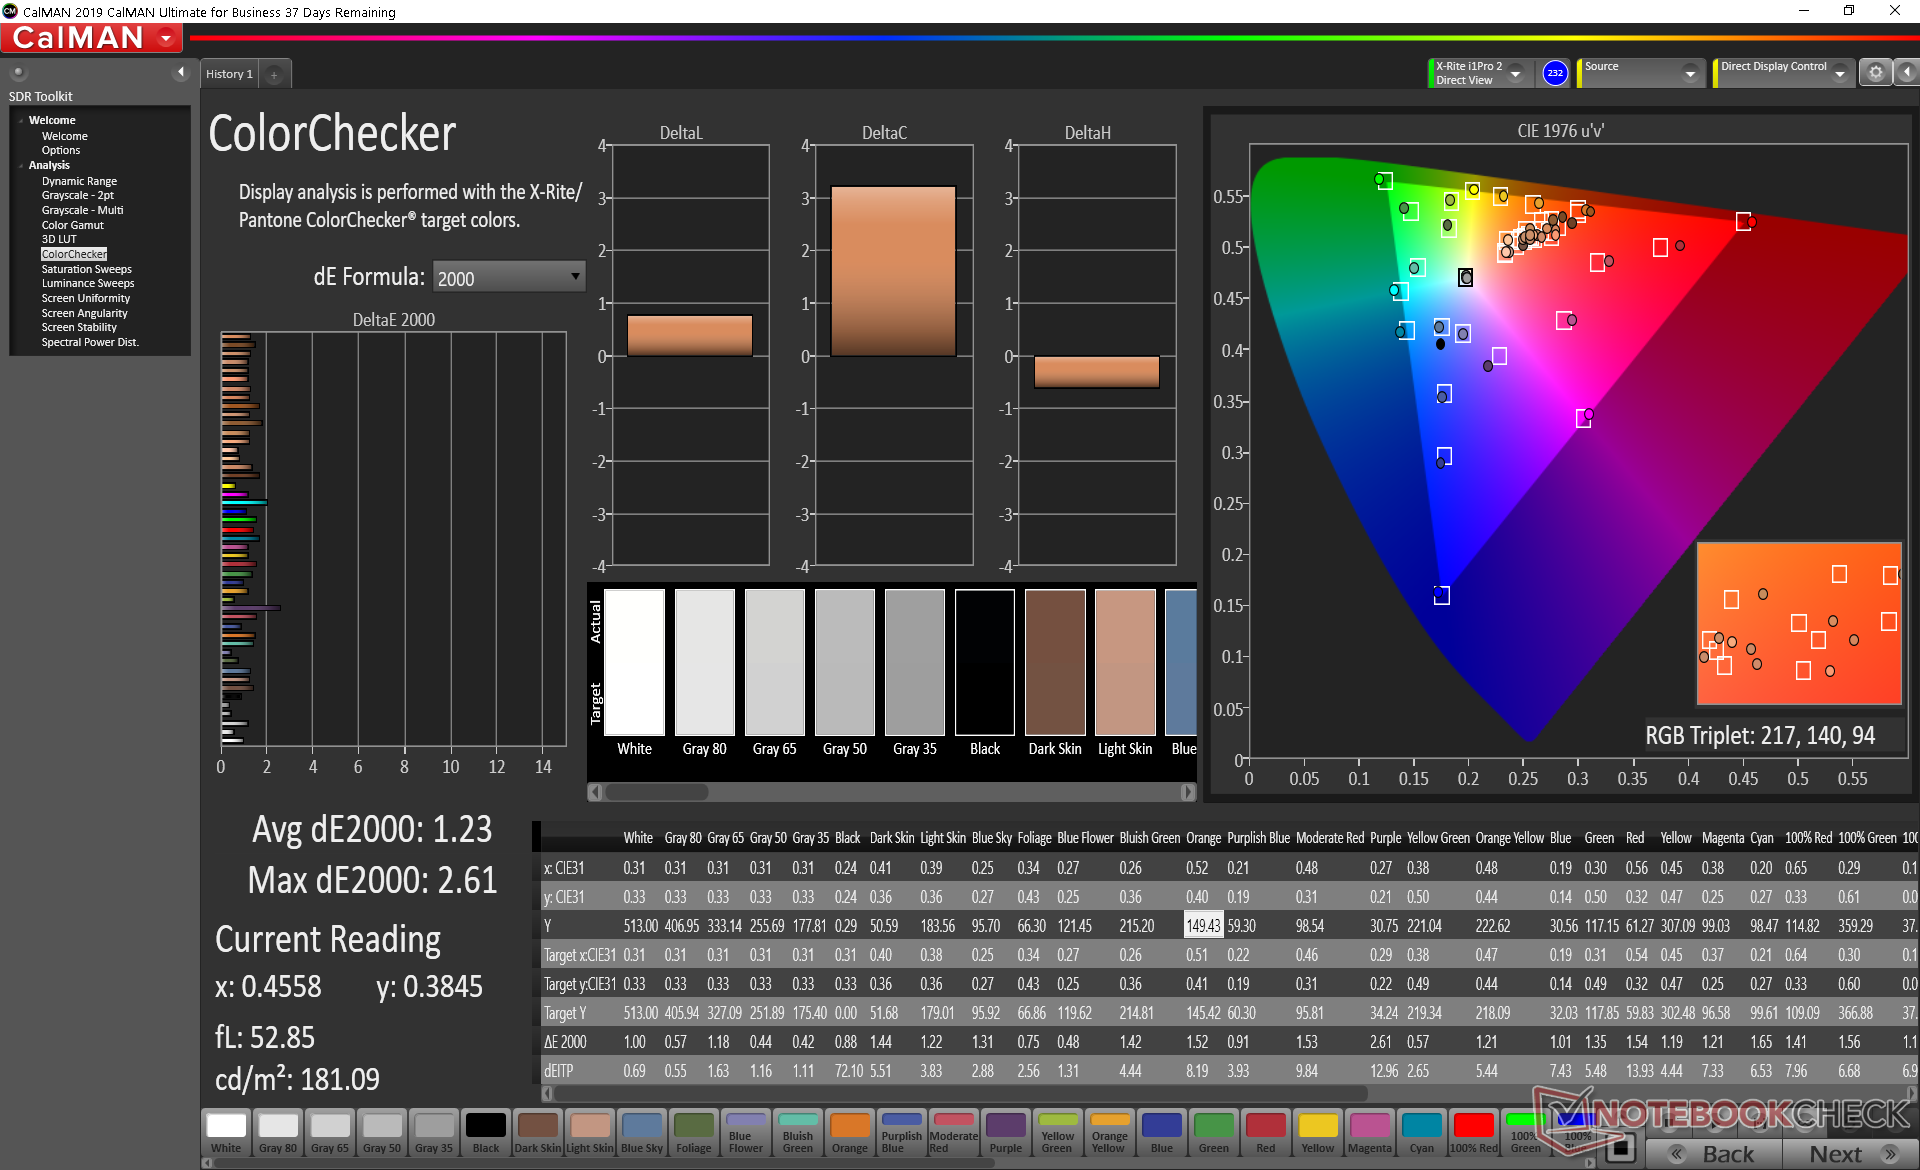
All XPS 13 9300/9310 SKUs top out at 100 percent sRGB coverage with no options for full AdobeRGB or DCI-P3 unlike on the XPS 15 series. This shouldn't be an issue for anyone who's not a professional graphics editor.
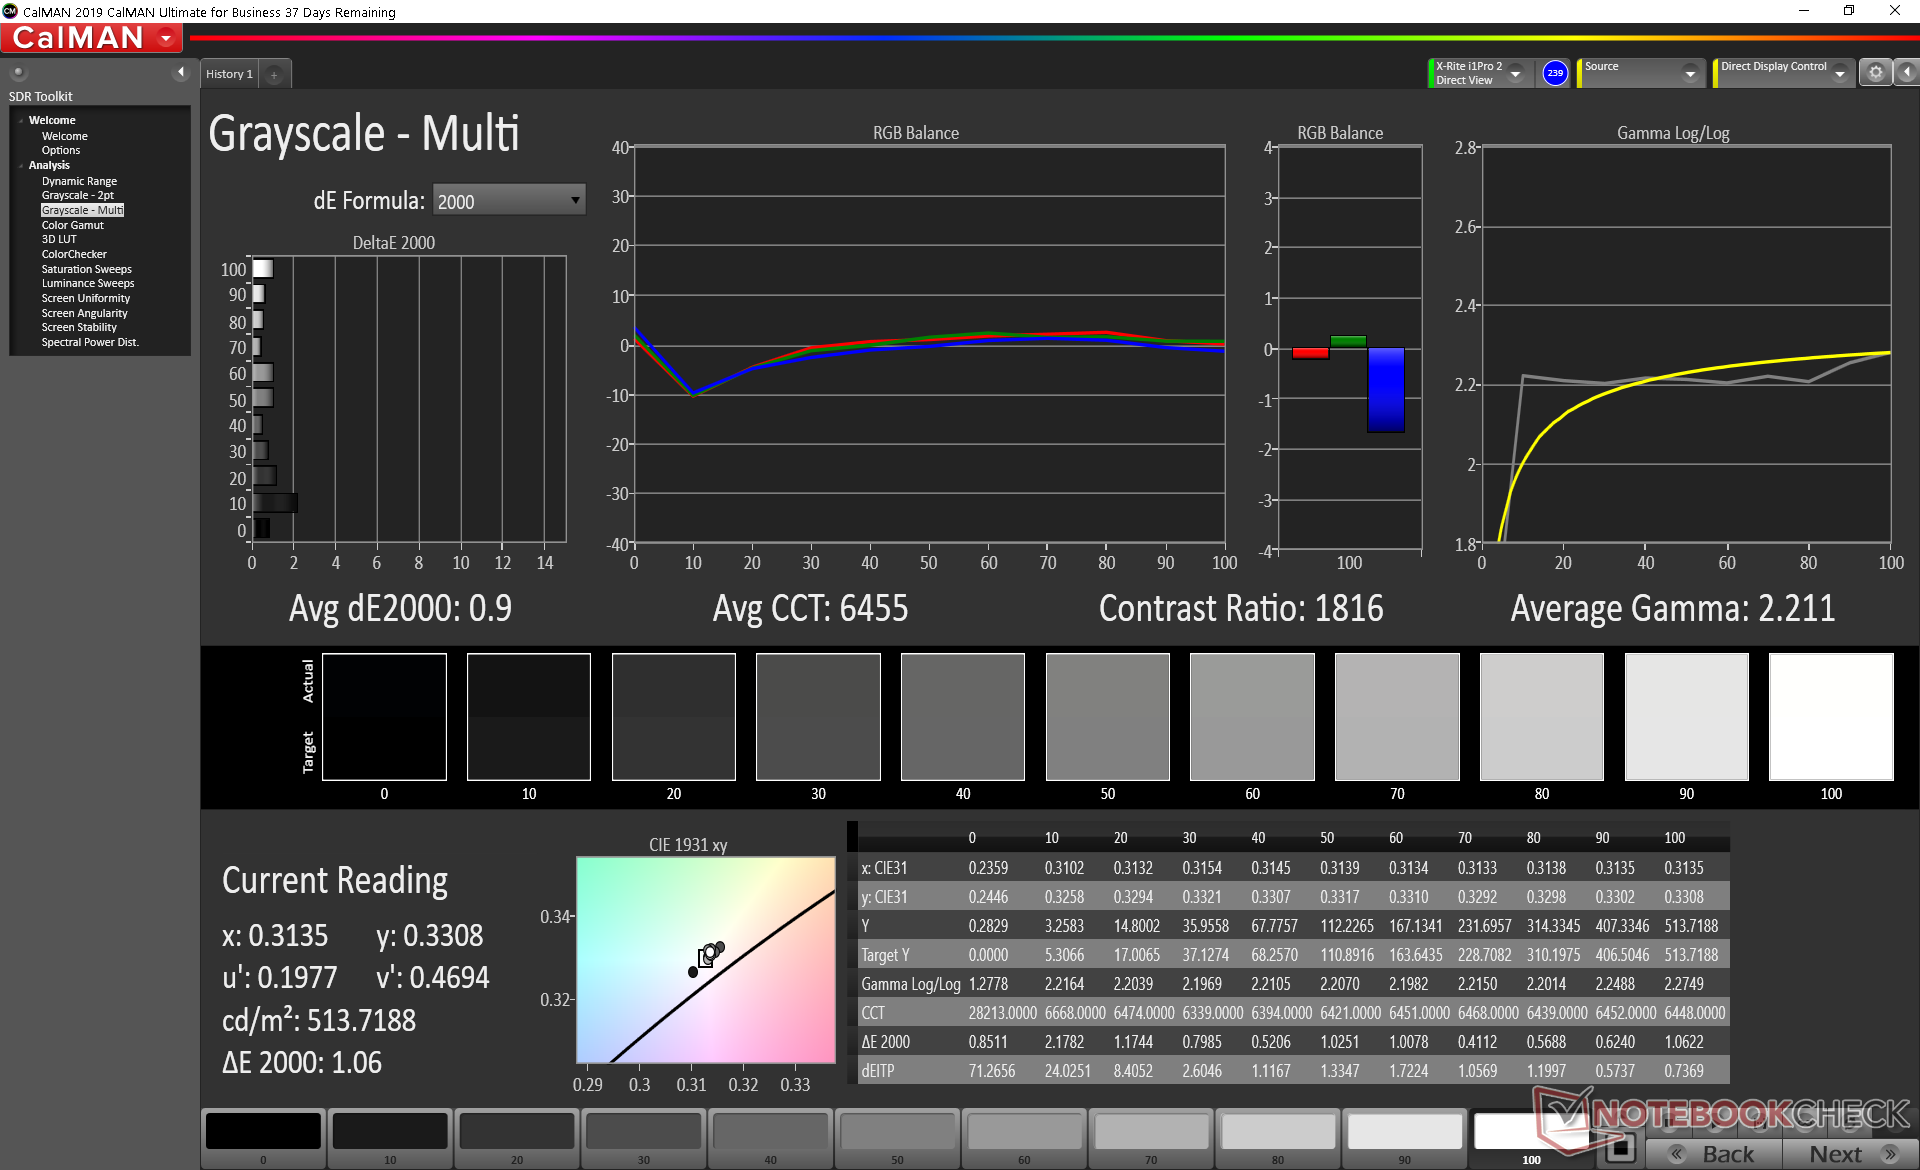
The out-of-the-box gamma value of 2.0 could have been better. Calibrating the display ourselves with an X-Rite colorimeter brings gamma closer to the 2.2 target with subsequently better grayscale and colors across the board.
Display Response Times
| ↔ Response Time Black to White | ||
|---|---|---|
| 33.2 ms ... rise ↗ and fall ↘ combined | ↗ 19.2 ms rise | 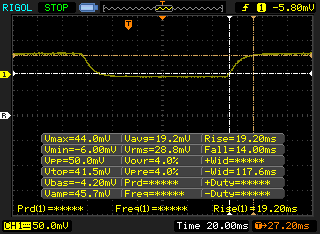 |
| ↘ 14 ms fall | ||
| The screen shows slow response rates in our tests and will be unsatisfactory for gamers. In comparison, all tested devices range from 0.1 (minimum) to 240 (maximum) ms. » 88 % of all devices are better. This means that the measured response time is worse than the average of all tested devices (21.5 ms). | ||
| ↔ Response Time 50% Grey to 80% Grey | ||
| 52 ms ... rise ↗ and fall ↘ combined | ↗ 27.6 ms rise | 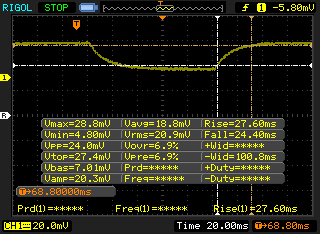 |
| ↘ 24.4 ms fall | ||
| The screen shows slow response rates in our tests and will be unsatisfactory for gamers. In comparison, all tested devices range from 0.2 (minimum) to 636 (maximum) ms. » 87 % of all devices are better. This means that the measured response time is worse than the average of all tested devices (33.7 ms). | ||
Screen Flickering / PWM (Pulse-Width Modulation)
| Screen flickering / PWM detected | 2475 Hz | ≤ 20 % brightness setting | 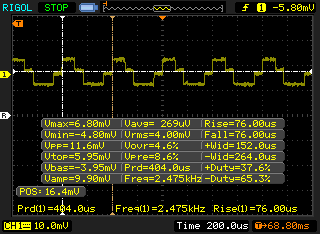 |
The display backlight flickers at 2475 Hz (worst case, e.g., utilizing PWM) Flickering detected at a brightness setting of 20 % and below. There should be no flickering or PWM above this brightness setting. The frequency of 2475 Hz is quite high, so most users sensitive to PWM should not notice any flickering. In comparison: 53 % of all tested devices do not use PWM to dim the display. If PWM was detected, an average of 17903 (minimum: 5 - maximum: 3846000) Hz was measured. | |||

Performance
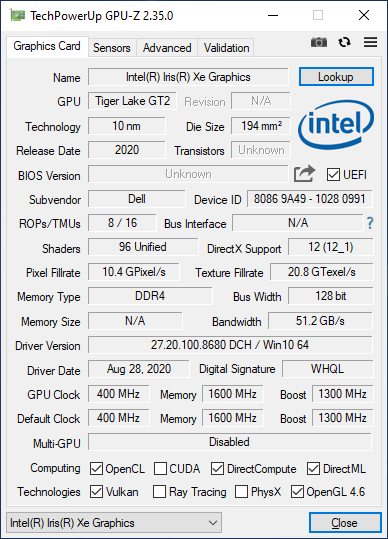
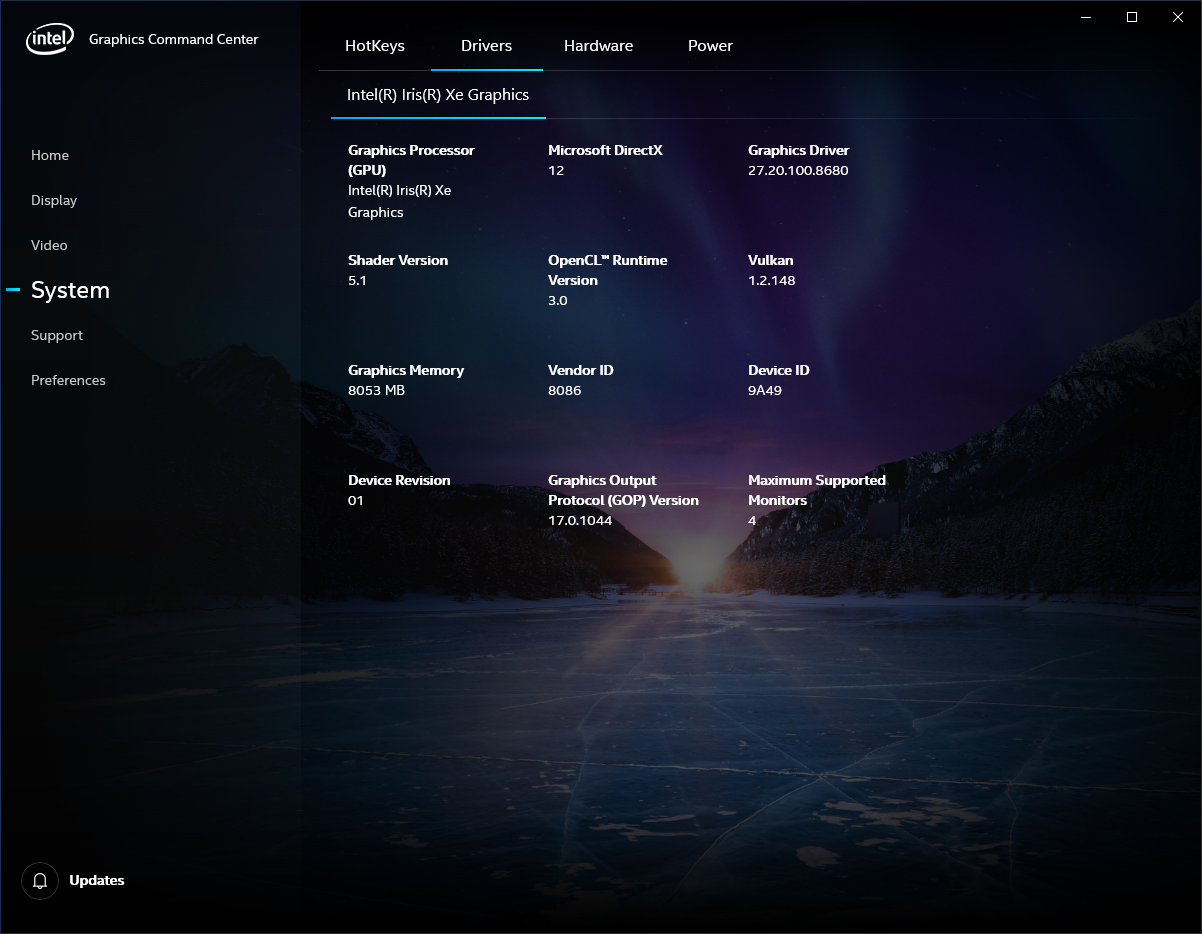
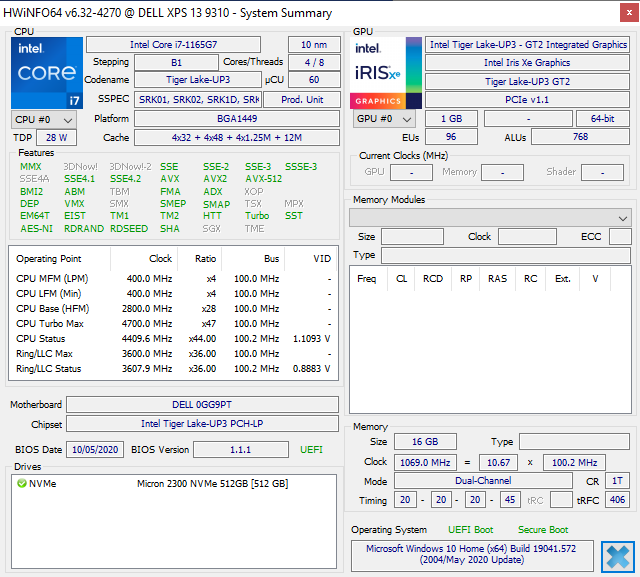
All XPS 13 9310 SKUs come with either the Core i3-1115G4, Core i5-1135G7, or Core i7-1165G7 CPU with 8 GB to 32 GB of 4267 MHz RAM. Integrated Iris Xe graphics comes standard on all configurations, but expect it to run slower and with fewer EUs on the Core i3-1115G4 option.
Unless otherwise stated, our tests below were performed on Ultra Performance mode for the highest scores possible from the system. The power profiles can all be found within the pre-installed Dell Power Manager software.
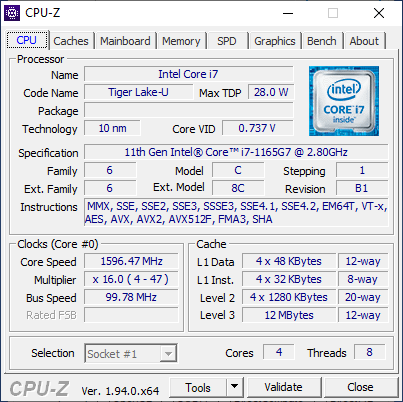
Processor
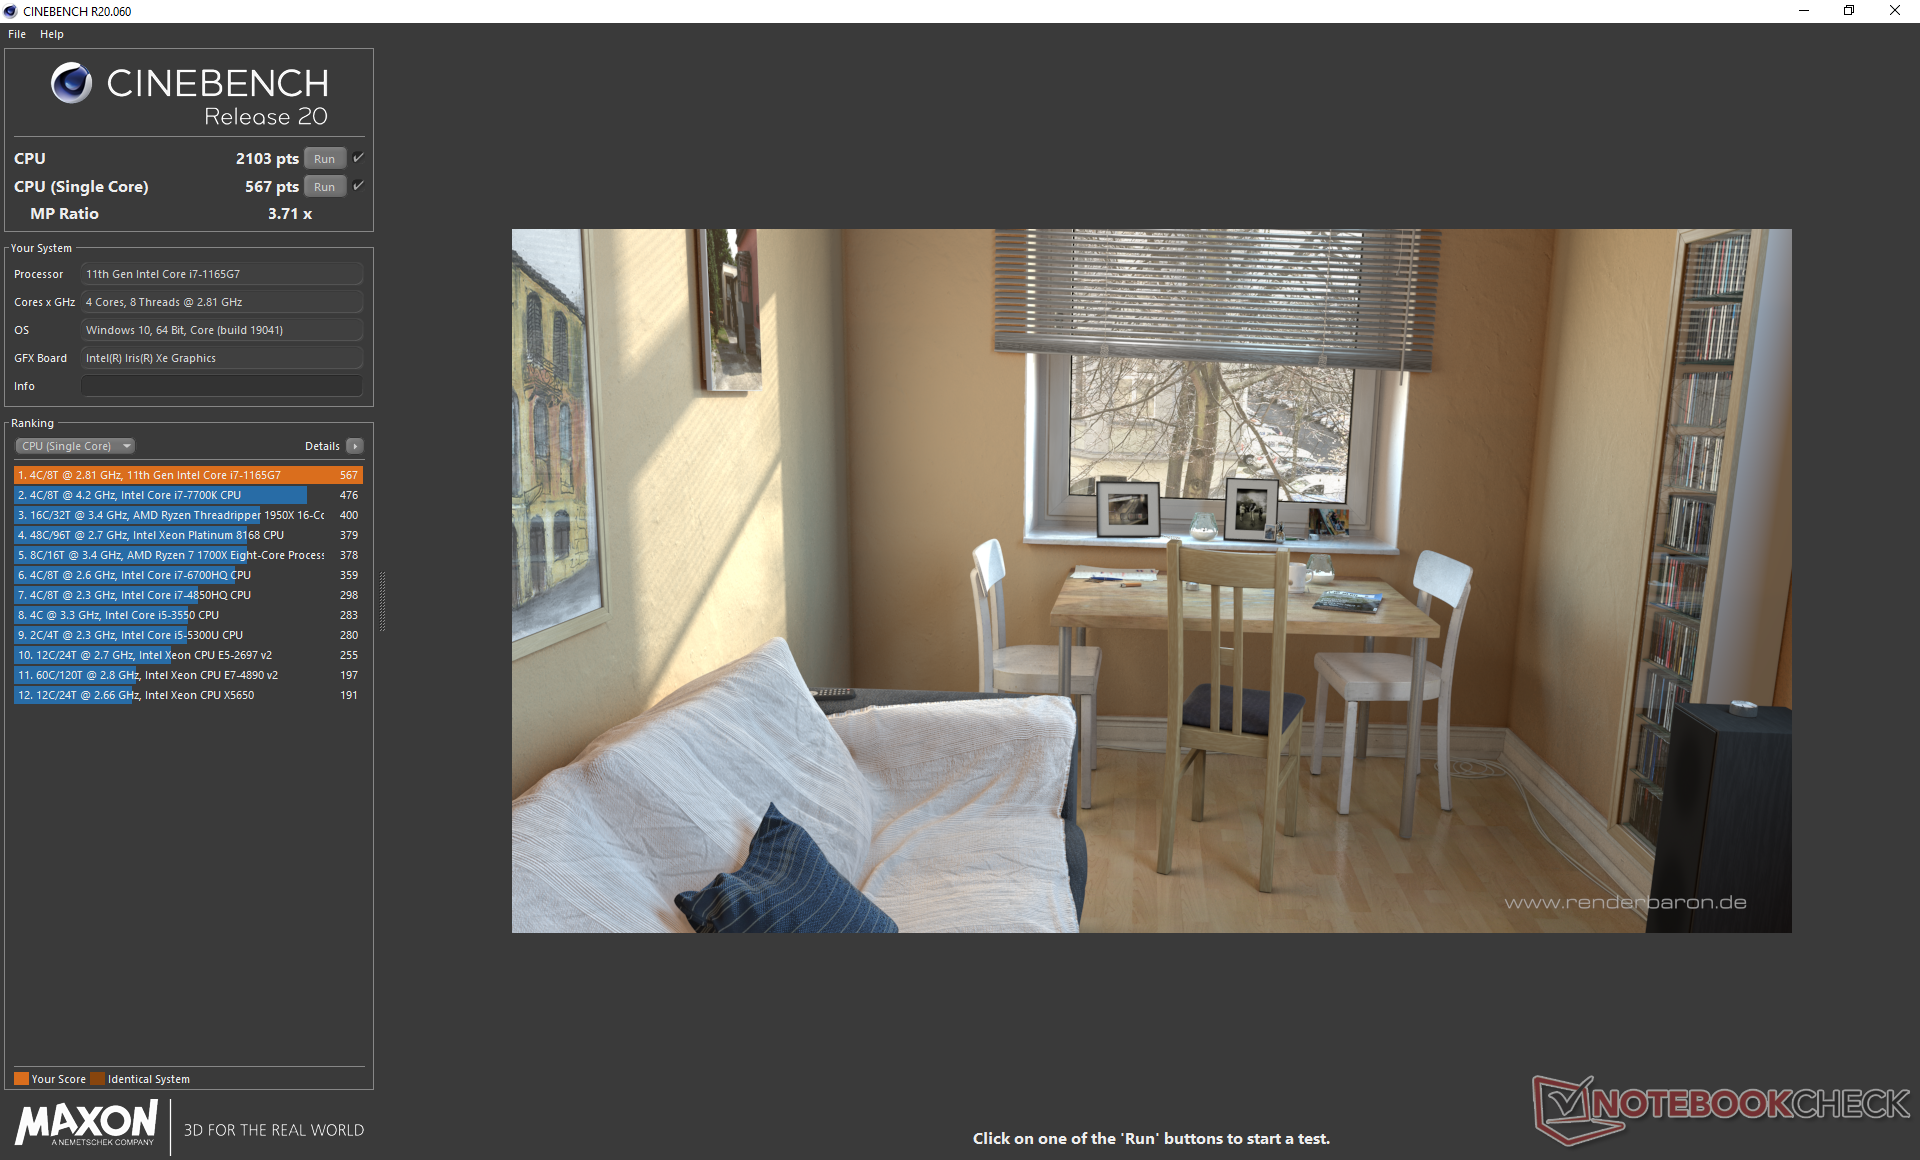
As the fourth laptop in our database equipped with the Core i7-1165G7, the XPS 13 9310 is performing where we expect it to be at within just a few percentage points of the average. Unfortunately, this also means that any raw performance gains over last year's Core i7-1065G7 are relatively minor.
Dell continues to rely on Dynamic Tuning to squeeze as much performance out of the processor as possible within the capabilities of the overlying cooling solution. This is exemplified by the cycling CineBench R15 xT scores when running the benchmark in a loop as shown by the graph below compared to the flatter scores of the Asus ZenBook 14 series running on the same CPU. CineBench R20 scores on the Core i7 XPS 13 9300 can range from 1396 points to 1883 points because of the varying clock rates. We explore this further in the Stress Test section below.
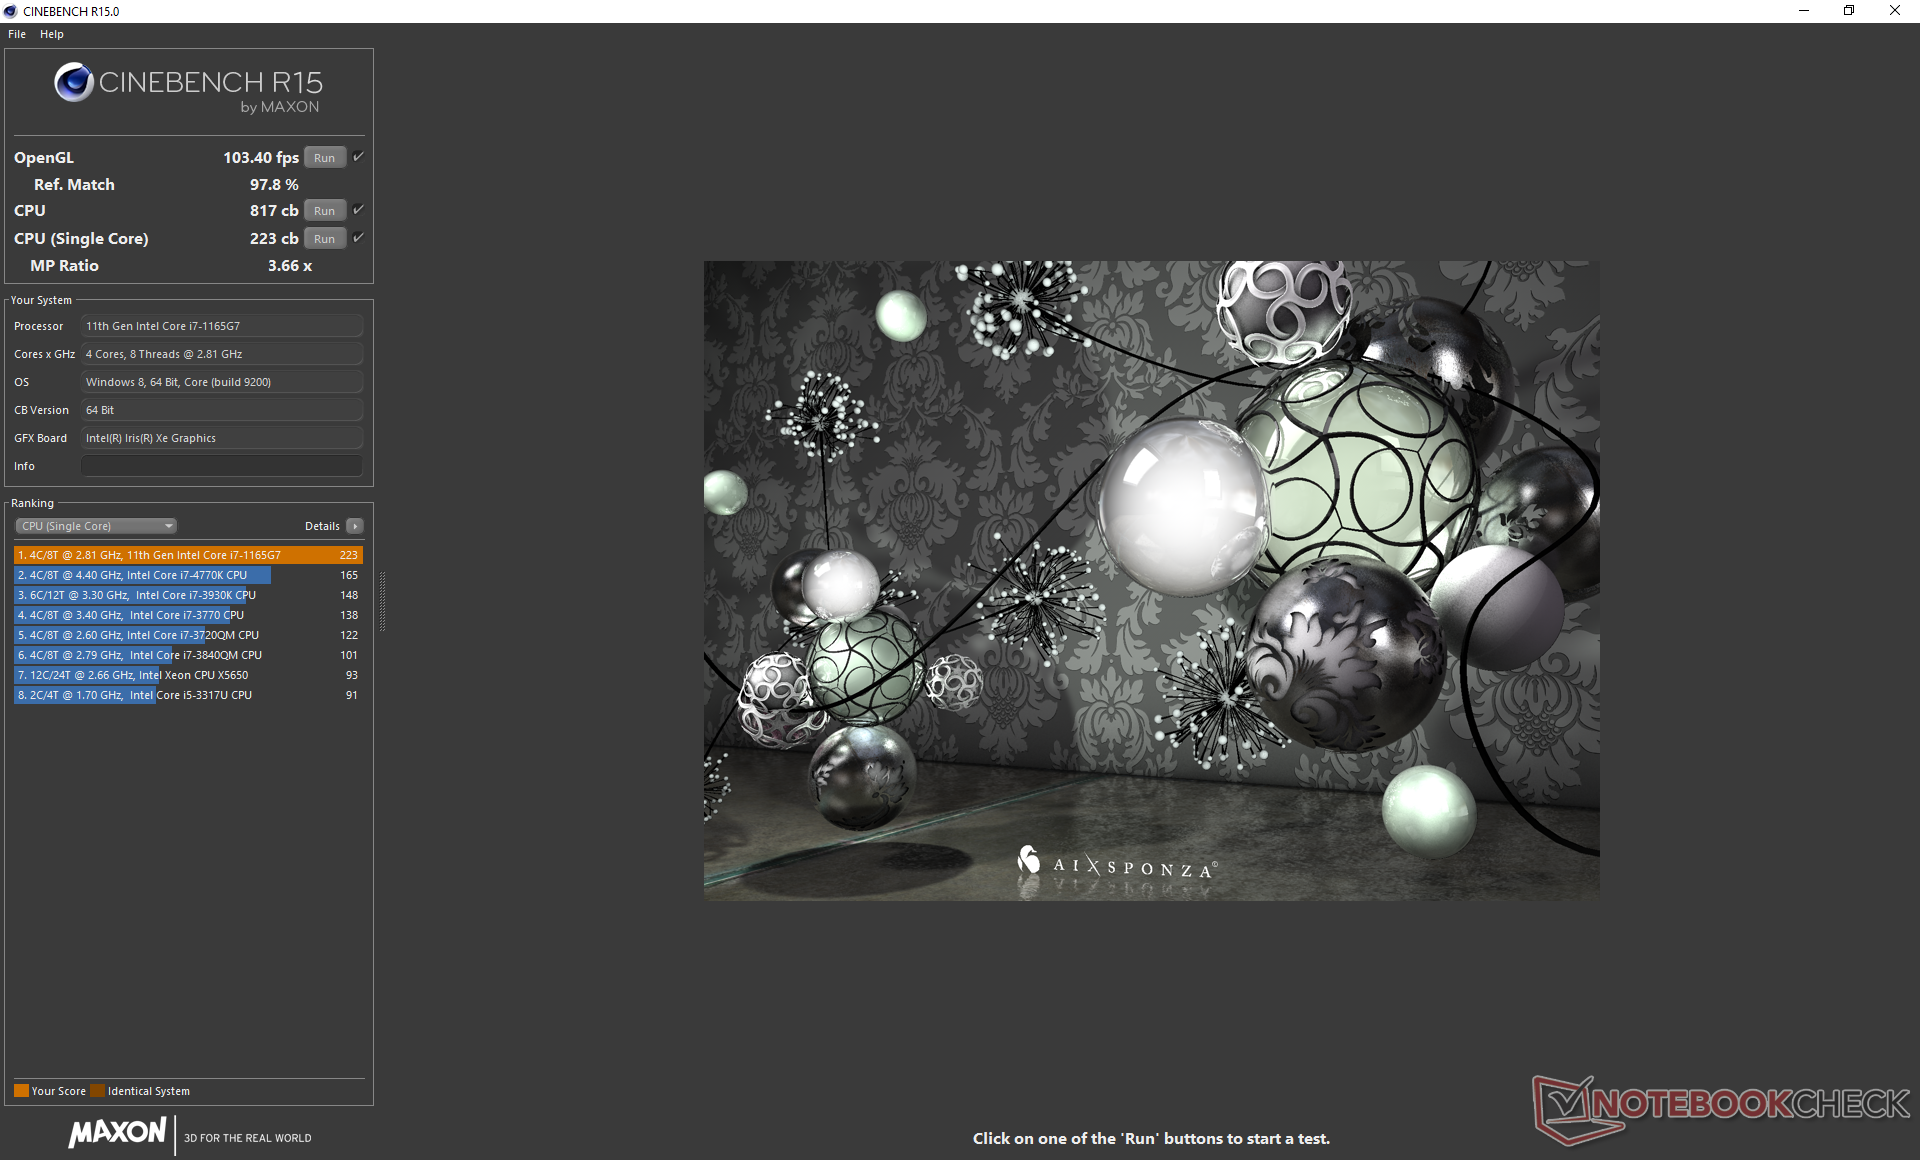
Cinebench R15: CPU Multi 64Bit | CPU Single 64Bit
Blender: v2.79 BMW27 CPU
7-Zip 18.03: 7z b 4 -mmt1 | 7z b 4
Geekbench 5.5: Single-Core | Multi-Core
HWBOT x265 Benchmark v2.2: 4k Preset
LibreOffice : 20 Documents To PDF
R Benchmark 2.5: Overall mean
Cinebench R15: CPU Multi 64Bit | CPU Single 64Bit
Blender: v2.79 BMW27 CPU
7-Zip 18.03: 7z b 4 -mmt1 | 7z b 4
Geekbench 5.5: Single-Core | Multi-Core
HWBOT x265 Benchmark v2.2: 4k Preset
LibreOffice : 20 Documents To PDF
R Benchmark 2.5: Overall mean
* ... smaller is better
System Performance
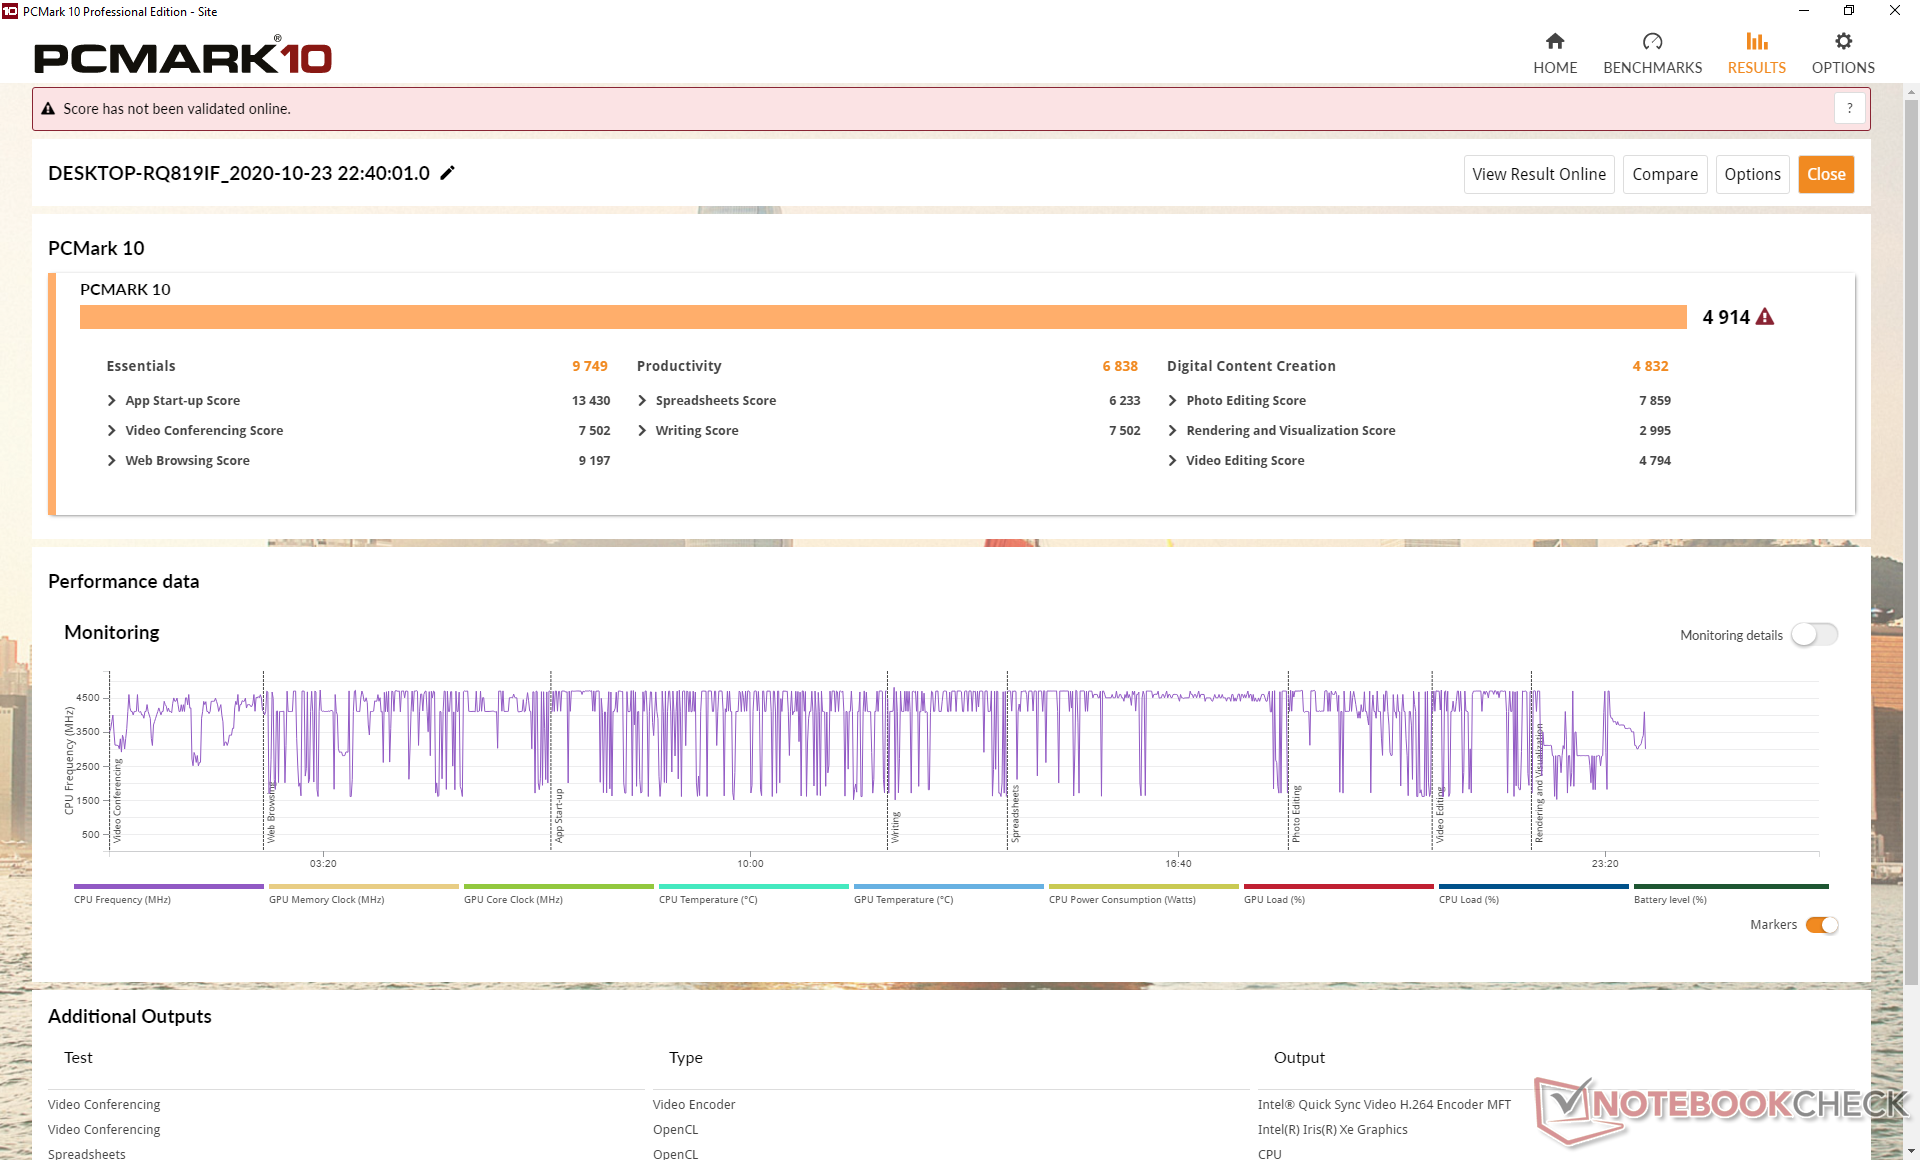
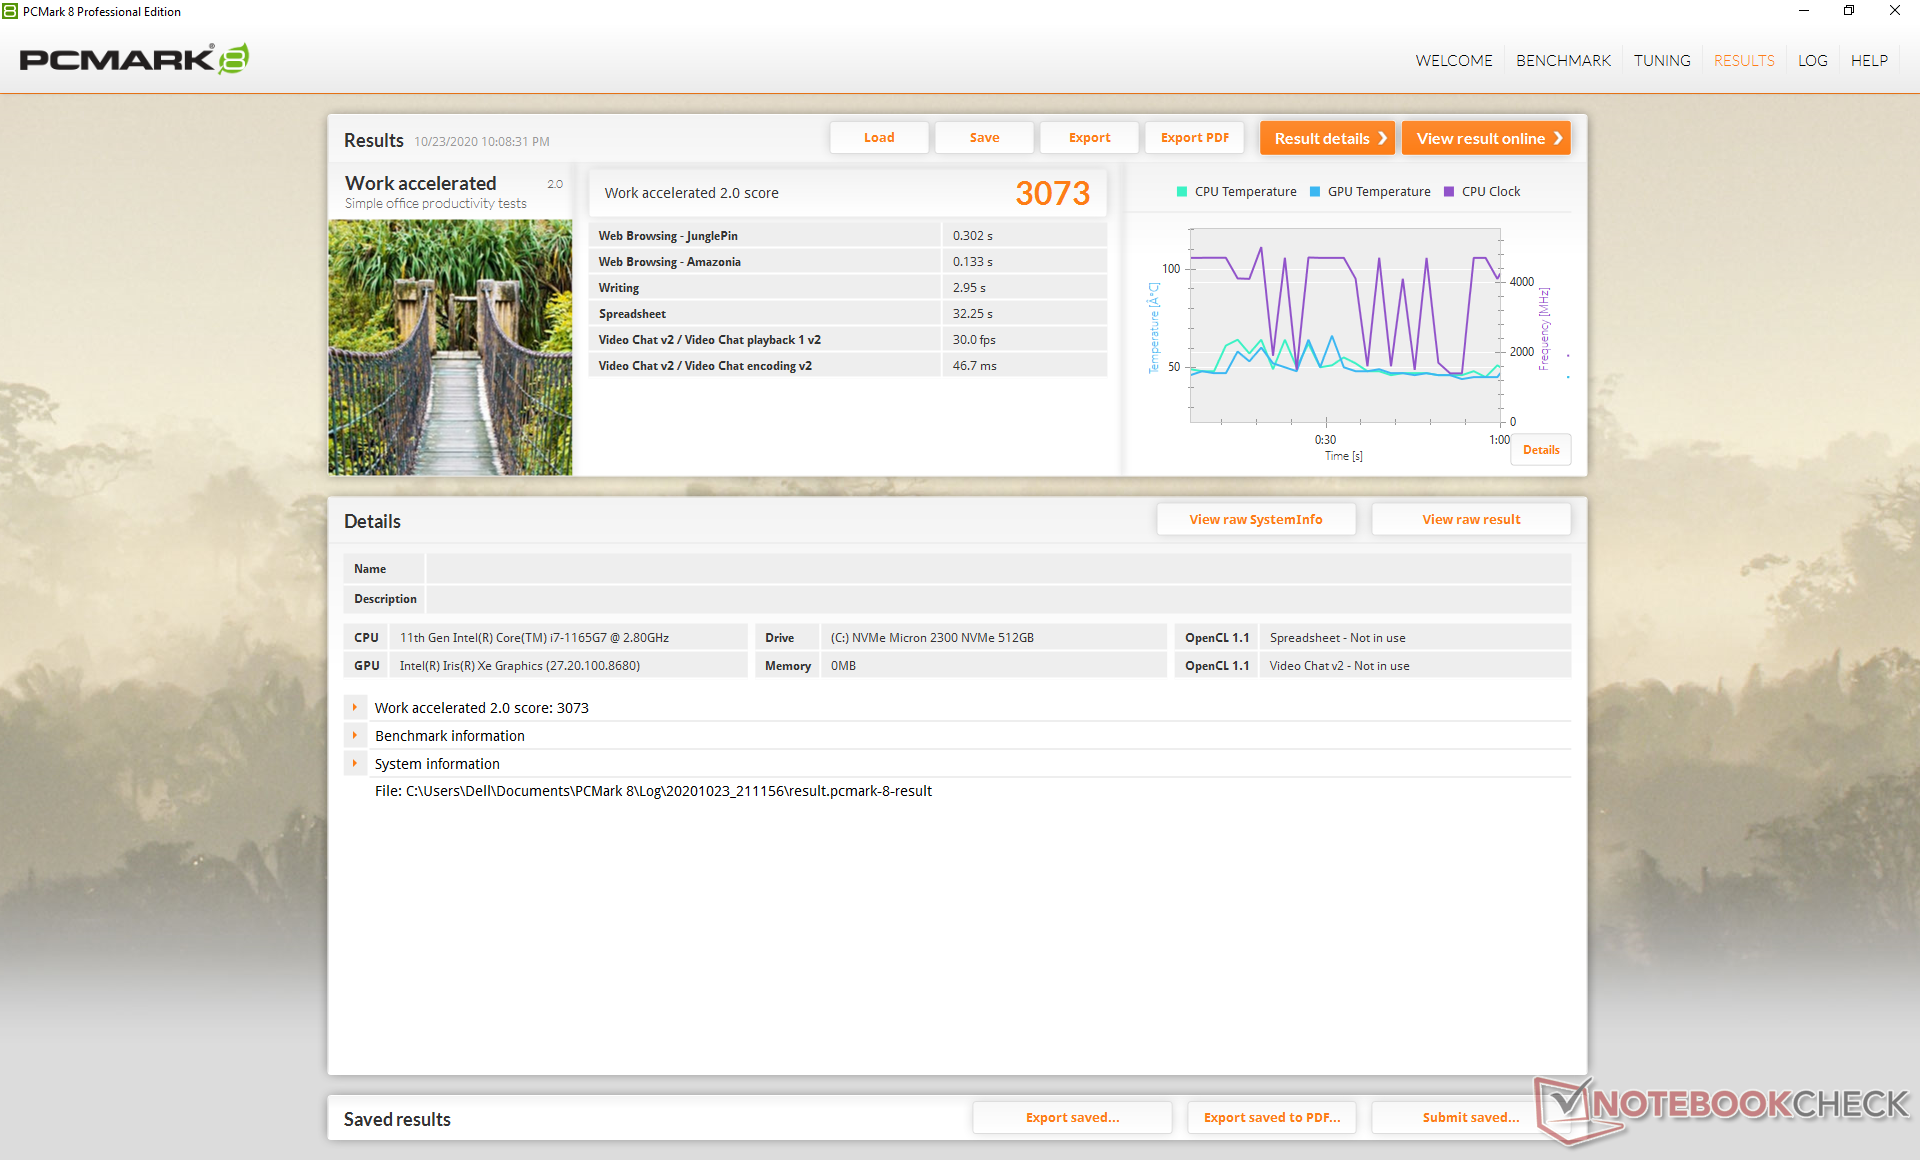
PCMark benchmarks are consistently higher than last year's Ice Lake-powered XPS 13 9300 by at least double-digit percentage points likely due to the faster integrated GPU. The less expensive AMD-powered Lenovo Yoga Slim 7, however, still comes out on top.
During our time with the test unit, the system randomly rebooted itself one night to update its BIOS. It would then be stuck on the bootup screen for almost 20 minutes before finally entering Windows safe mode. The system was back to normal after restarting from there, but the entire process was definitely an undesirable experience especially on a new flagship laptop.
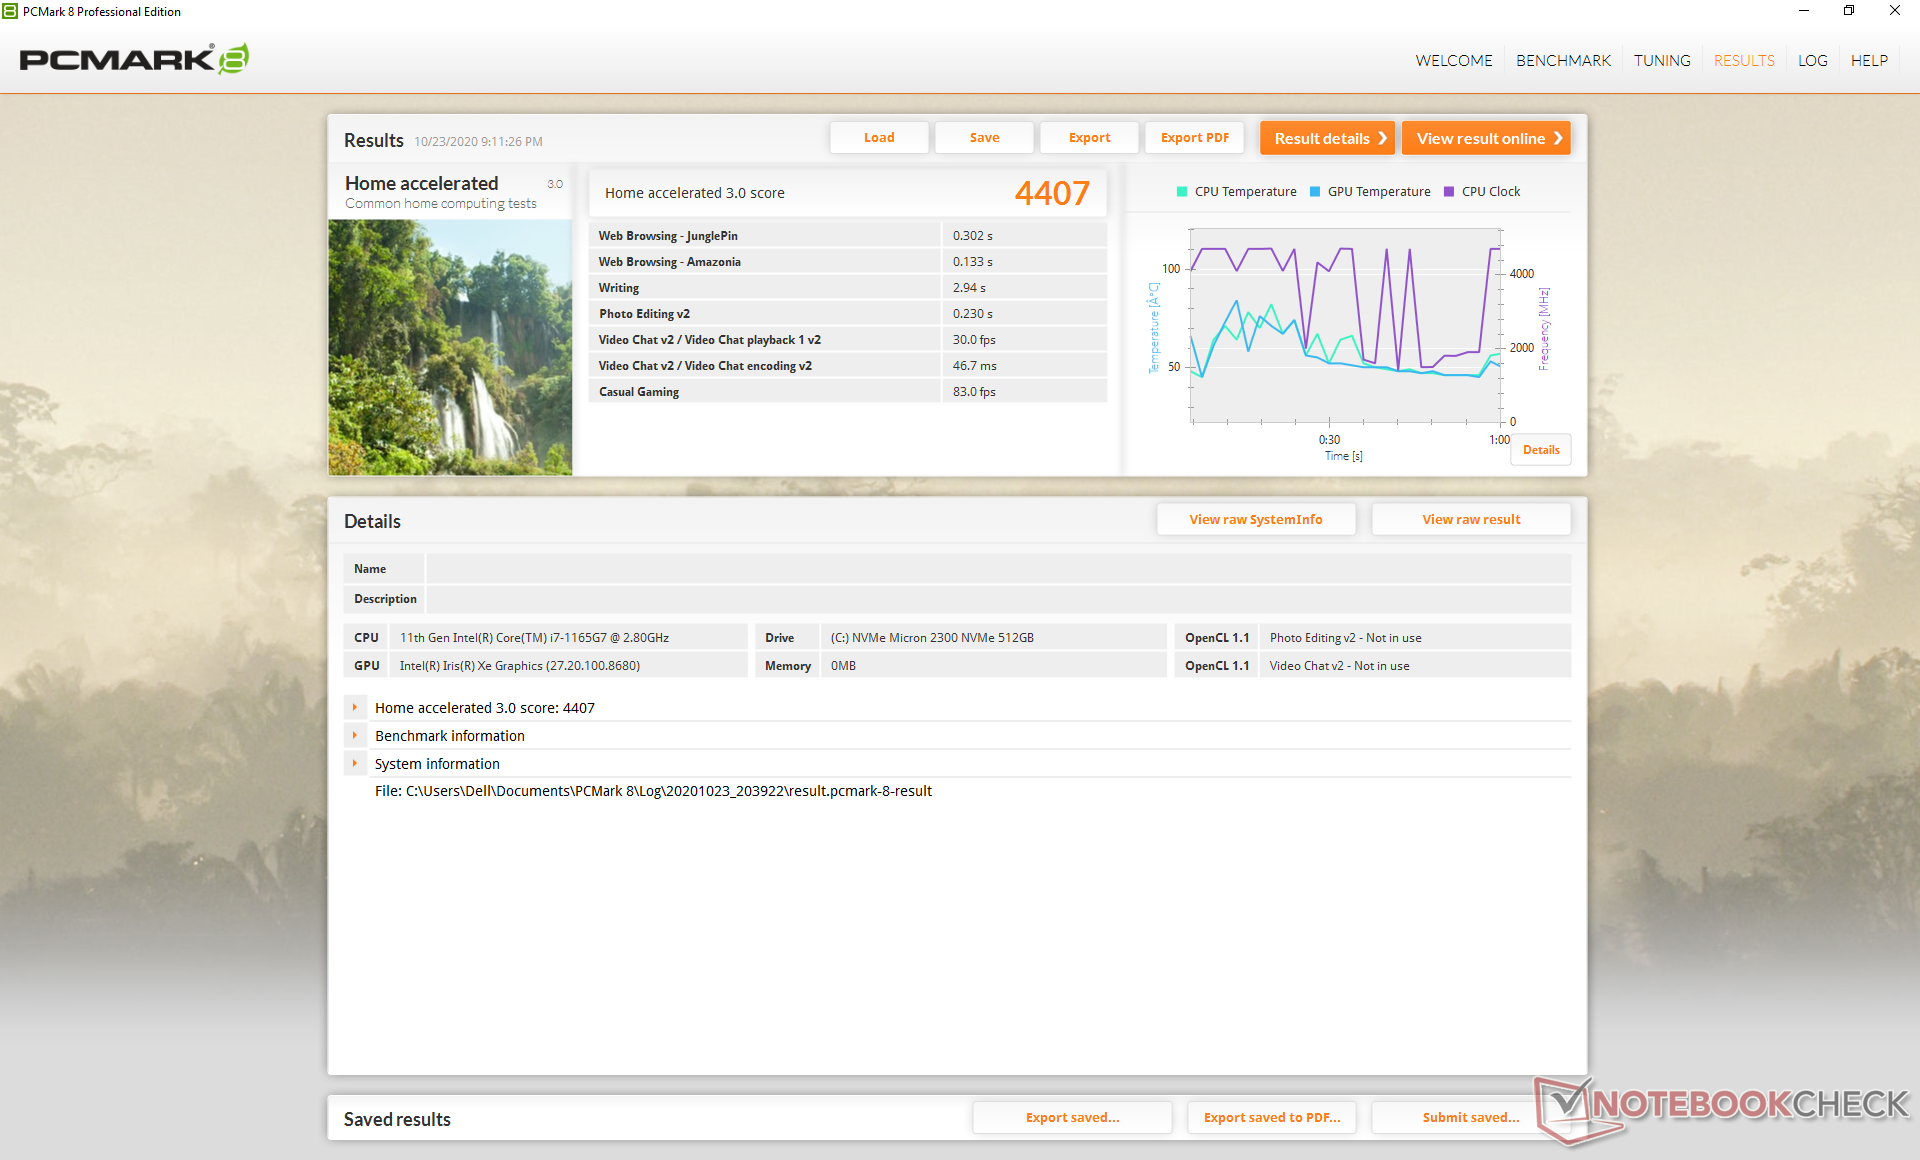
| PCMark 8 Home Score Accelerated v2 | 4407 points | |
| PCMark 8 Work Score Accelerated v2 | 3073 points | |
| PCMark 10 Score | 4914 points | |
Help | ||
DPC Latency
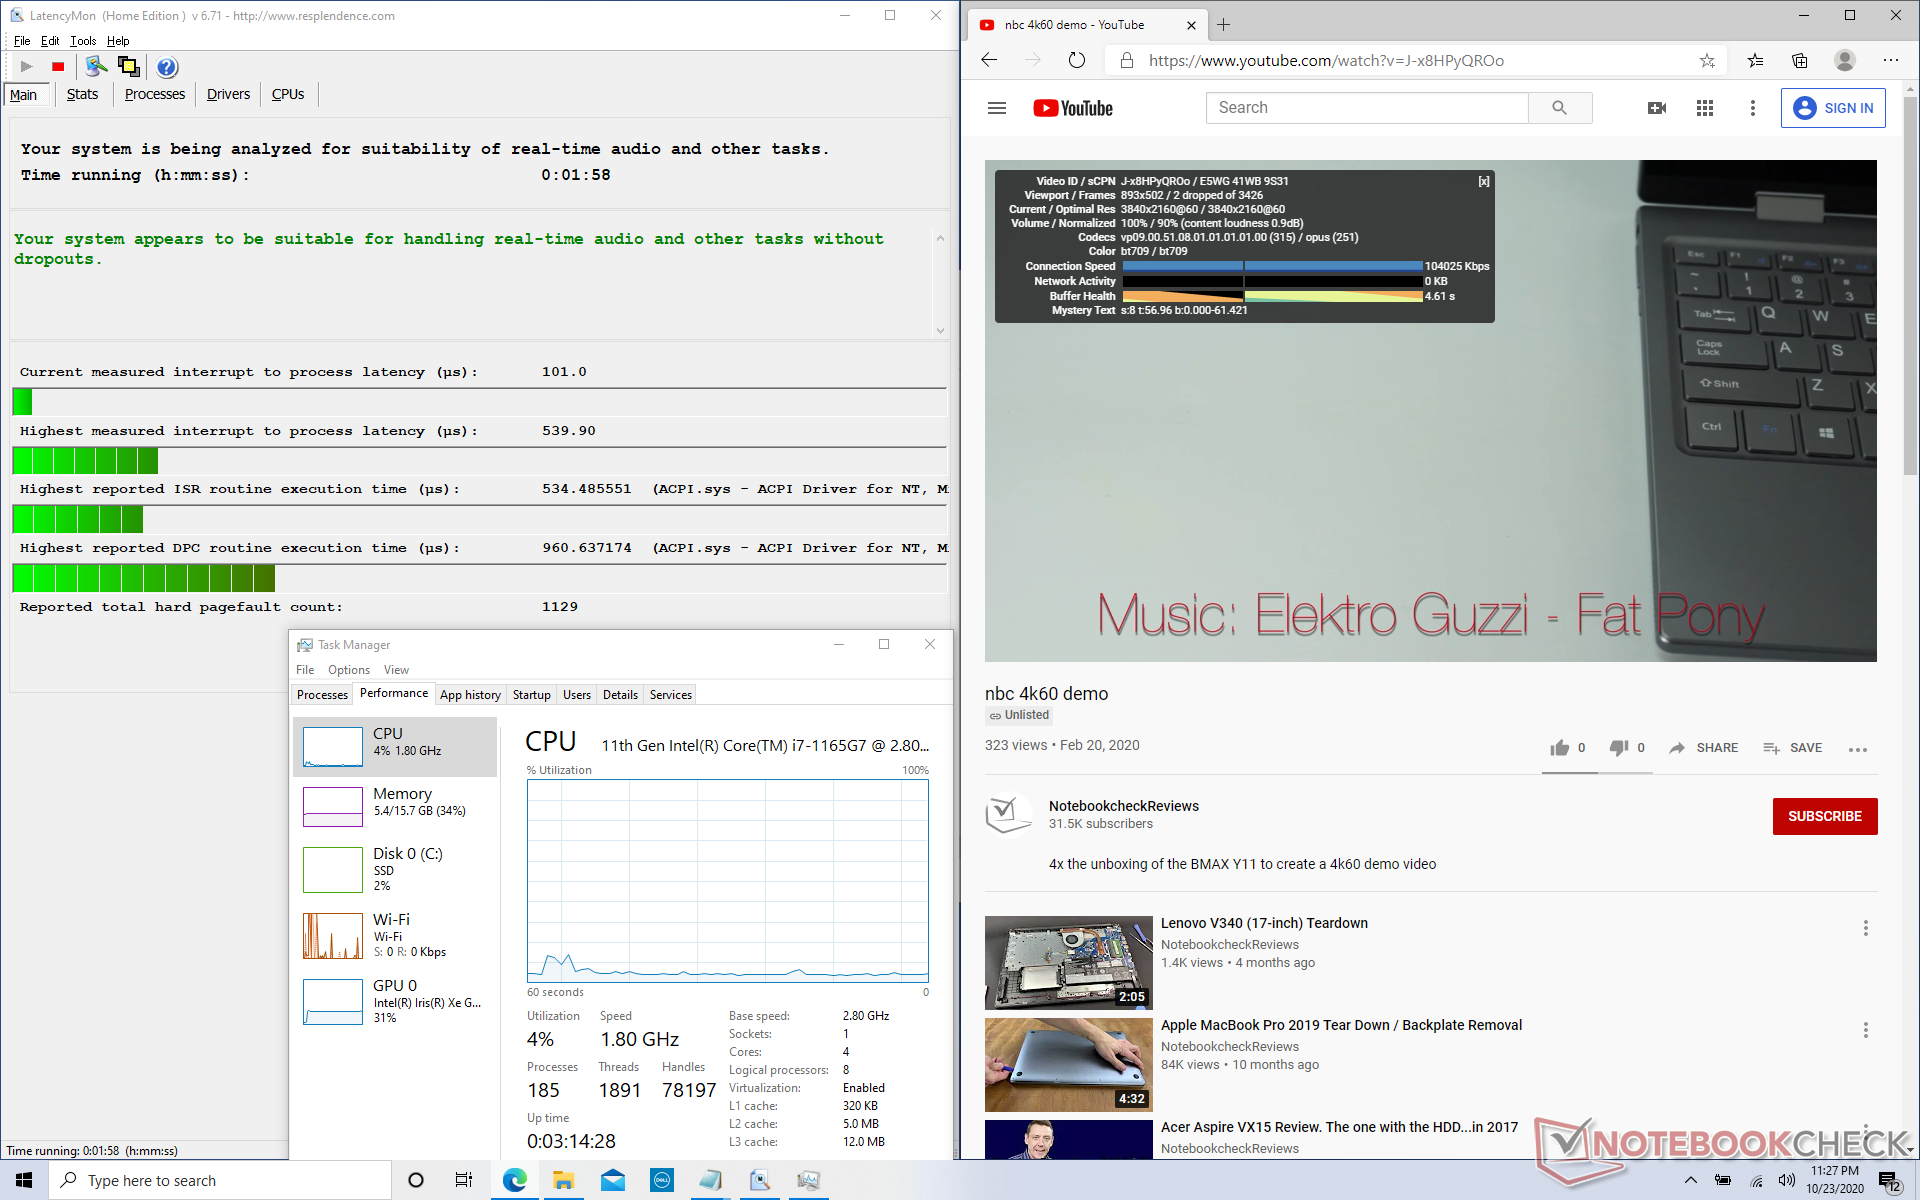
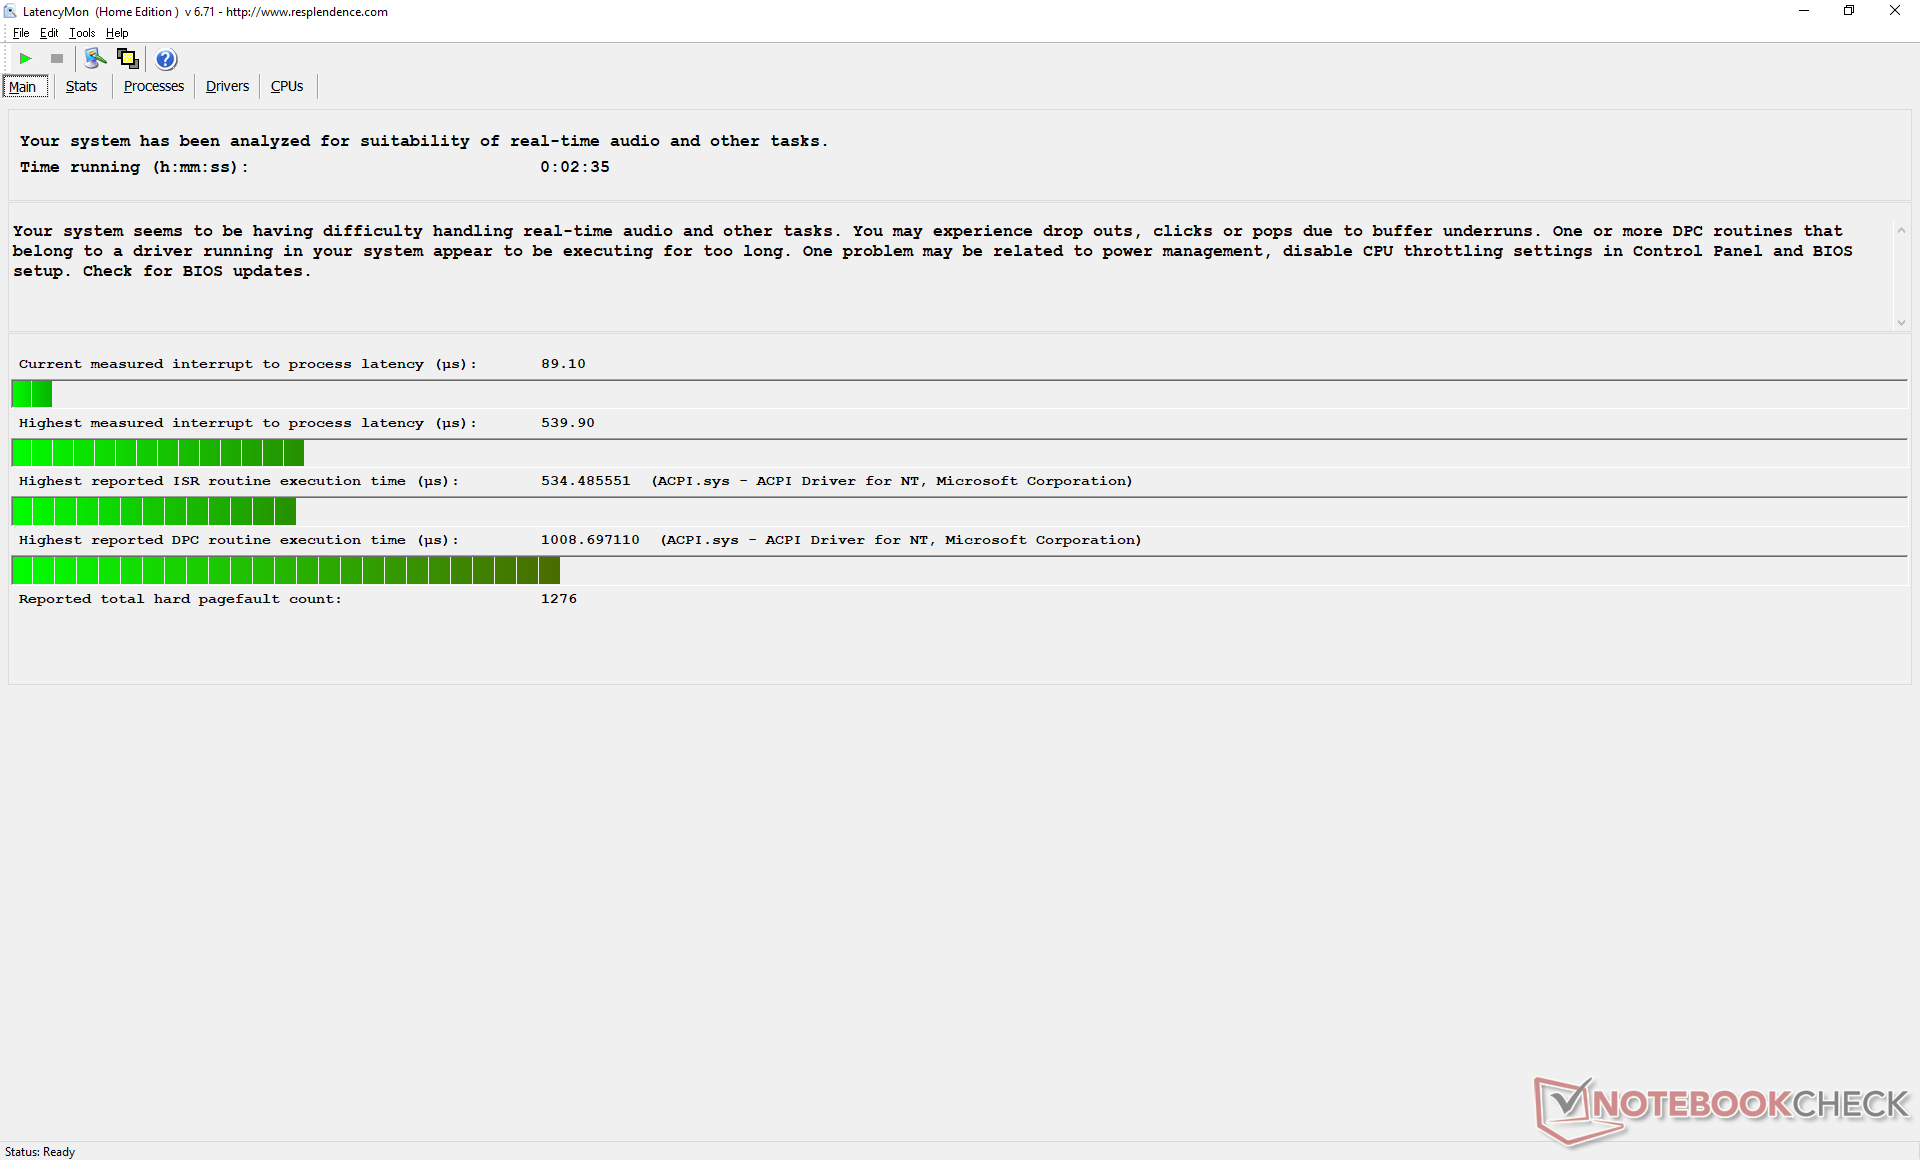
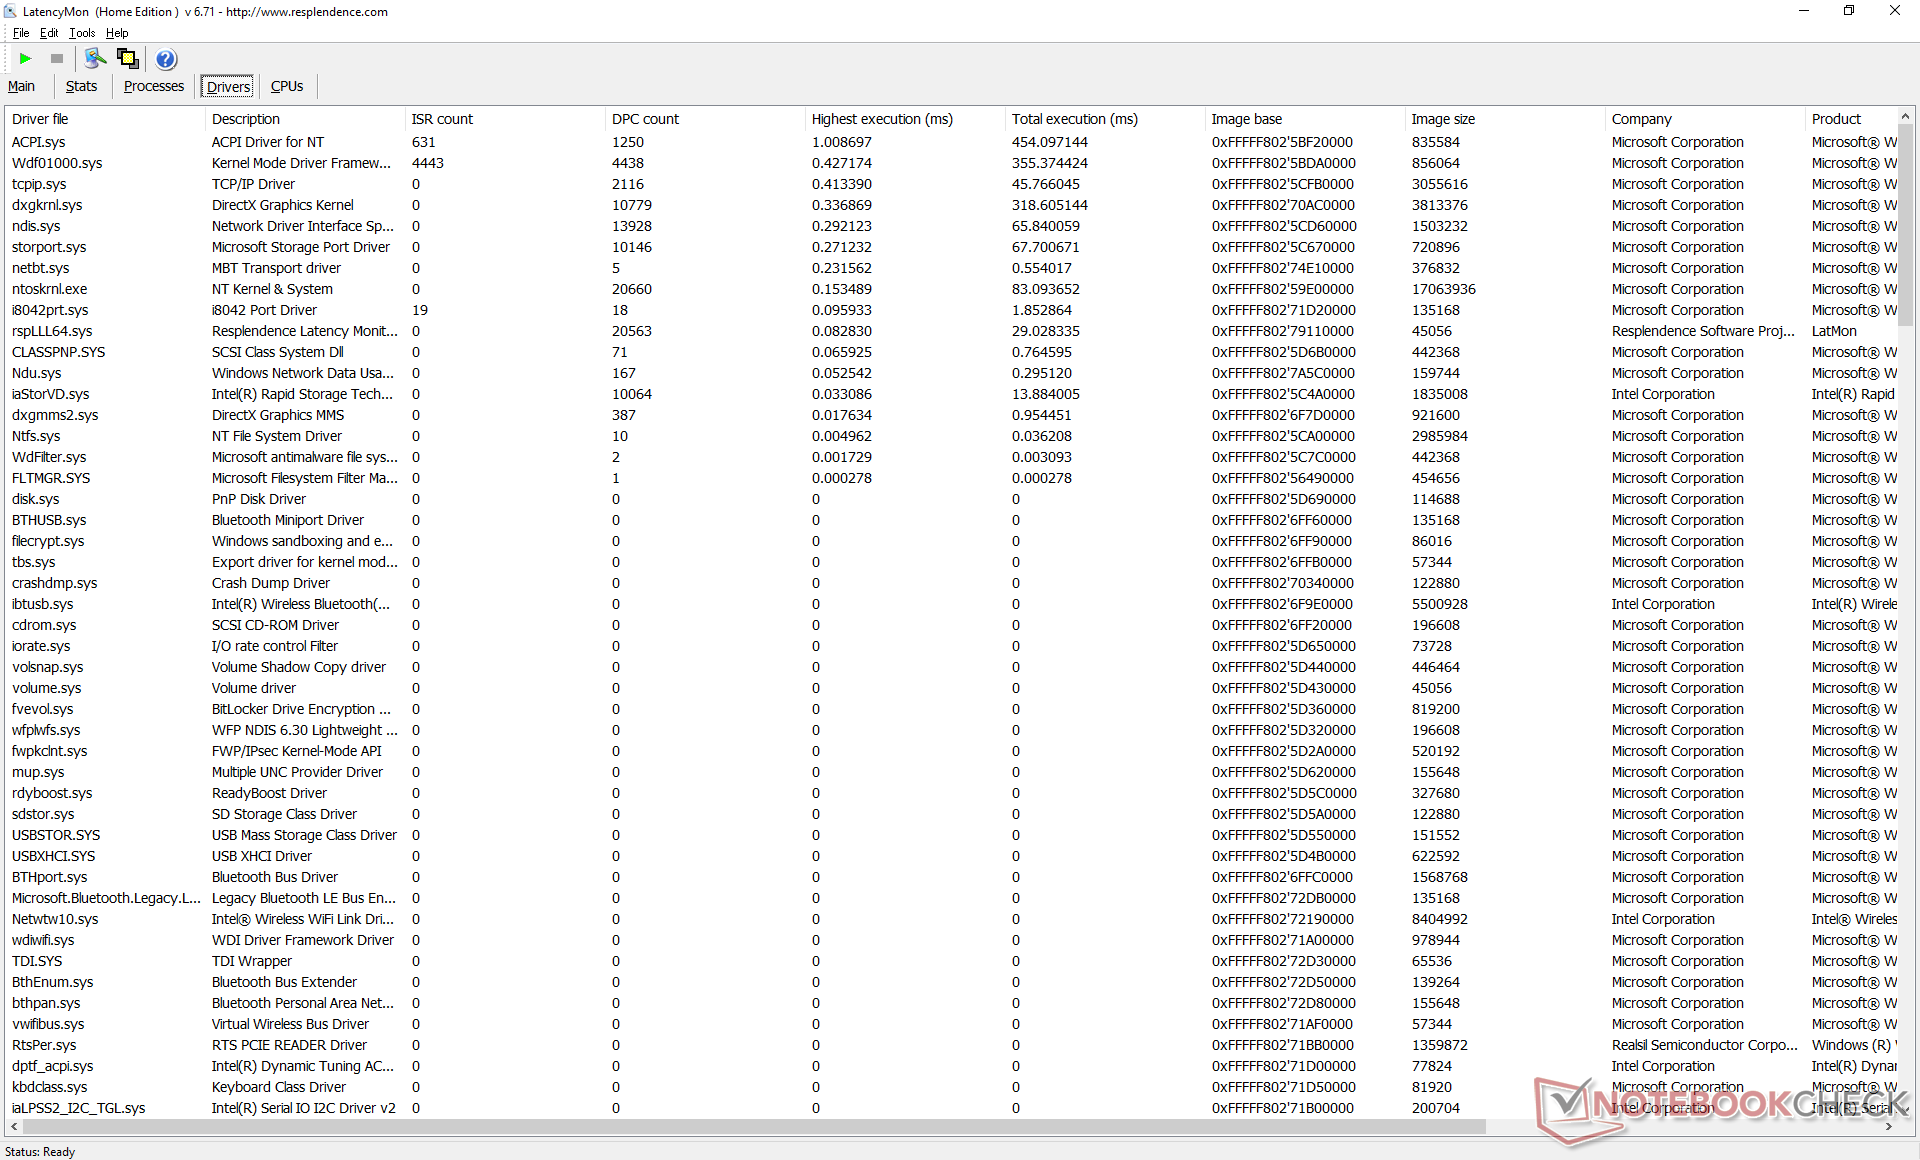
Opening multiple browser tabs on our homepage would not result in any DPC latency issues according to LatencyMon. Initiating Prime95, however, would cause slight latencies. 4K60 playback is smooth with only two dropped frames during our minute-long YouTube test video.
| DPC Latencies / LatencyMon - interrupt to process latency (max), Web, Youtube, Prime95 | |
| Dell XPS 13 9300 Core i7-1065G7 | |
| Lenovo Yoga Slim 7-14ARE | |
| Dell XPS 13 9310 Core i7 FHD | |
* ... smaller is better
Storage Devices
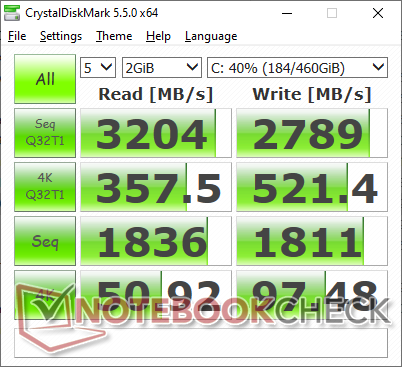
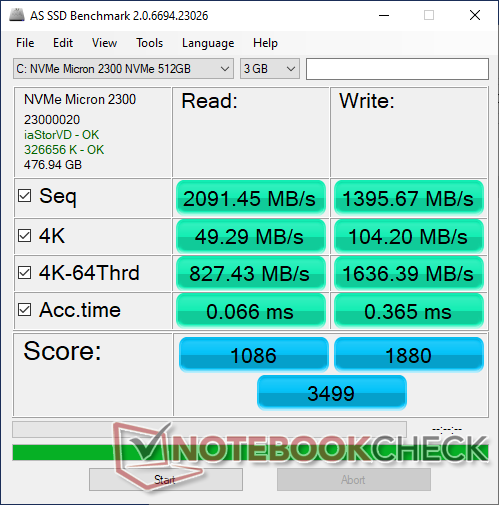
While previous XPS 13 models have shipped with M.2 NVMe SSDs from Samsung, SK Hynix, Intel or Toshiba, our latest unit comes with one from Micron. It's pretty much a roulette as to which SSD you'll be getting when purchasing an XPS 13 at any given time.
Luckily for us, the Micron 2200 is a high-end NVMe drive with sequential read and write rates approaching 3300 MB/s and 2700 MB/s, respectively, to be close to the popular Samsung PM981 series. Still, we wouldn't be surprised if users receive completely different drives if ordering SKUs of different SSD sizes.
More storage benchmarks can be found on our table of SSDs and HDDs here.
| Dell XPS 13 9310 Core i7 FHD Micron 2300 512GB MTFDHBA512TDV | Dell XPS 13 9300 Core i7-1065G7 Intel SSDPEMKF512G8 NVMe SSD | Apple MacBook Pro 13 2020 2GHz i5 10th-Gen Apple SSD SM0512F | Huawei MateBook X Pro 2020 i7 Samsung PM981a MZVLB1T0HBLR | HP Spectre x360 13-aw0013dx Intel Optane Memory H10 with Solid State Storage 32GB + 512GB HBRPEKNX0202A(L/H) | |
|---|---|---|---|---|---|
| AS SSD | -16% | -49% | 48% | -30% | |
| Seq Read | 2091 | 1956 -6% | 1300 -38% | 2737 31% | 1039 -50% |
| Seq Write | 1396 | 1227 -12% | 1518 9% | 2530 81% | 310.1 -78% |
| 4K Read | 49.29 | 63 28% | 14.09 -71% | 54 10% | 76 54% |
| 4K Write | 104.2 | 156.6 50% | 24.25 -77% | 152.5 46% | 118 13% |
| 4K-64 Read | 827 | 475.6 -42% | 725 -12% | 2011 143% | 371.8 -55% |
| 4K-64 Write | 1636 | 539 -67% | 169.6 -90% | 1260 -23% | 469.5 -71% |
| Access Time Read * | 0.066 | 0.042 36% | 0.172 -161% | 0.066 -0% | 0.067 -2% |
| Access Time Write * | 0.365 | 0.105 71% | 0.155 58% | 0.024 93% | 0.138 62% |
| Score Read | 1086 | 734 -32% | 869 -20% | 2339 115% | 552 -49% |
| Score Write | 1880 | 818 -56% | 346 -82% | 1666 -11% | 618 -67% |
| Score Total | 3499 | 1915 -45% | 1667 -52% | 5191 48% | 1448 -59% |
| Copy ISO MB/s | 1544 | 1022 -34% | 764 -51% | ||
| Copy Program MB/s | 613 | 302.8 -51% | 465.8 -24% | ||
| Copy Game MB/s | 1451 | 491.4 -66% | 764 -47% | ||
| CrystalDiskMark 5.2 / 6 | 15% | -31% | 14% | -7% | |
| Write 4K | 97.5 | 186.8 92% | 28.16 -71% | 165.6 70% | 112.6 15% |
| Read 4K | 50.9 | 71.4 40% | 17.5 -66% | 50.2 -1% | 131 157% |
| Write Seq | 1811 | 1203 -34% | 1195 -34% | 1905 5% | 458.9 -75% |
| Read Seq | 1836 | 2600 42% | 1470 -20% | 1669 -9% | 1355 -26% |
| Write 4K Q32T1 | 521 | 514 -1% | 205 -61% | 474.6 -9% | 341.3 -34% |
| Read 4K Q32T1 | 357.5 | 570 59% | 692 94% | 508 42% | 320.6 -10% |
| Write Seq Q32T1 | 2879 | 786 -73% | 1475 -49% | 3007 4% | 1219 -58% |
| Read Seq Q32T1 | 3204 | 2947 -8% | 1920 -40% | 3556 11% | 2462 -23% |
| Total Average (Program / Settings) | -1% /
-5% | -40% /
-41% | 31% /
34% | -19% /
-22% |
* ... smaller is better

Disk Throttling: DiskSpd Read Loop, Queue Depth 8
GPU Performance
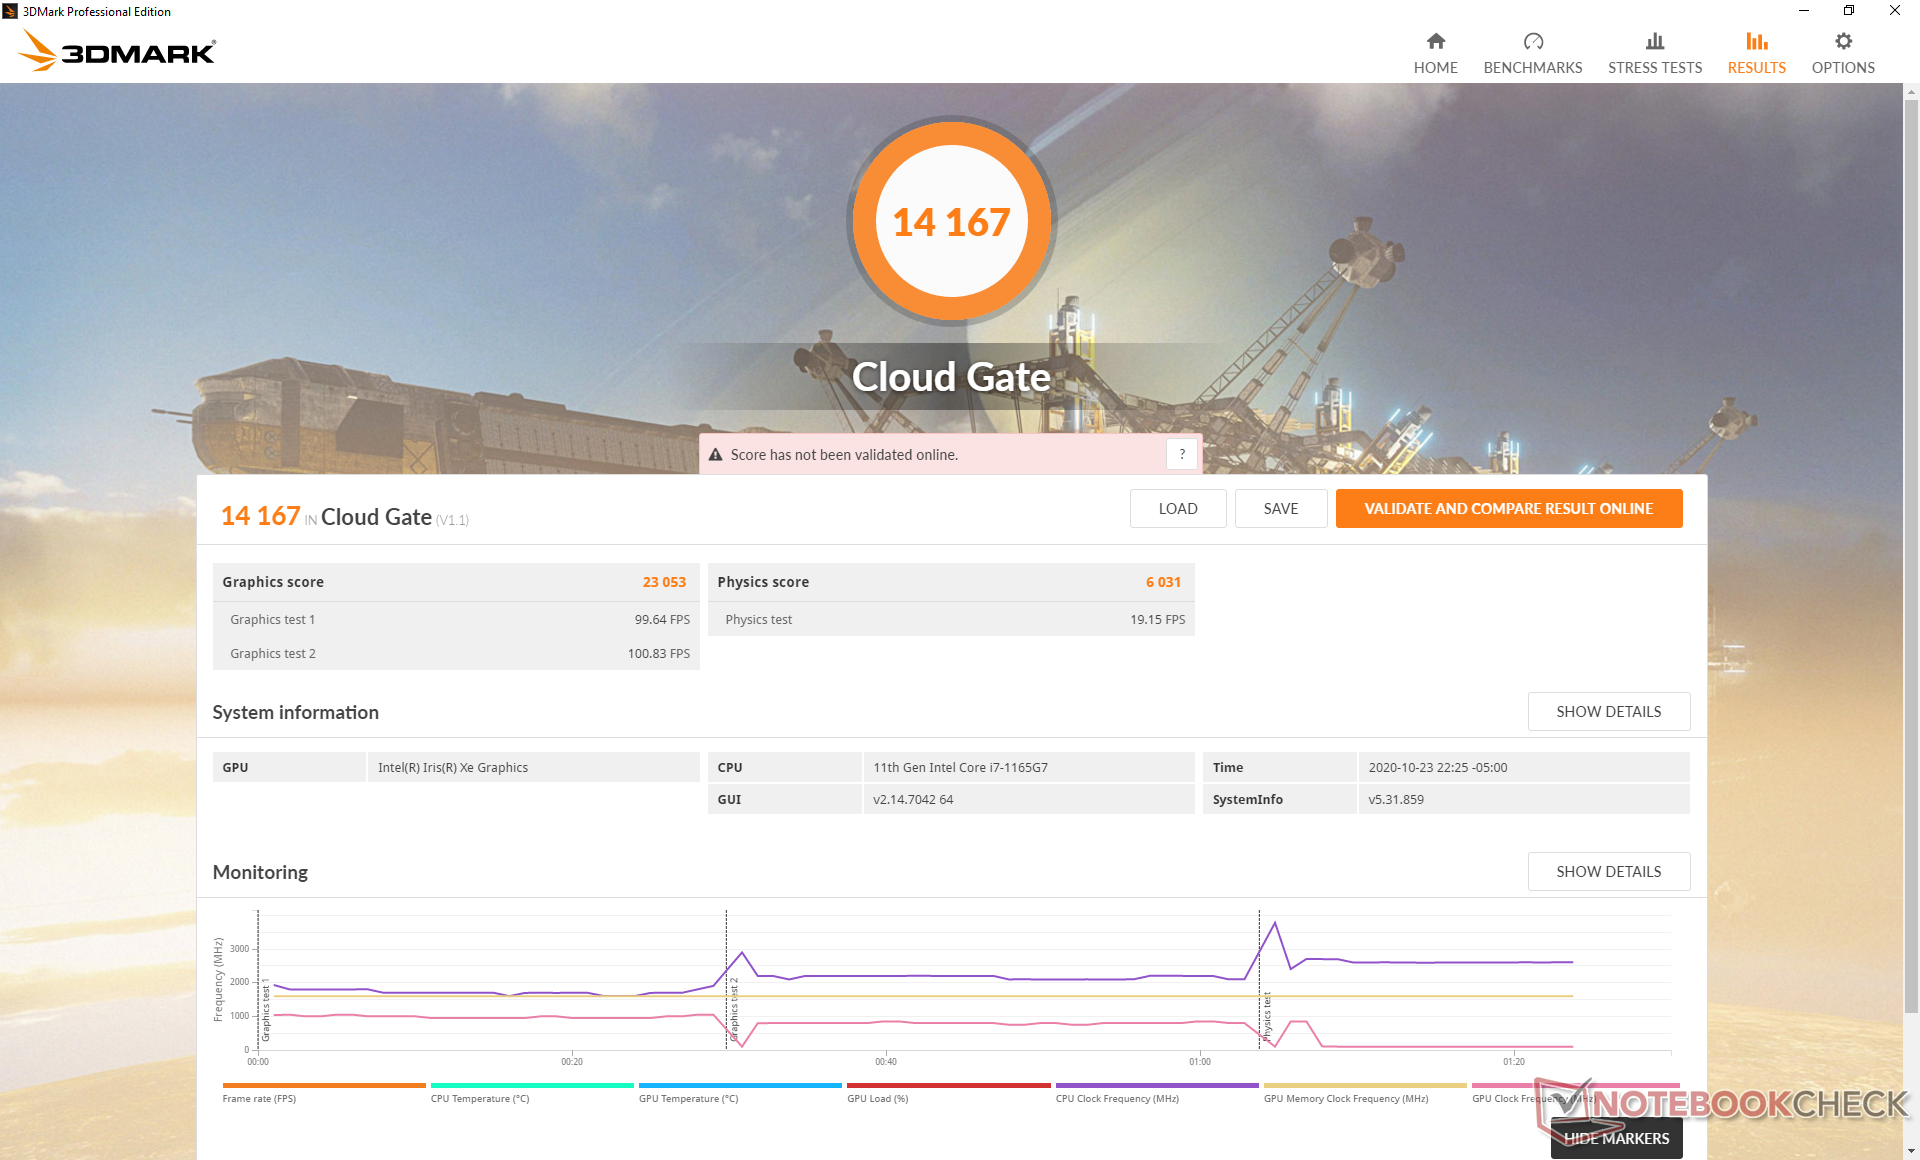
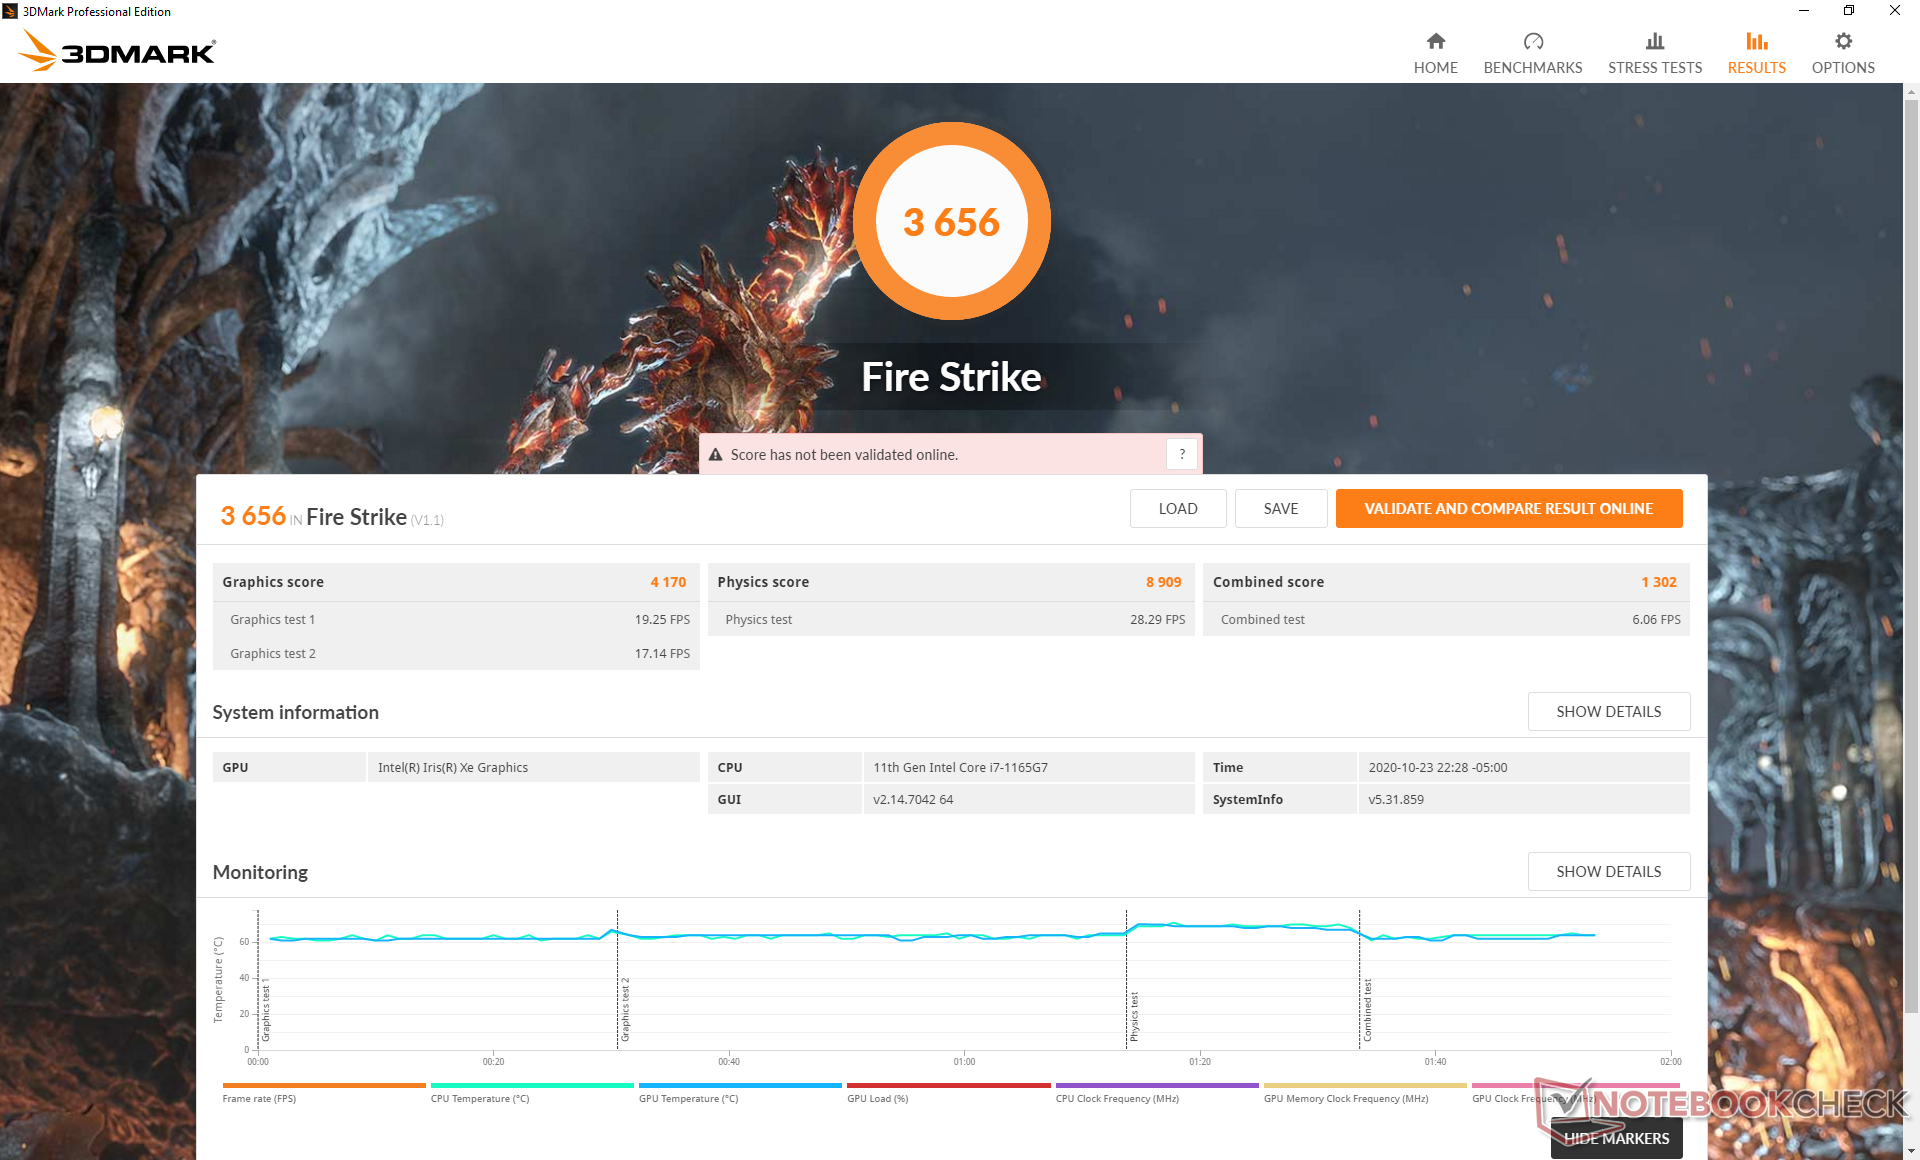
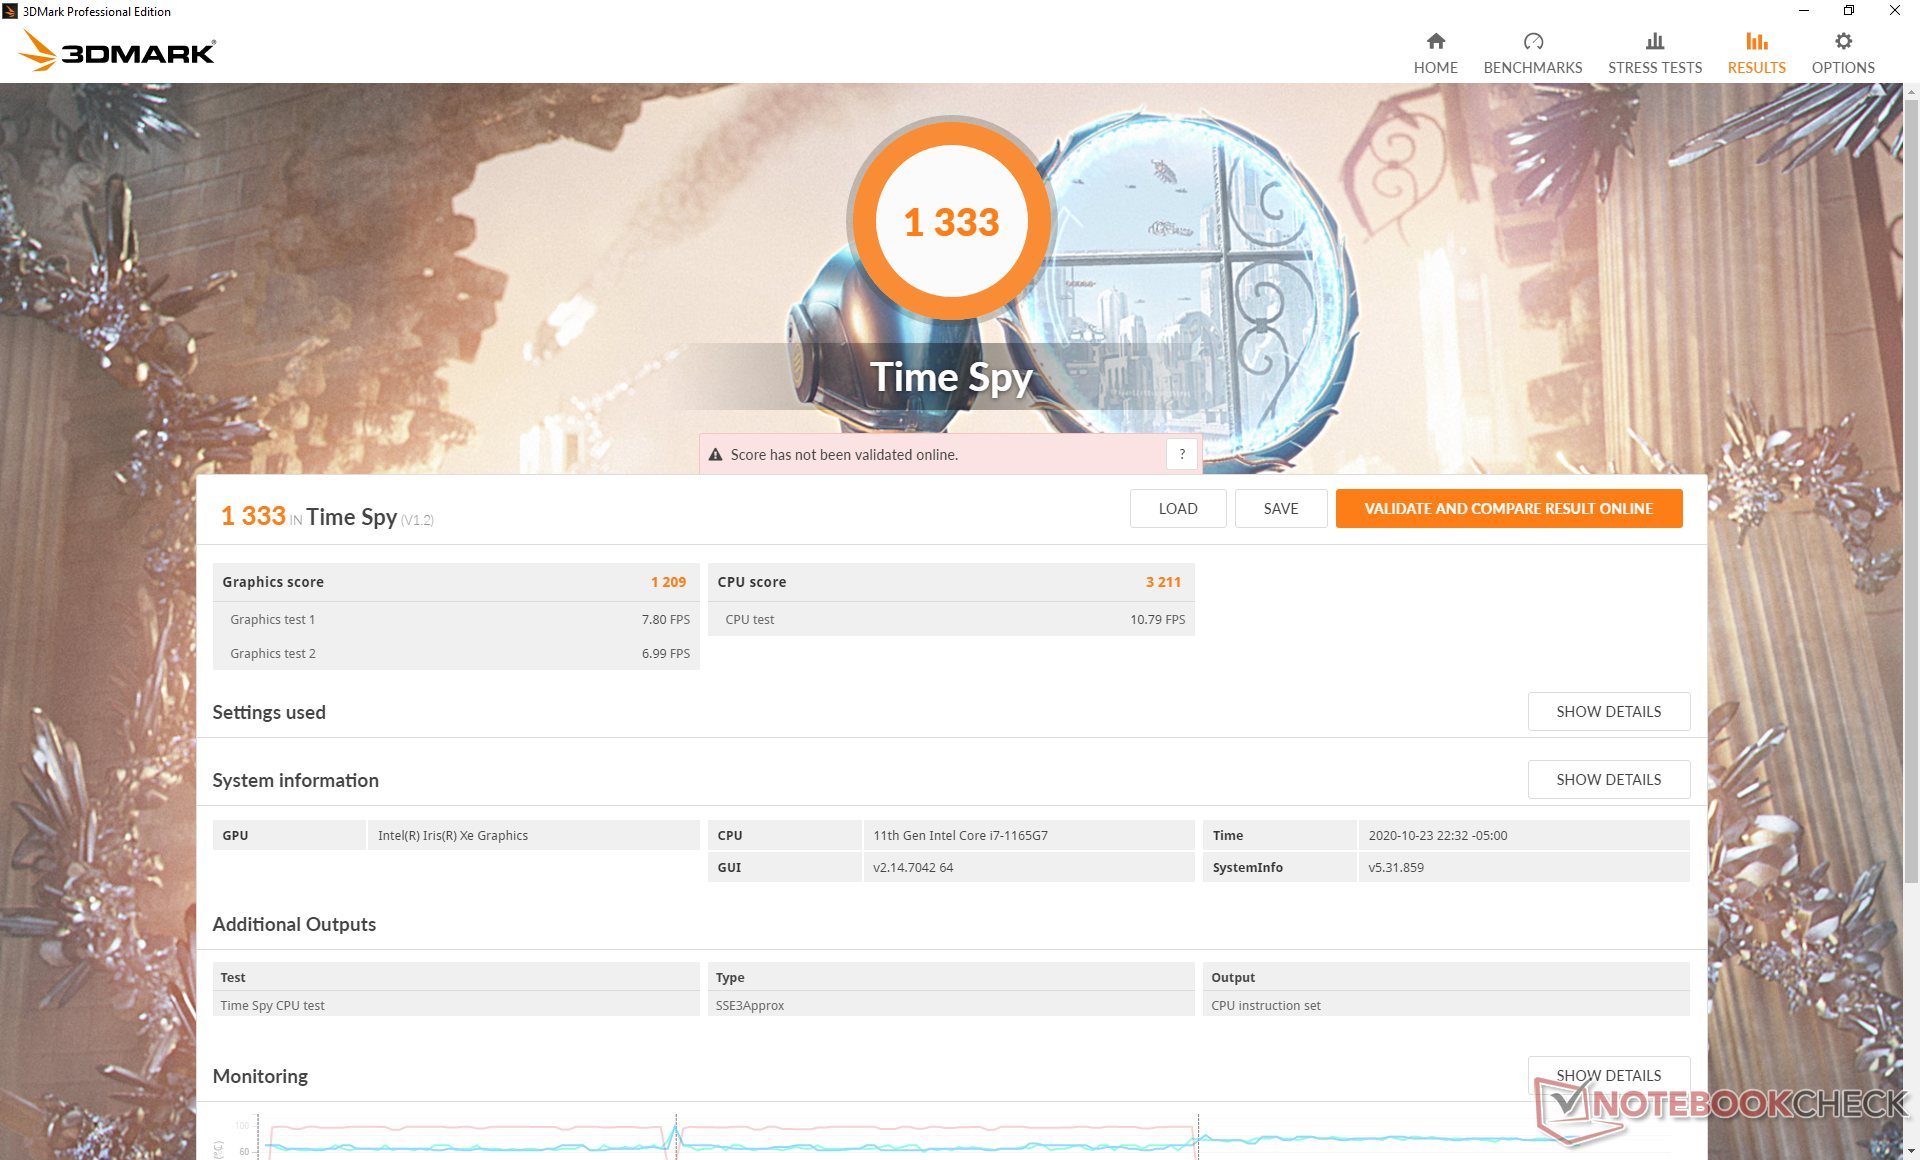
3DMark results are impressive for an integrated GPU with scores that are 30 to 35 percent higher than even the discrete GeForce MX250 or almost 50 percent higher than the Iris Plus G7 in the XPS 13 9300. As we've already proven, however, these synthetic results don't translate well to real-world gaming performance and so users shouldn't expect 30 to 35 percent faster frame rates across the board than a GeForce MX250 laptop. Final Fantasy 15, Strange Brigade, and Witcher 3, for example, run faster on our XPS 13 9310 than on the MX250-powered ZenBook 14 while the opposite is true for DOTA 2 Reborn, X-Plane 11.11, and GTA V.
Note that Dell's Dynamic Tuning has an adverse affect on frame rates. When idling on Witcher 3 at the lowest settings, for example, frame rates would fluctuate between 61 and 80 FPS as shown by our graph below whereas frame rates would be more constant and stable on most other laptops.
See our page on the Intel Iris Xe for more technical information and benchmark comparisons. We expect overall gaming performance to improve over time with driver updates.
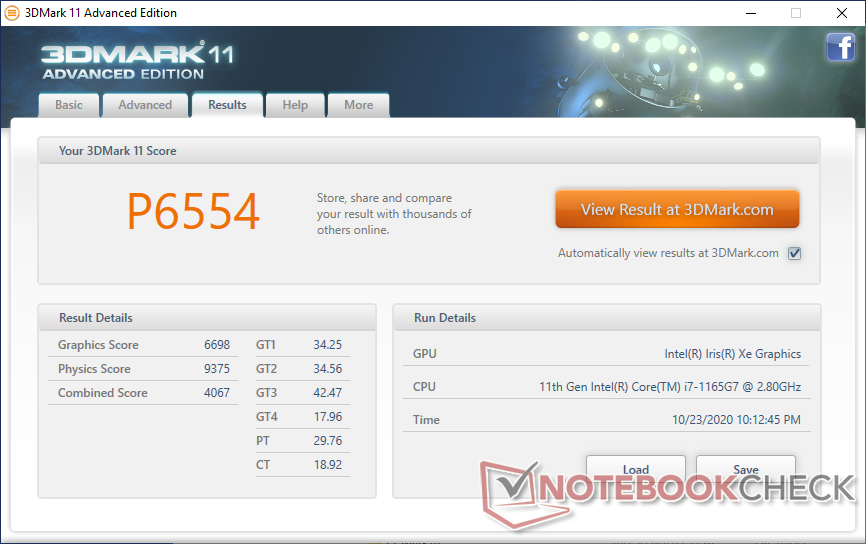
| 3DMark 11 Performance | 6554 points | |
| 3DMark Cloud Gate Standard Score | 14167 points | |
| 3DMark Fire Strike Score | 3656 points | |
| 3DMark Time Spy Score | 1333 points | |
Help | ||
| low | med. | high | ultra | |
| GTA V (2015) | 84.3 | 76.8 | 24.7 | 10.5 |
| The Witcher 3 (2015) | 97.7 | 58.4 | 32.7 | 14.3 |
| Dota 2 Reborn (2015) | 77.5 | 54.3 | 40.5 | 42.5 |
| Final Fantasy XV Benchmark (2018) | 33.7 | 19.6 | 15.4 | |
| X-Plane 11.11 (2018) | 48 | 37.3 | 32.5 | |
| Strange Brigade (2018) | 94.4 | 38.5 | 30.4 | 24 |
Emissions
System Noise
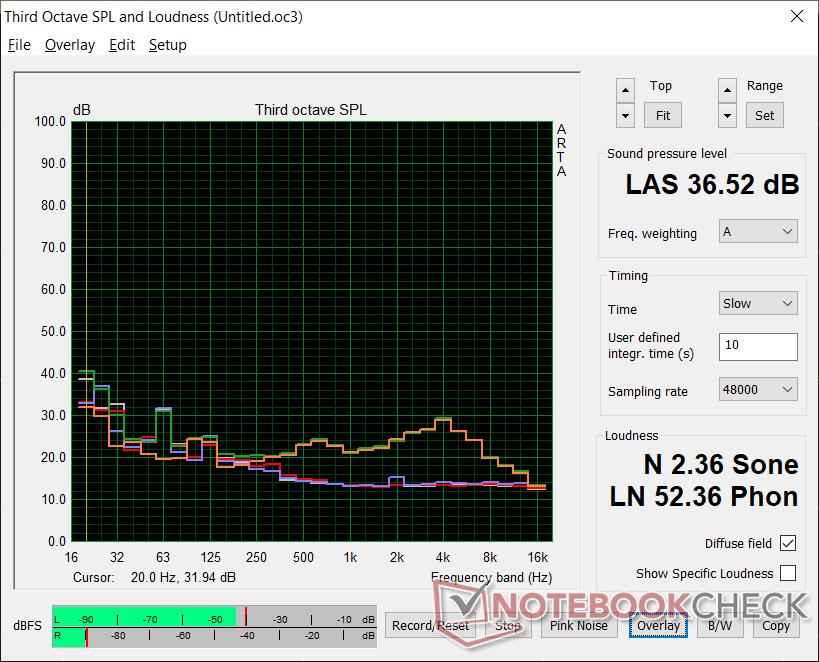
Fan noise characteristics are largely the same when compared to the XPS 9300. Most importantly, fan RPMs are constant despite the ever-changing CPU clock rates when under high loads. The system is able to remain almost completely silent even throughout the entire first 90-second benchmark scene of 3DMark 06.
| Dell XPS 13 9310 Core i7 FHD Iris Xe G7 96EUs, i7-1165G7, Micron 2300 512GB MTFDHBA512TDV | Dell XPS 13 9300 Core i7-1065G7 Iris Plus Graphics G7 (Ice Lake 64 EU), i7-1065G7, Intel SSDPEMKF512G8 NVMe SSD | Apple MacBook Pro 13 2020 2GHz i5 10th-Gen Iris Plus Graphics G7 (Ice Lake 64 EU), i5-1038NG7, Apple SSD SM0512F | Huawei MateBook X Pro 2020 i7 GeForce MX250, i7-10510U, Samsung PM981a MZVLB1T0HBLR | Lenovo Yoga Slim 7-14ARE Vega 8, R7 4800U, Samsung SSD PM981a MZVLB512HBJQ | |
|---|---|---|---|---|---|
| Noise | -11% | -15% | -16% | -4% | |
| off / environment * | 25.7 | 28.3 -10% | 29.6 -15% | 29.6 -15% | 26.3 -2% |
| Idle Minimum * | 25.7 | 28.3 -10% | 29.6 -15% | 29.6 -15% | 26.5 -3% |
| Idle Average * | 25.7 | 28.3 -10% | 29.6 -15% | 29.6 -15% | 26.5 -3% |
| Idle Maximum * | 25.9 | 28.3 -9% | 29.6 -14% | 30.3 -17% | 26.5 -2% |
| Load Average * | 26.2 | 32.5 -24% | 34.4 -31% | 38 -45% | 31.8 -21% |
| Witcher 3 ultra * | 36.5 | 39.3 -8% | 36.1 1% | 38 -4% | 35.9 2% |
| Load Maximum * | 36.6 | 39.3 -7% | 42.1 -15% | 38 -4% | 35.9 2% |
* ... smaller is better
Noise Level
| Idle |
| 25.7 / 25.7 / 25.9 dB(A) |
| Load |
| 26.2 / 36.6 dB(A) |
 | ||
30 dB silent 40 dB(A) audible 50 dB(A) loud |
||
min: | ||
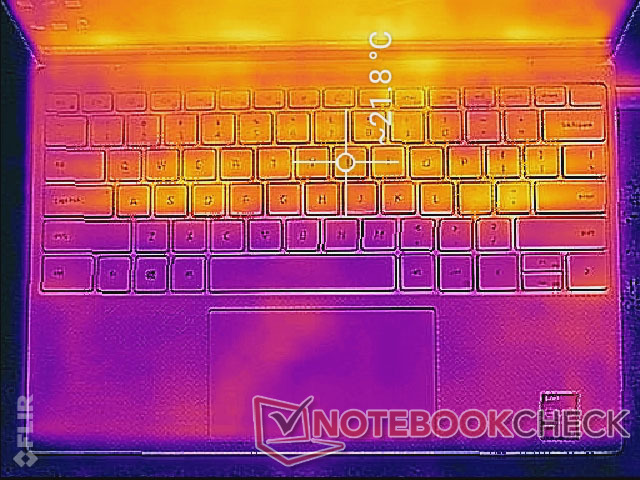
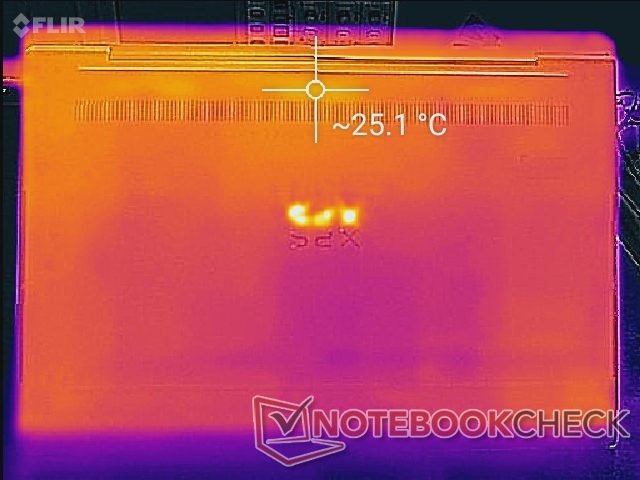
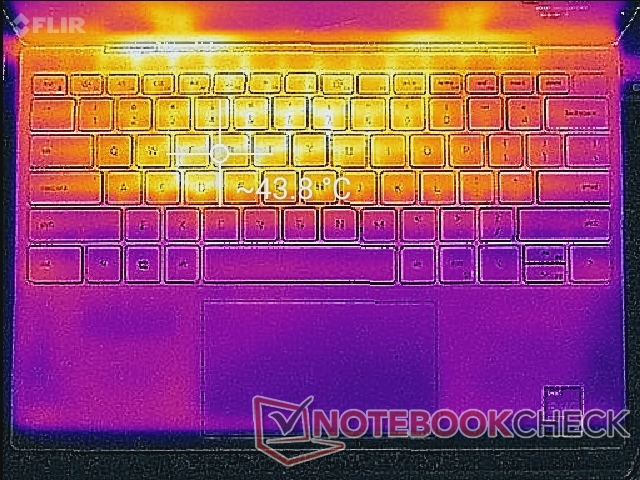
Temperature
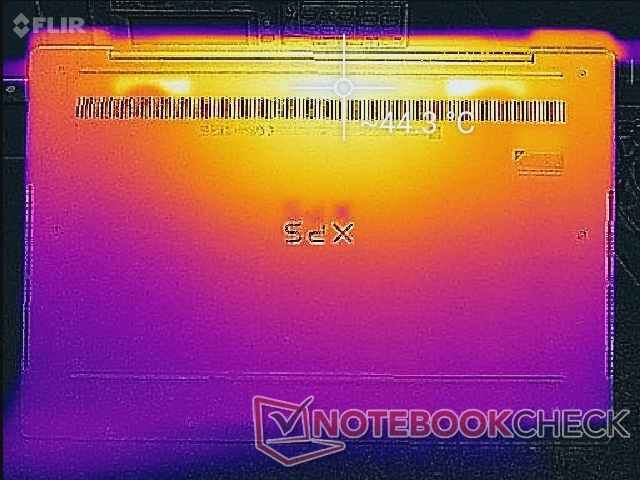
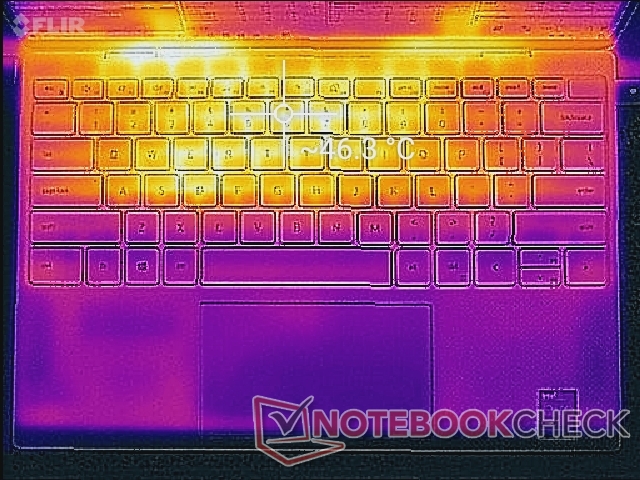
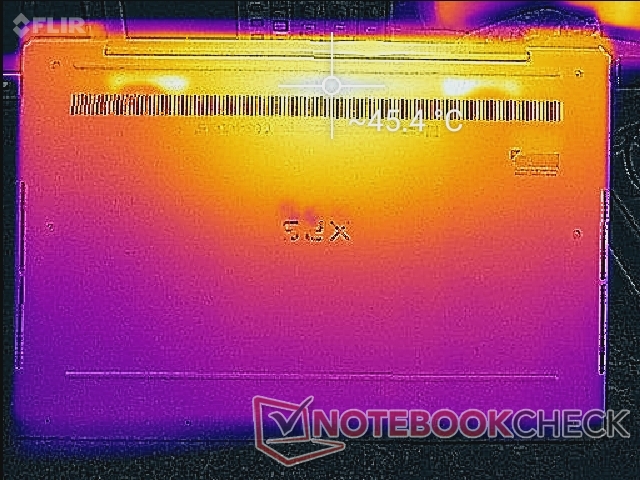
Surface temperatures are almost identical to last year's XPS 13 9300 despite the jump to a newer generation processor with faster integrated graphics. Unlike most cheaper Ultrabooks that have only one internal fan, the Dell integrates two for a more symmetrical temperature profile.
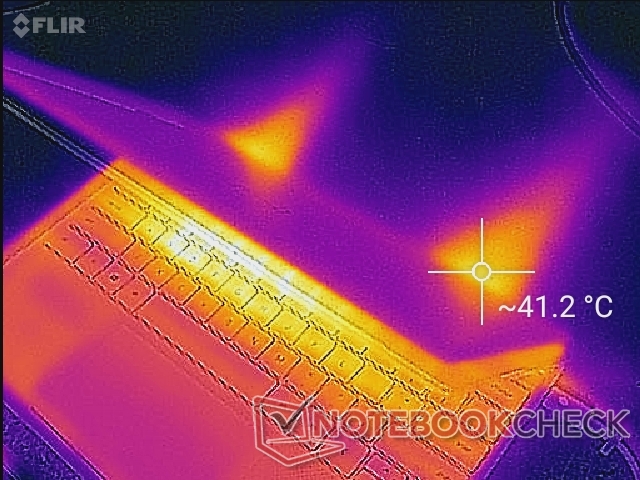
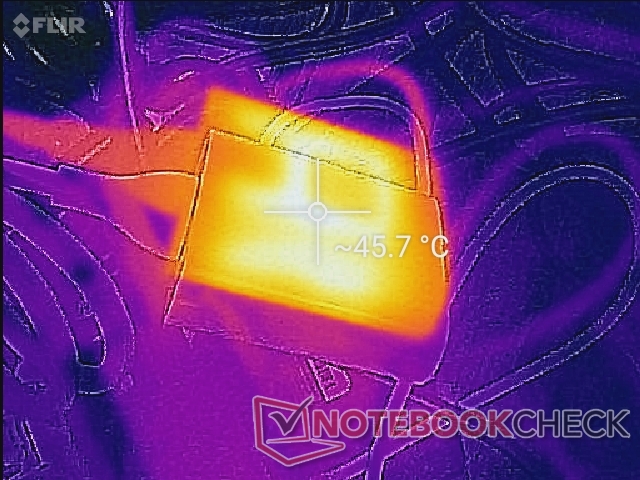
(-) The maximum temperature on the upper side is 46.2 °C / 115 F, compared to the average of 35.9 °C / 97 F, ranging from 21.4 to 59 °C for the class Subnotebook.
(-) The bottom heats up to a maximum of 46 °C / 115 F, compared to the average of 39.4 °C / 103 F
(+) In idle usage, the average temperature for the upper side is 20.7 °C / 69 F, compared to the device average of 30.7 °C / 87 F.
(±) Playing The Witcher 3, the average temperature for the upper side is 34.2 °C / 94 F, compared to the device average of 30.7 °C / 87 F.
(+) The palmrests and touchpad are reaching skin temperature as a maximum (32 °C / 89.6 F) and are therefore not hot.
(-) The average temperature of the palmrest area of similar devices was 28.3 °C / 82.9 F (-3.7 °C / -6.7 F).
Stress Test
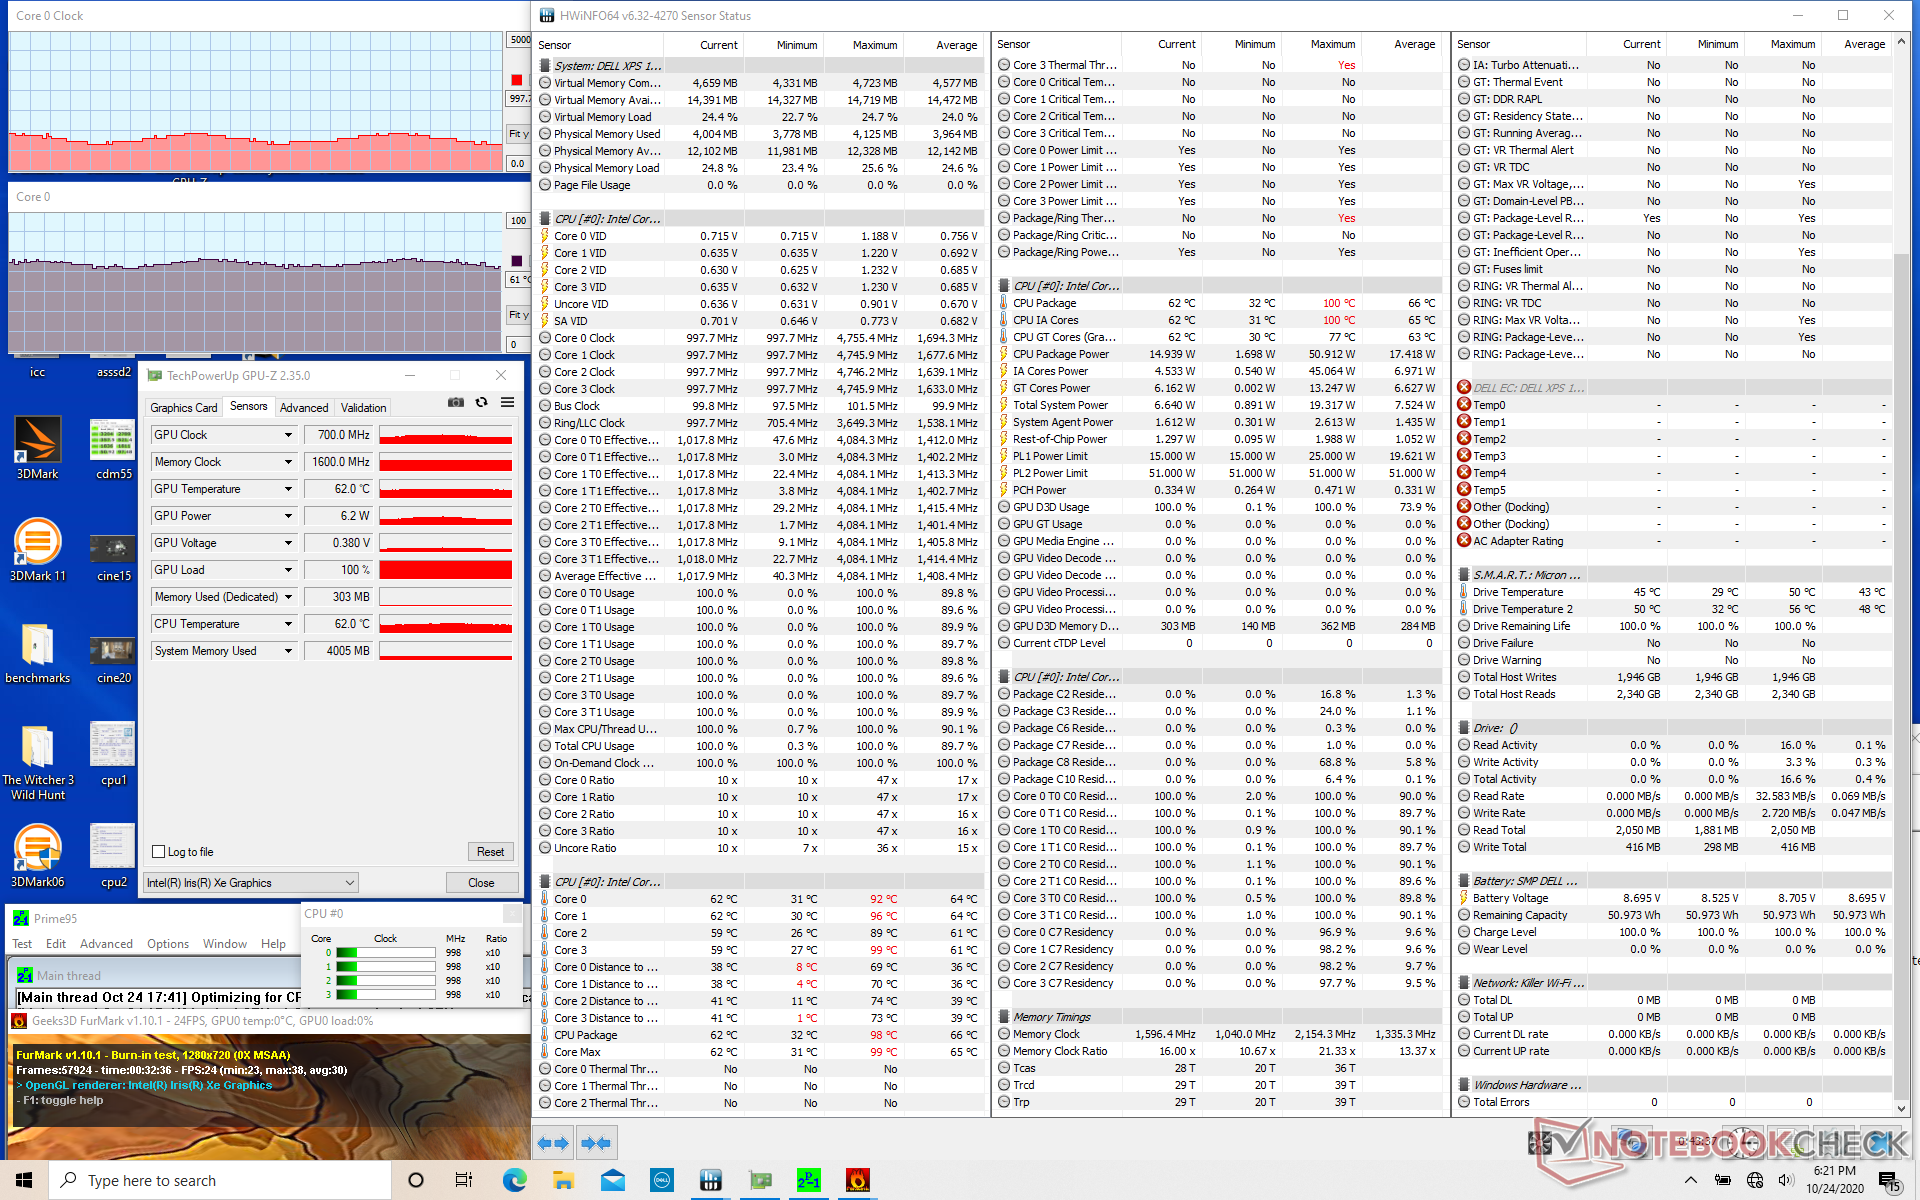
Running Prime95 reveals why our recorded CineBench scores and frame rates above are unsteady. Clock rates would first boost to 4.1 GHz during the first few seconds of testing, but then it would start cycling between 1.9 GHz to 3.1 GHz and 71 C to 78 C, respectively, compared to a flat 2.3 GHz and 68 C on the Asus ZenBook 14 UX425 with the same Core i7-1165G7 processor. In other words, Dell's Dynamic Tuning allows for faster performance on average at the cost of consistent clock rates and temperatures. This approach may be useful when running CPU-heavy tasks, but it can be a nightmare scenario for games .
As an example, running Witcher 3 on low settings would result in cycling CPU and GPU clock rates between 1.4 GHz to 2.0 GHz and 850 MHz to 1100 MHz, respectively, for uneven frame rates. Engaging v-sync may alleviate the uneven frame pacing depending on the game and settings.
Running on battery power will impact graphics performance more than CPU performance. A 3DMark 11 test on batteries would return Physics and Graphics scores of 10904 and 6093 points, respectively, compared to 9375 and 6698 points when on mains.
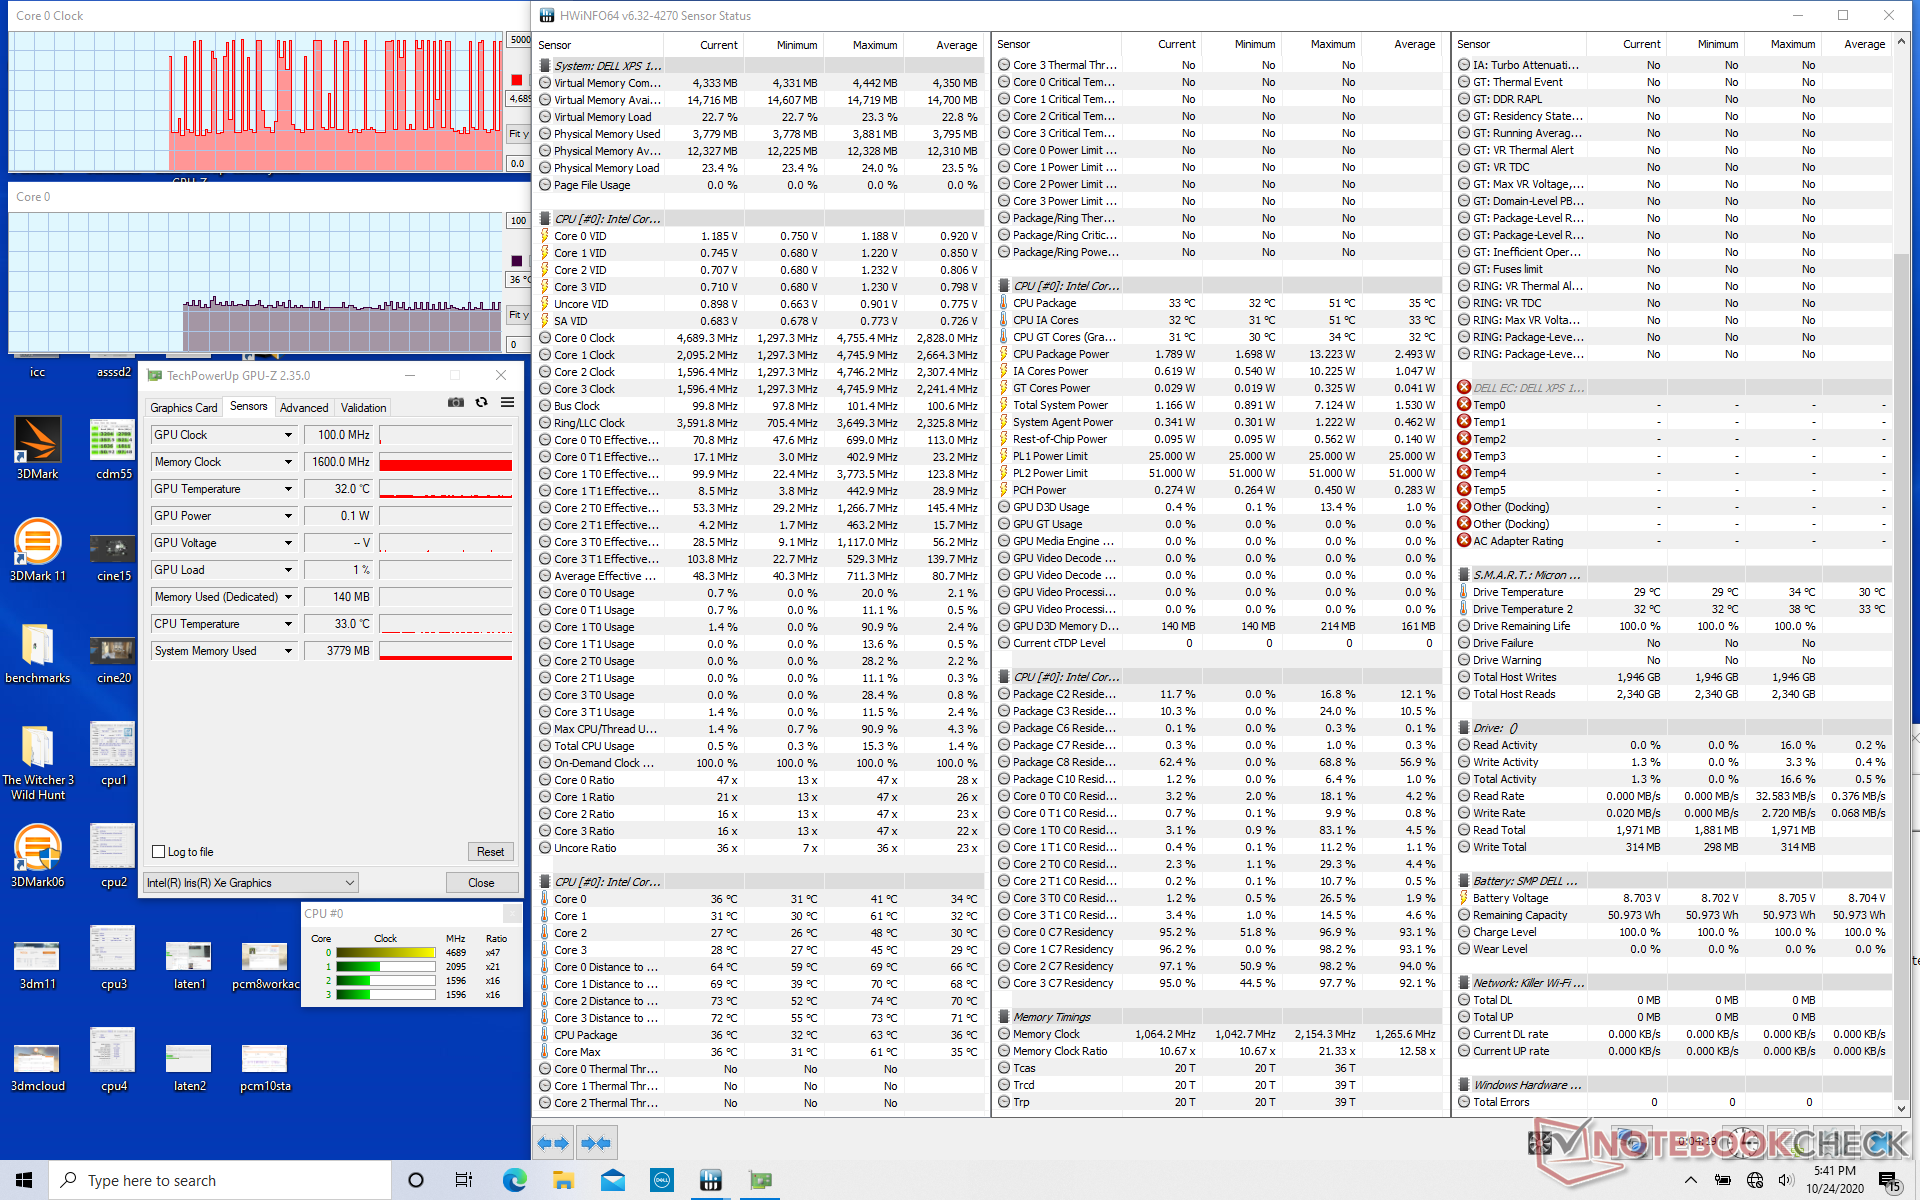
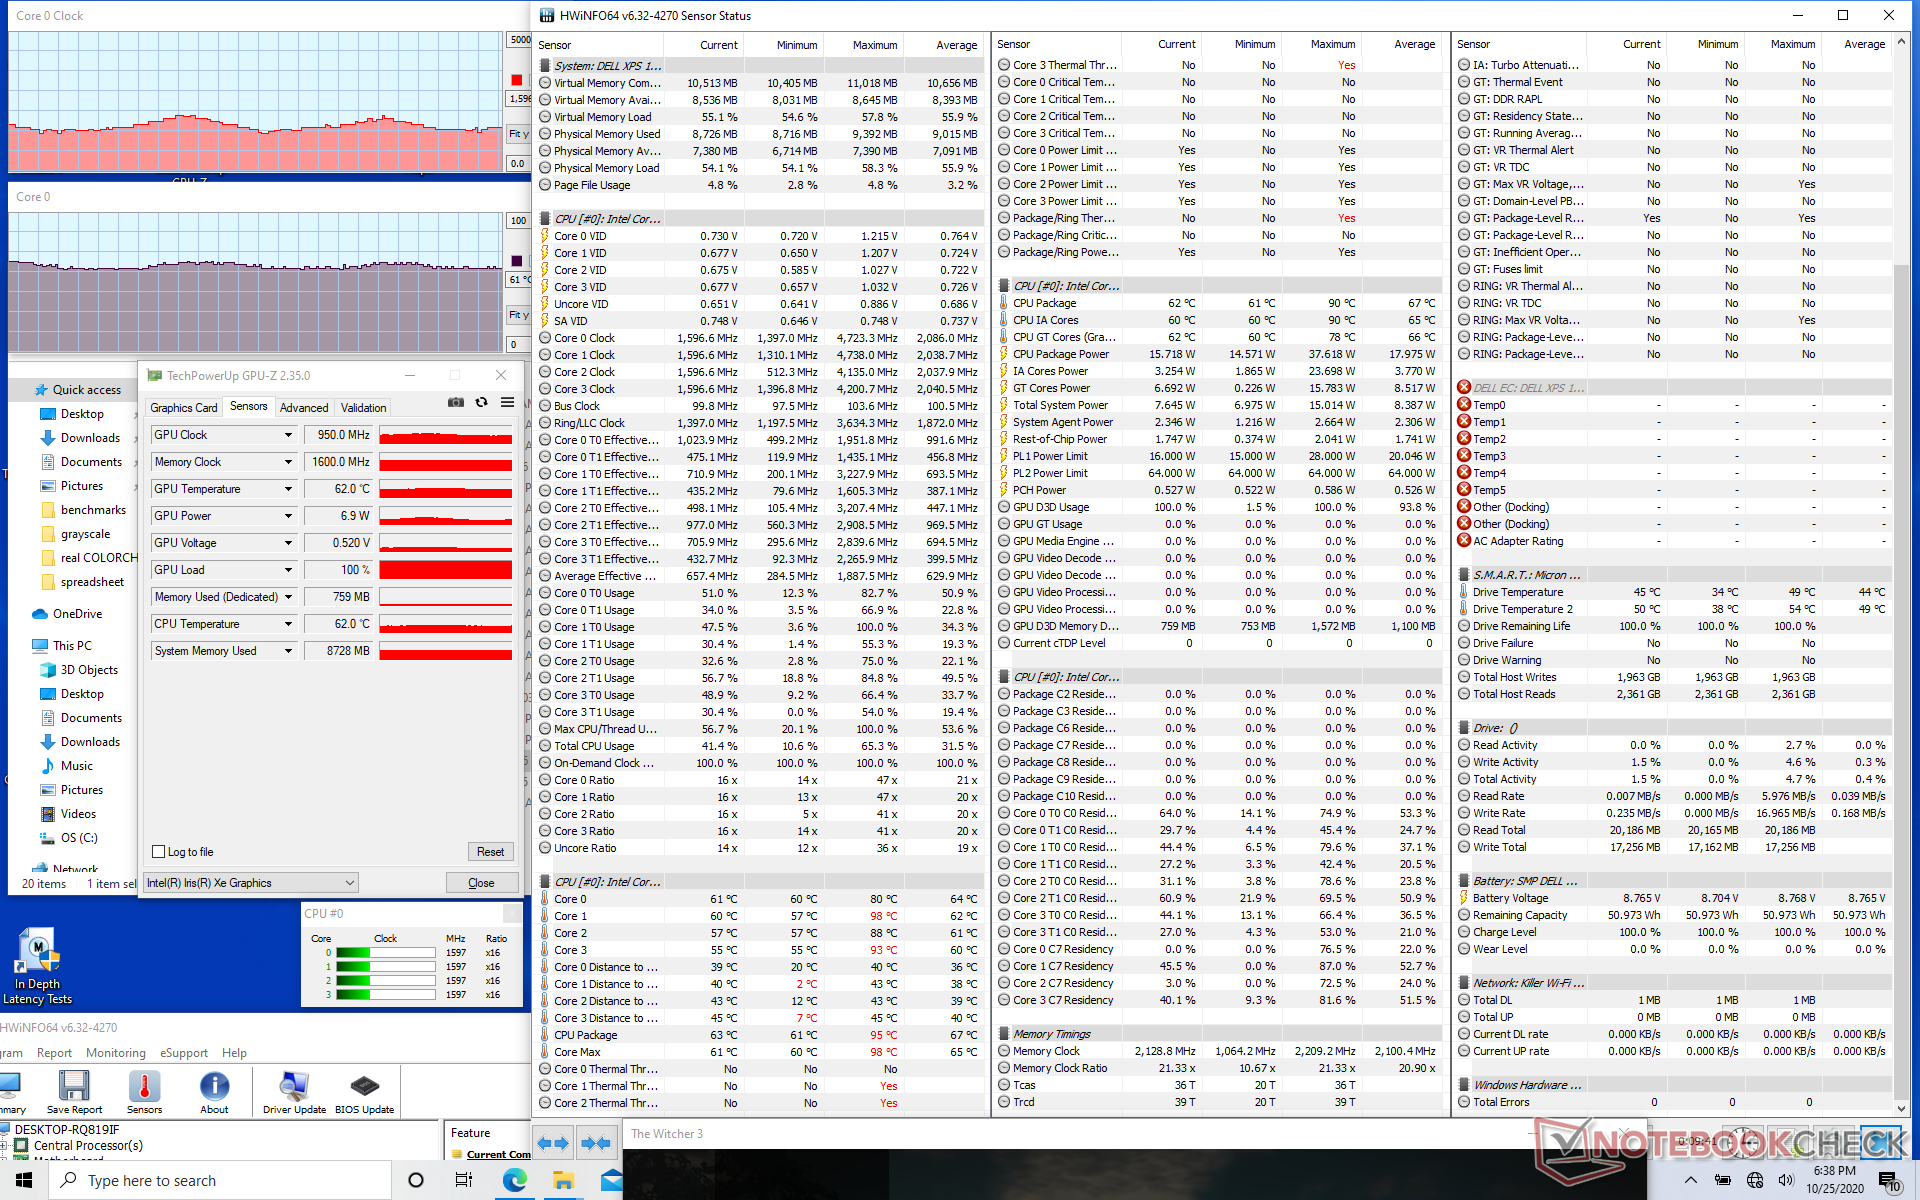
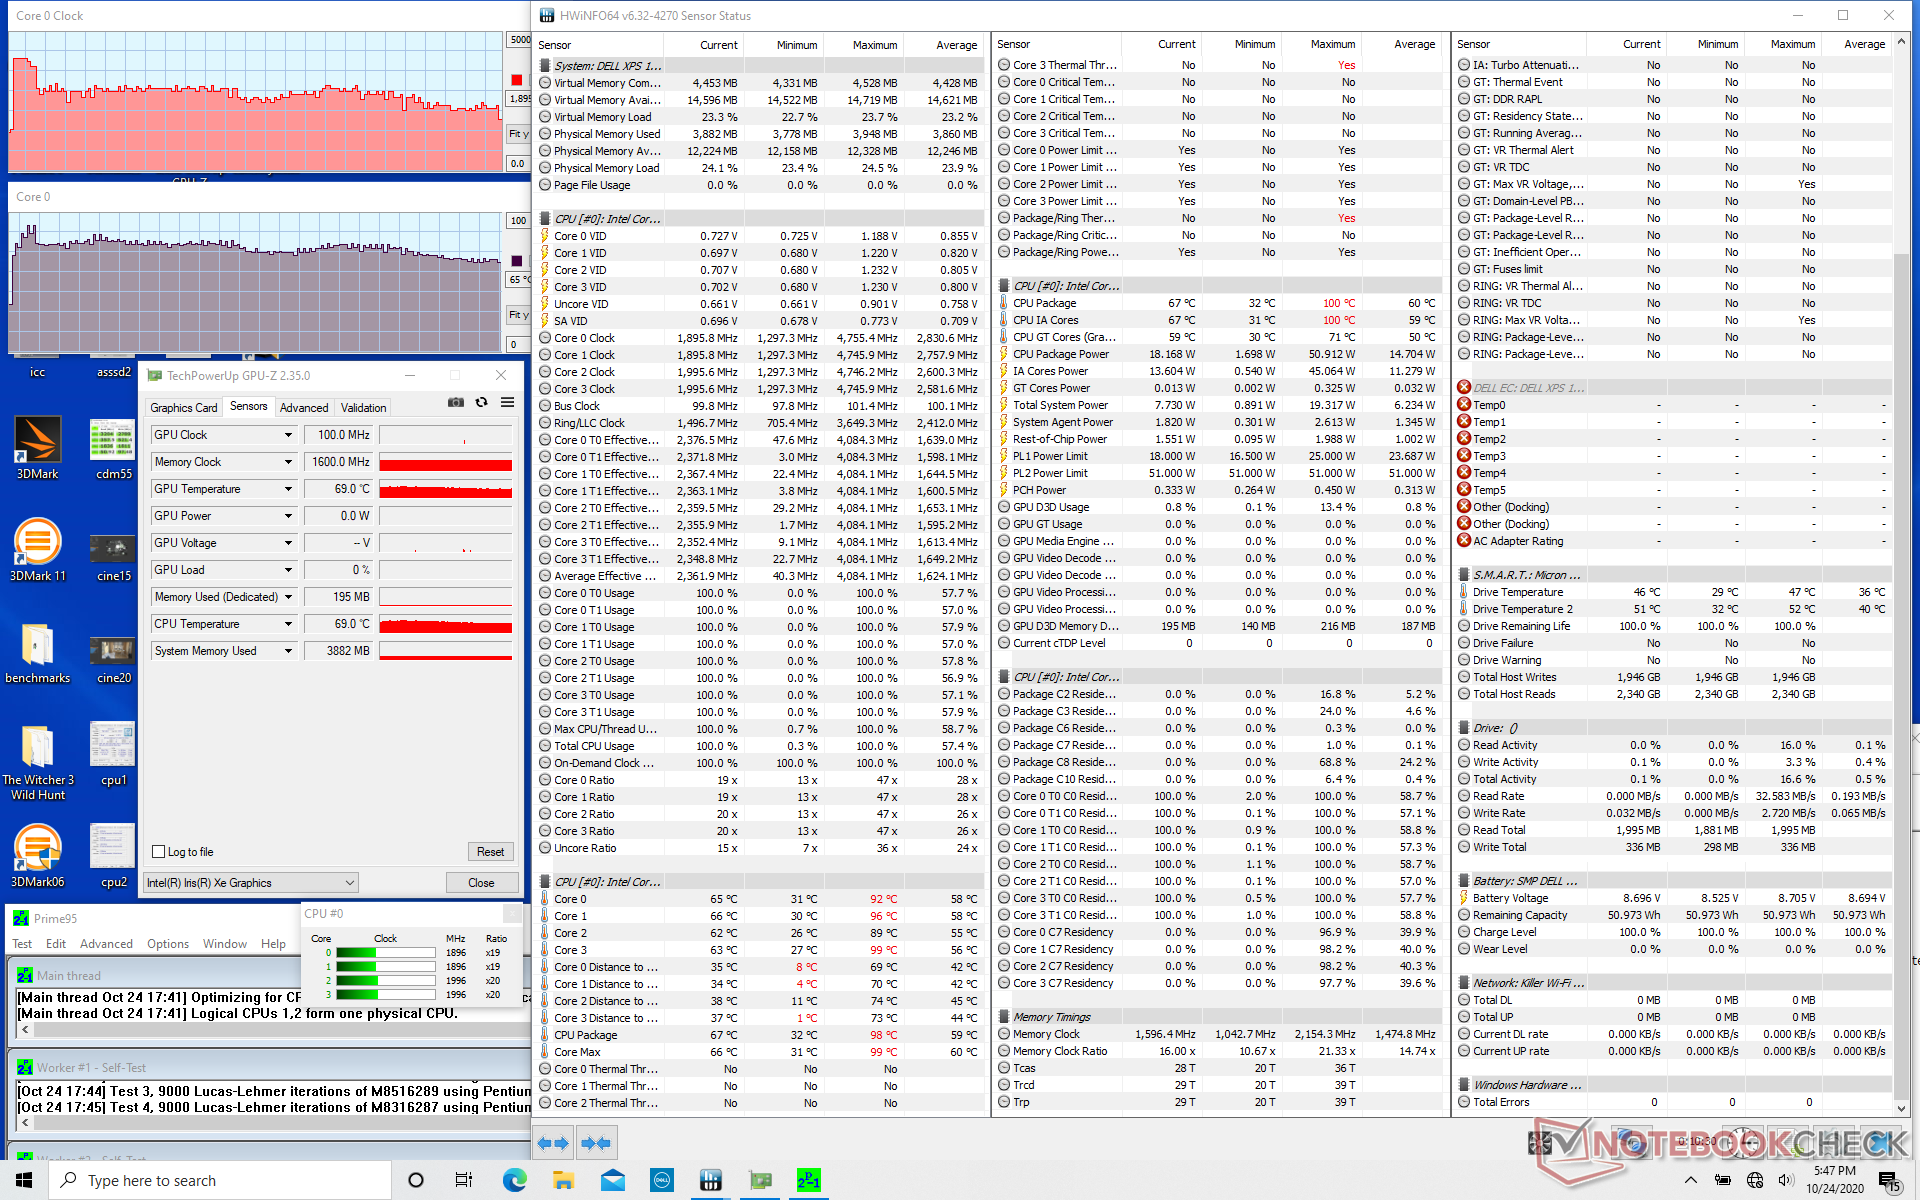
| CPU Clock (GHz) | GPU Clock (MHz) | Average CPU Temperature (°C) | |
| System Idle | -- | -- | 36 |
| Prime95 Stress | 1.9 - 3.1 | -- | 71 - 78 |
| Prime95 + FurMark Stress | 1.2 - 1.6 | 700 - 850 | 61 - 69 |
| Witcher 3 Stress | 1.4 - 2.0 | 850 - 1100 | 61 - 65 |
Speakers


Dell XPS 13 9310 Core i7 FHD audio analysis
(+) | speakers can play relatively loud (84.6 dB)
Bass 100 - 315 Hz
(-) | nearly no bass - on average 16.1% lower than median
(±) | linearity of bass is average (13.1% delta to prev. frequency)
Mids 400 - 2000 Hz
(+) | balanced mids - only 2.6% away from median
(+) | mids are linear (4.6% delta to prev. frequency)
Highs 2 - 16 kHz
(+) | balanced highs - only 1.3% away from median
(+) | highs are linear (4% delta to prev. frequency)
Overall 100 - 16.000 Hz
(+) | overall sound is linear (10.7% difference to median)
Compared to same class
» 6% of all tested devices in this class were better, 3% similar, 91% worse
» The best had a delta of 5%, average was 19%, worst was 53%
Compared to all devices tested
» 4% of all tested devices were better, 1% similar, 95% worse
» The best had a delta of 4%, average was 25%, worst was 134%
Apple MacBook 12 (Early 2016) 1.1 GHz audio analysis
(+) | speakers can play relatively loud (83.6 dB)
Bass 100 - 315 Hz
(±) | reduced bass - on average 11.3% lower than median
(±) | linearity of bass is average (14.2% delta to prev. frequency)
Mids 400 - 2000 Hz
(+) | balanced mids - only 2.4% away from median
(+) | mids are linear (5.5% delta to prev. frequency)
Highs 2 - 16 kHz
(+) | balanced highs - only 2% away from median
(+) | highs are linear (4.5% delta to prev. frequency)
Overall 100 - 16.000 Hz
(+) | overall sound is linear (10.2% difference to median)
Compared to same class
» 5% of all tested devices in this class were better, 2% similar, 93% worse
» The best had a delta of 5%, average was 19%, worst was 53%
Compared to all devices tested
» 3% of all tested devices were better, 1% similar, 96% worse
» The best had a delta of 4%, average was 25%, worst was 134%
Energy Management
Power Consumption
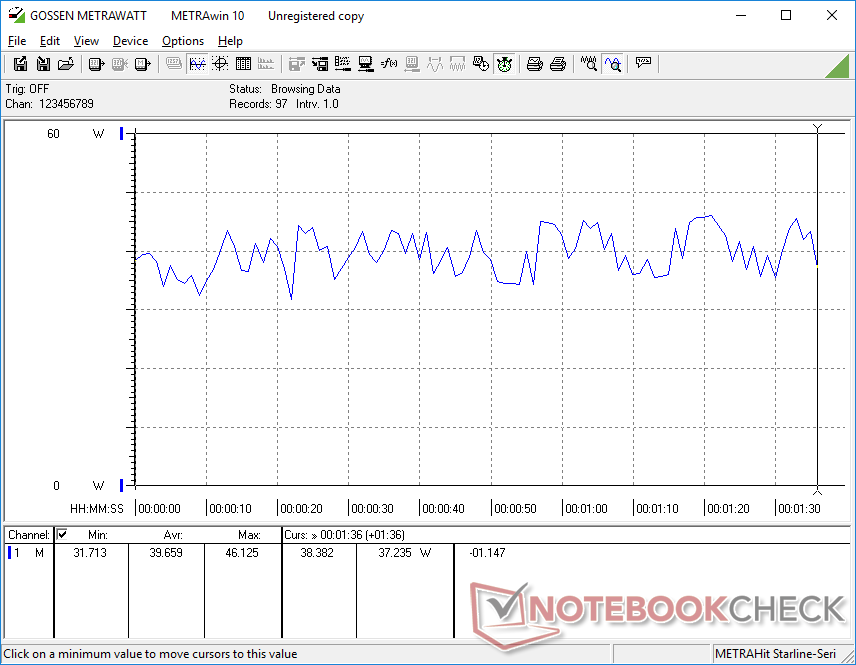
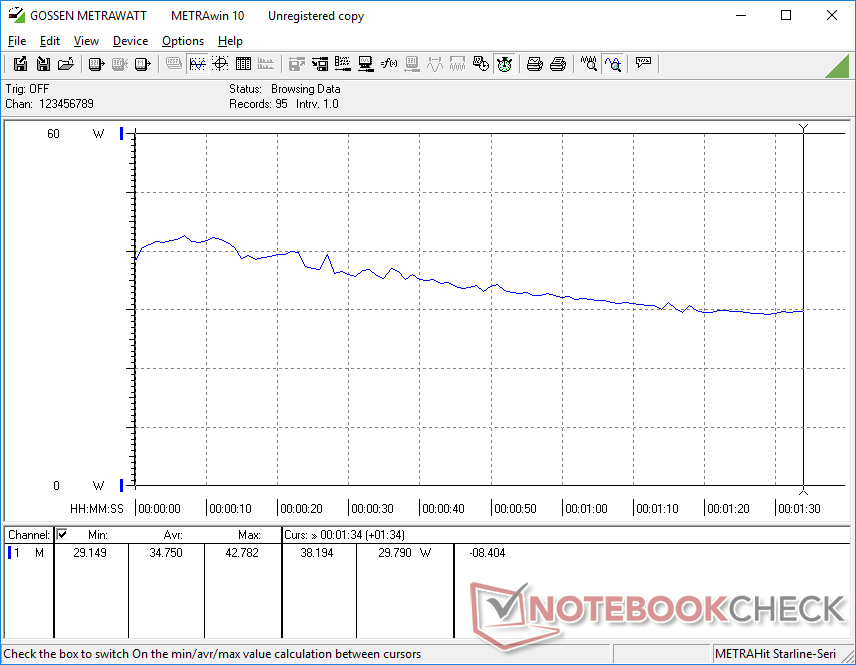
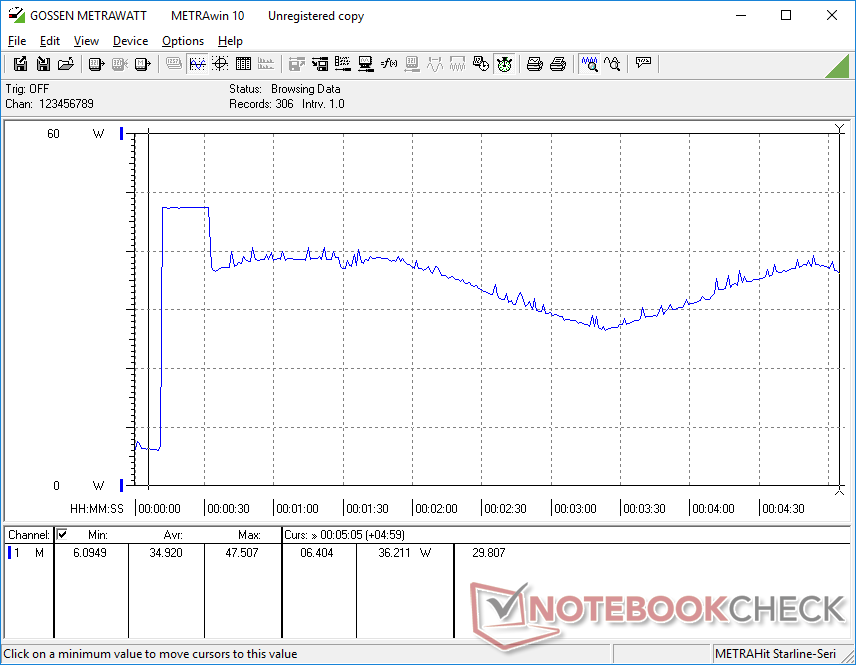
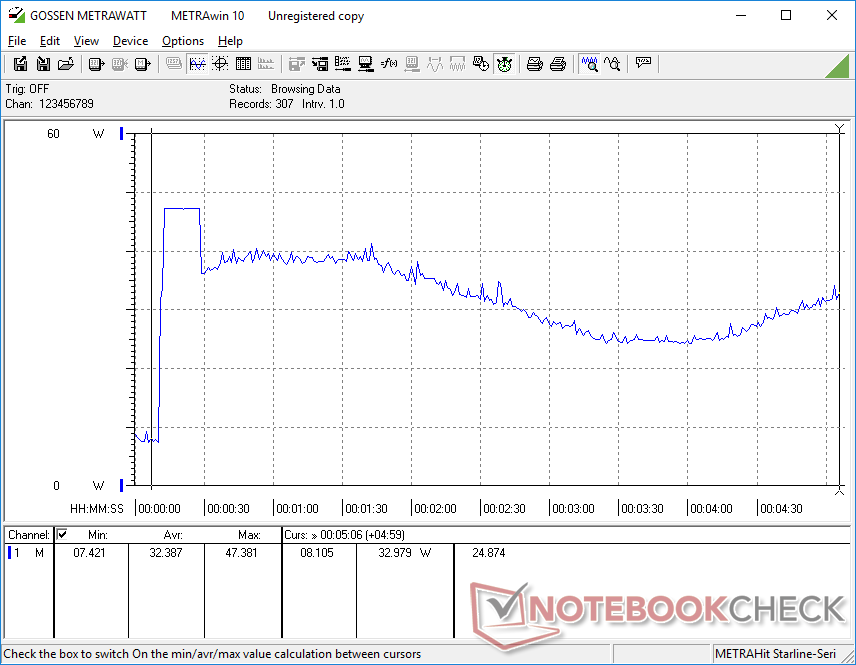
Our Tiger Lake unit demands about as much power as the older Ice Lake unit despite the gen-to-gen improvements in integrated graphics. Thus, the Iris Xe G7 is able to provide additional graphics performance for "free" without needing to draw more from the outlet.
Performance-per-watt is excellent when compared to competing systems with the GeForce MX250 or Radeon Vega 8 like the MateBook X Pro or Lenovo Yoga Slim 7, respectively, which consume about 10 W to 15 W more each when subjected to similar demanding loads.
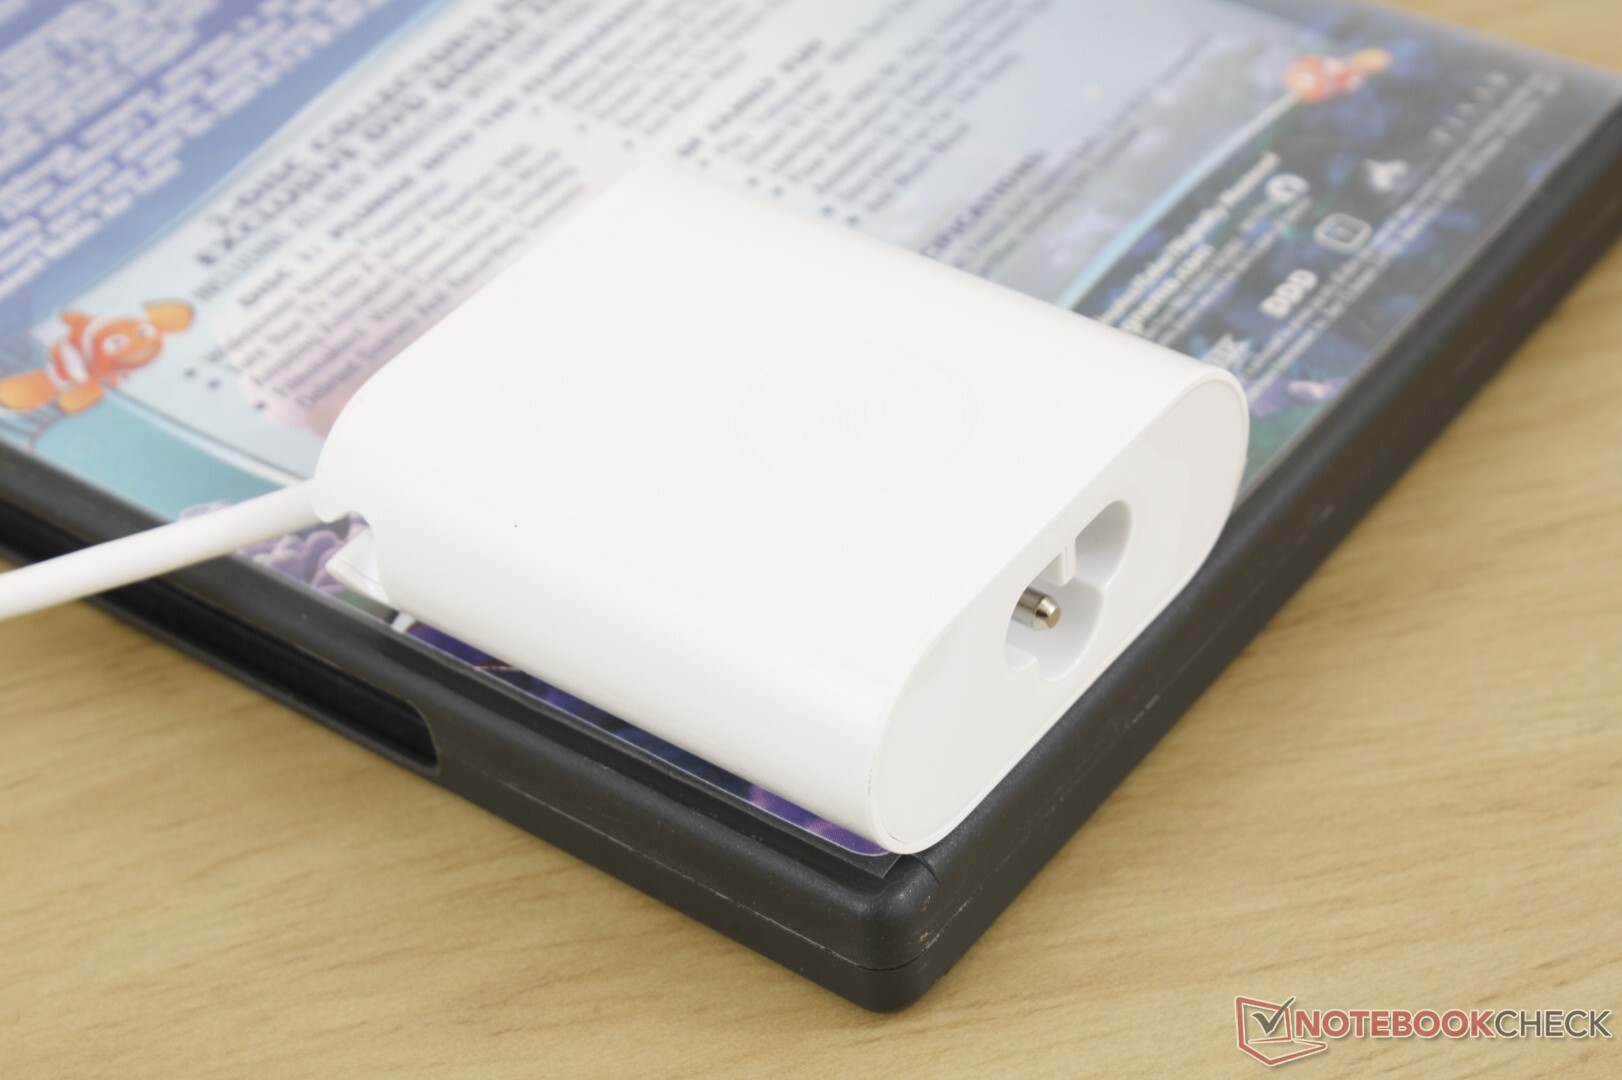
We're able to measure a maximum consumption of 47.5 W from the small (~6.0 x 5.5 x 2.2 cm) 45 W AC adapter. The system battery will still recharge since this maximum rate is not steady as shown by our graphs below.
| Off / Standby | |
| Idle | |
| Load |
|
| Dell XPS 13 9310 Core i7 FHD i7-1165G7, Iris Xe G7 96EUs, Micron 2300 512GB MTFDHBA512TDV, IPS, 1920x1200, 13.40 | Dell XPS 13 9300 Core i7-1065G7 i7-1065G7, Iris Plus Graphics G7 (Ice Lake 64 EU), Intel SSDPEMKF512G8 NVMe SSD, IPS, 1920x1200, 13.40 | Apple MacBook Pro 13 2020 2GHz i5 10th-Gen i5-1038NG7, Iris Plus Graphics G7 (Ice Lake 64 EU), Apple SSD SM0512F, IPS, 2560x1600, 13.30 | Huawei MateBook X Pro 2020 i7 i7-10510U, GeForce MX250, Samsung PM981a MZVLB1T0HBLR, LTPS, 3000x2000, 13.90 | Lenovo Yoga Slim 7-14ARE R7 4800U, Vega 8, Samsung SSD PM981a MZVLB512HBJQ, IPS, 1920x1080, 14.00 | HP Spectre x360 13-aw0013dx i7-1065G7, Iris Plus Graphics G7 (Ice Lake 64 EU), Intel Optane Memory H10 with Solid State Storage 32GB + 512GB HBRPEKNX0202A(L/H), IPS, 1920x1080, 13.30 | |
|---|---|---|---|---|---|---|
| Power Consumption | -6% | -36% | -41% | -19% | 1% | |
| Idle Minimum * | 3.9 | 4.2 -8% | 3.8 3% | 4.3 -10% | 4 -3% | 3.9 -0% |
| Idle Average * | 5.9 | 6.9 -17% | 8.6 -46% | 8.5 -44% | 6.3 -7% | 6.3 -7% |
| Idle Maximum * | 6.3 | 7.5 -19% | 10.3 -63% | 12 -90% | 7.7 -22% | 6.8 -8% |
| Load Average * | 39.7 | 33.3 16% | 52.1 -31% | 54.8 -38% | 48.3 -22% | 32.6 18% |
| Witcher 3 ultra * | 34.8 | 37.1 -7% | 48.2 -39% | 47.1 -35% | 49 -41% | 25.6 26% |
| Load Maximum * | 47.5 | 48.4 -2% | 65.2 -37% | 61.5 -29% | 57.6 -21% | 59 -24% |
* ... smaller is better
Battery Life
Runtimes are not all that different from the XPS 13 9300. In fact, they may be slightly shorter according to our own tests. Nonetheless, 11 hours of real-world WLAN use should be more than enough for most users.
Charging from empty to full capacity takes just over 2 hours compared to 1.5 hours on most other Ultrabooks.
| Dell XPS 13 9310 Core i7 FHD i7-1165G7, Iris Xe G7 96EUs, 52 Wh | Dell XPS 13 9300 Core i7-1065G7 i7-1065G7, Iris Plus Graphics G7 (Ice Lake 64 EU), 52 Wh | Apple MacBook Pro 13 2020 2GHz i5 10th-Gen i5-1038NG7, Iris Plus Graphics G7 (Ice Lake 64 EU), 58 Wh | Huawei MateBook X Pro 2020 i7 i7-10510U, GeForce MX250, 57.4 Wh | Lenovo Yoga Slim 7-14ARE R7 4800U, Vega 8, 61 Wh | HP Spectre x360 13-aw0013dx i7-1065G7, Iris Plus Graphics G7 (Ice Lake 64 EU), 60 Wh | |
|---|---|---|---|---|---|---|
| Battery Runtime | 16% | 11% | -15% | -25% | -1% | |
| Reader / Idle | 1800 | 1623 -10% | 2223 24% | |||
| WiFi v1.3 | 657 | 763 16% | 728 11% | 622 -5% | 619 -6% | 594 -10% |
| Load | 193 | 146 -24% | 79 -59% | 160 -17% |
Pros
Cons
Verdict
If you already own an Ice Lake laptop, then there isn't much a reason to upgrade to Tiger Lake. Overall system performance isn't noticeably better than the XPS 13 9300 which isn't even a year old. The main exception relates to graphics performance as the integrated Iris Xe is much faster than the Iris Plus G7 without demanding more power or needing to run louder or hotter. This is particularly alluring for video or graphics editors who know they can exploit the GPU to get the most out of the XPS 13 9310 and its new processor.
For everyone else, the less expensive XPS 13 9300 will be more than enough especially since the CPU performance gap between 10th gen Core i7 and 11th gen Core i7 is marginal. The strongest advantage of Tiger Lake, which is its new integrated GPU, isn't very useful for gamers here other than casual players because frame rates tend to be less stable and sometimes even slower than the tried-and-true GeForce MX150/MX250 series. Furthermore, both the average display response times and lack of adaptive sync only cement this fact. It would be nice to see improvements in these specific areas or at least a webcam shutter for future model revisions. A software option to toggle dynamic tuning in favor of consistent clock rates would be nice as well.
Can't choose between the XPS 13 9300 or 9310? For word processing, video streaming, and casual gaming, the XPS 13 9300 will feel just as fast as the 9310. For editors and graphics intensive applications outside of gaming, the additional GPU power and high performance-per-watt of Iris Xe should prove useful.
Dell XPS 13 9310 Core i7 FHD
-
10/28/2020 v7
Allen Ngo
More articles related to this device
Dell XPS 13 9310 Core i7 FHD (XPS 13 9310 Series)Related Articles


Pricecompare
