 Deutsch
 English
 Español
 Français
 Italiano
 Nederlands
 Polski
 Português
 Русский
 Türkçe
 Svenska
 Chinese
 Magyar
Core Ultra 7 165U performance debut: Dell Latitude 9450 2-in-1 review

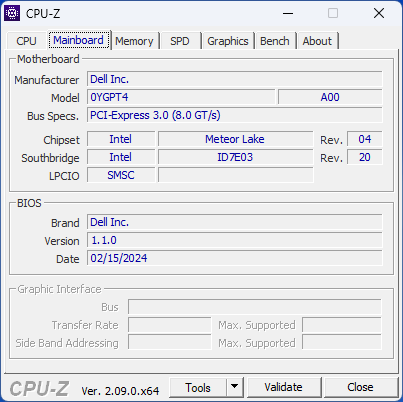
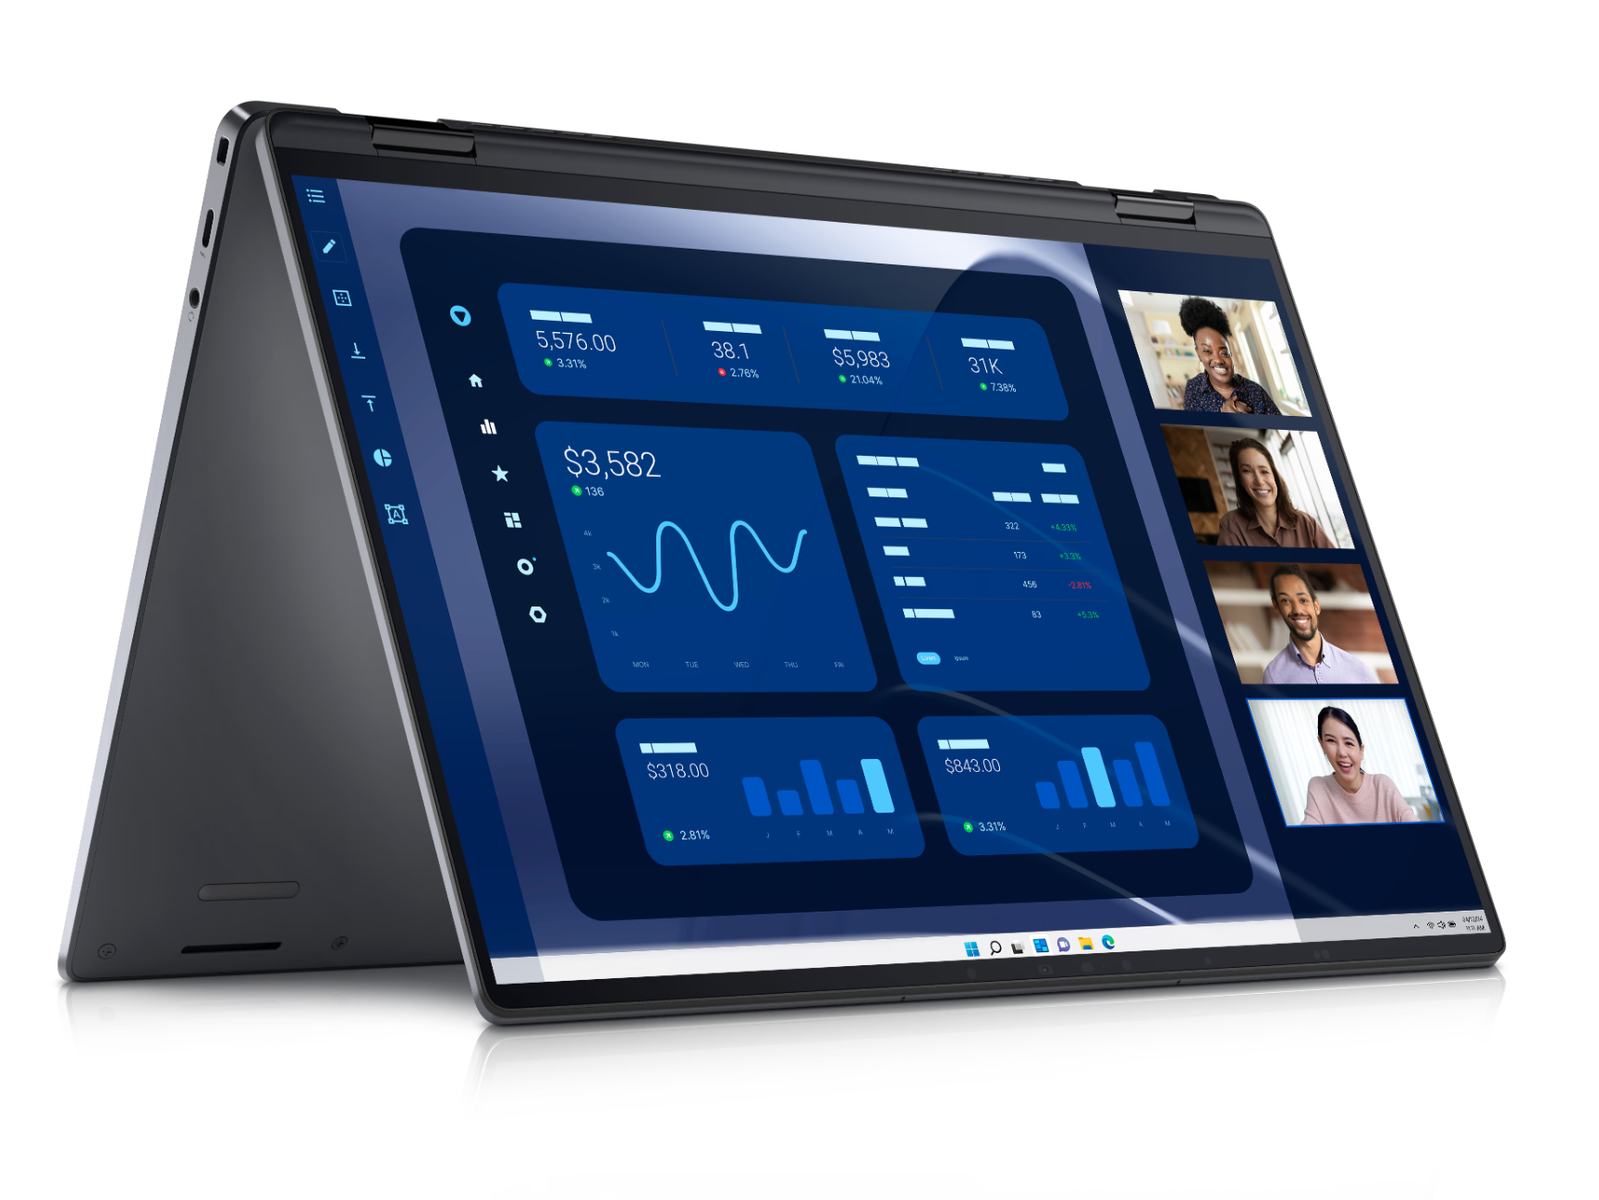
The 2024 Latitude 9450 2-in-1 directly succeeds last year's Latitude 9440 2-in-1. The newer model introduces Intel Meteor Lake-U processor options to replace the older Raptor Lake-U series. Otherwise, the two Latitude models are visually identical as there are no major changes to the family this year.
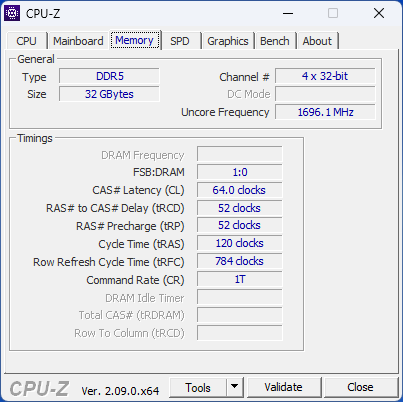
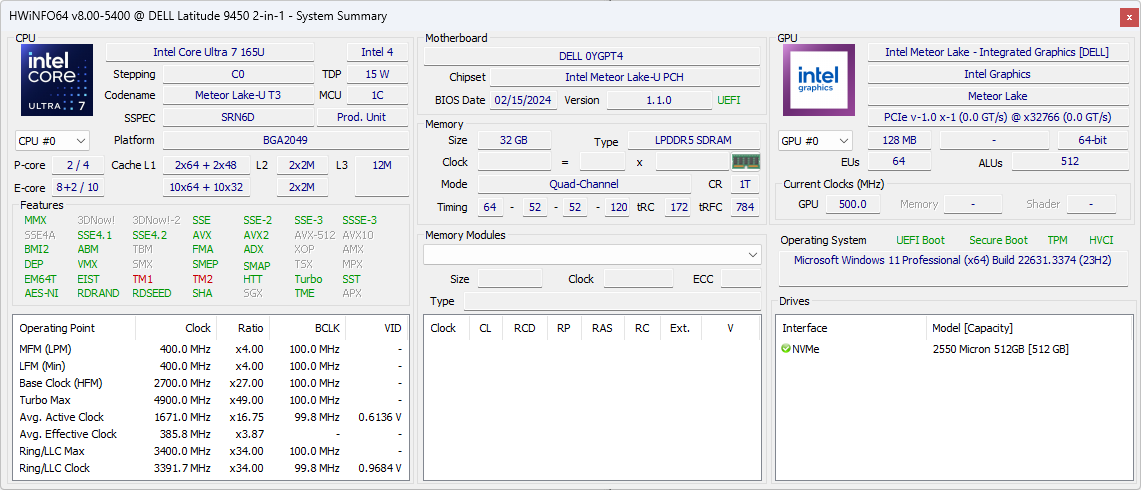
Our test unit is the highest-end configuration with the Core Ultra 7 165U CPU, 32 GB of LPDDR5x-7467 RAM, and 512 GB M.2 2230 SSD for approximately $3000 USD. Lesser SKUs come with the Core Ultra 5 125U instead and include half the RAM and storage for several hundred dollars less, but the 2560 x 1600 IPS touchscreen is fixed across all options.
Alternatives to the Latitude 9450 2-in-1 include other business convertibles like the Asus Expertbook B5 Flip, Lenovo ThinkPad X13 Yoga G4, or the HP EliteBook x360 830 G10.
More Dell reviews:
Potential Competitors in Comparison
Rating | Date | Model | Weight | Height | Size | Resolution | Best Price |
|---|---|---|---|---|---|---|---|
| 88.3 % | 04/2024 | Dell Latitude 9450 2-in-1 Ultra 7 165U, Graphics 4-Core | 1.6 kg | 16.28 mm | 14.00" | 2560x1600 | |
| 87.9 % | 06/2023 | Dell Latitude 9440 2-in-1 i7-1365U, Iris Xe G7 96EUs | 1.6 kg | 16.28 mm | 14.00" | 2560x1600 | |
| 88.4 % | 09/2023 | HP EliteBook 1040 G10 818N7EA i5-1335U, Iris Xe G7 80EUs | 1.3 kg | 17.9 mm | 14.00" | 1920x1200 | |
| 89.3 % | 03/2024 | Asus Expertbook B5 Flip B5402F, i7-1360P i7-1360P, Iris Xe G7 96EUs | 1.4 kg | 19.3 mm | 14.00" | 1920x1080 | |
| 90.5 % | 04/2024 | Lenovo Yoga 9 2-in-1 14IMH9 Ultra 7 155H, Arc 8-Cores | 1.3 kg | 15.9 mm | 14.00" | 2880x1800 | |
| 86.1 % | 07/2022 | MSI Summit E14 Flip Evo A12MT i7-1260P, Iris Xe G7 96EUs | 1.6 kg | 17.9 mm | 14.00" | 2880x1800 |
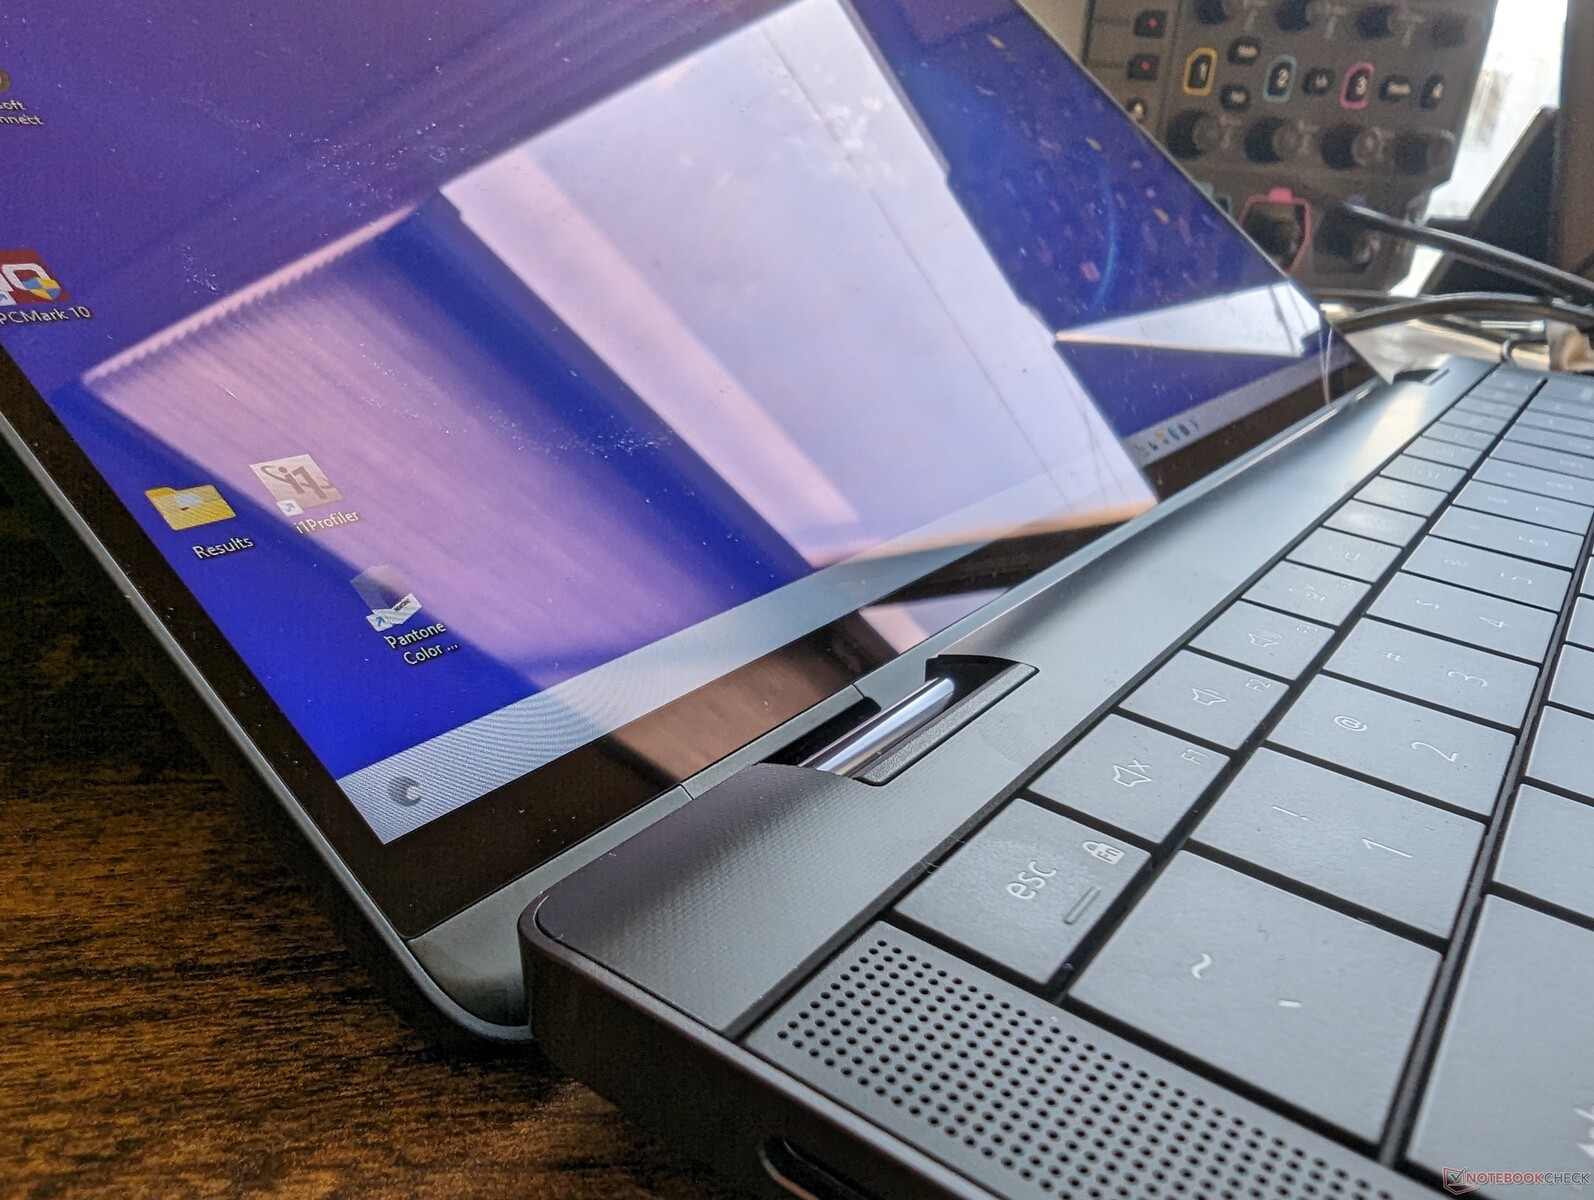
Case — Year-Old Design Still Feels Fresh
Last year's Latitude 9440 2-in-1 was a radical redesign of the older Latitude 9430 2-in-1. Thus, it's not surprising that this year's Latitude 9450 2-in-1 introduces only minimal changes. Our existing comments on the chassis and physical properties of the Latitude 9440 2-in-1 still apply for the Latitude 9450 2-in-1.
An easy way to distinguish between the Latitude 9450 2-in-1 from the 9440 2-in-1 is to look for the new Microsoft Co-Pilot key which replaces the Ctrl key. Laptops from other manufacturers like Lenovo have begun incorporating the Co-Pilot key as well.
Communication
Wi-Fi 7 comes standard whereas last year's model shipped with "only" Wi-Fi 6E support. However, the vast majority of users still cannot fully exploit the benefits of Wi-Fi 7 and so the upgrade here makes little to no difference at the time of writing.
Webcam
Webcam quality remains at 2 MP whereas models like the HP EliteBook 1040 G10 or Lenovo ThinkPad X13 Yoga G4 have 5 MP sensors for sharper images.


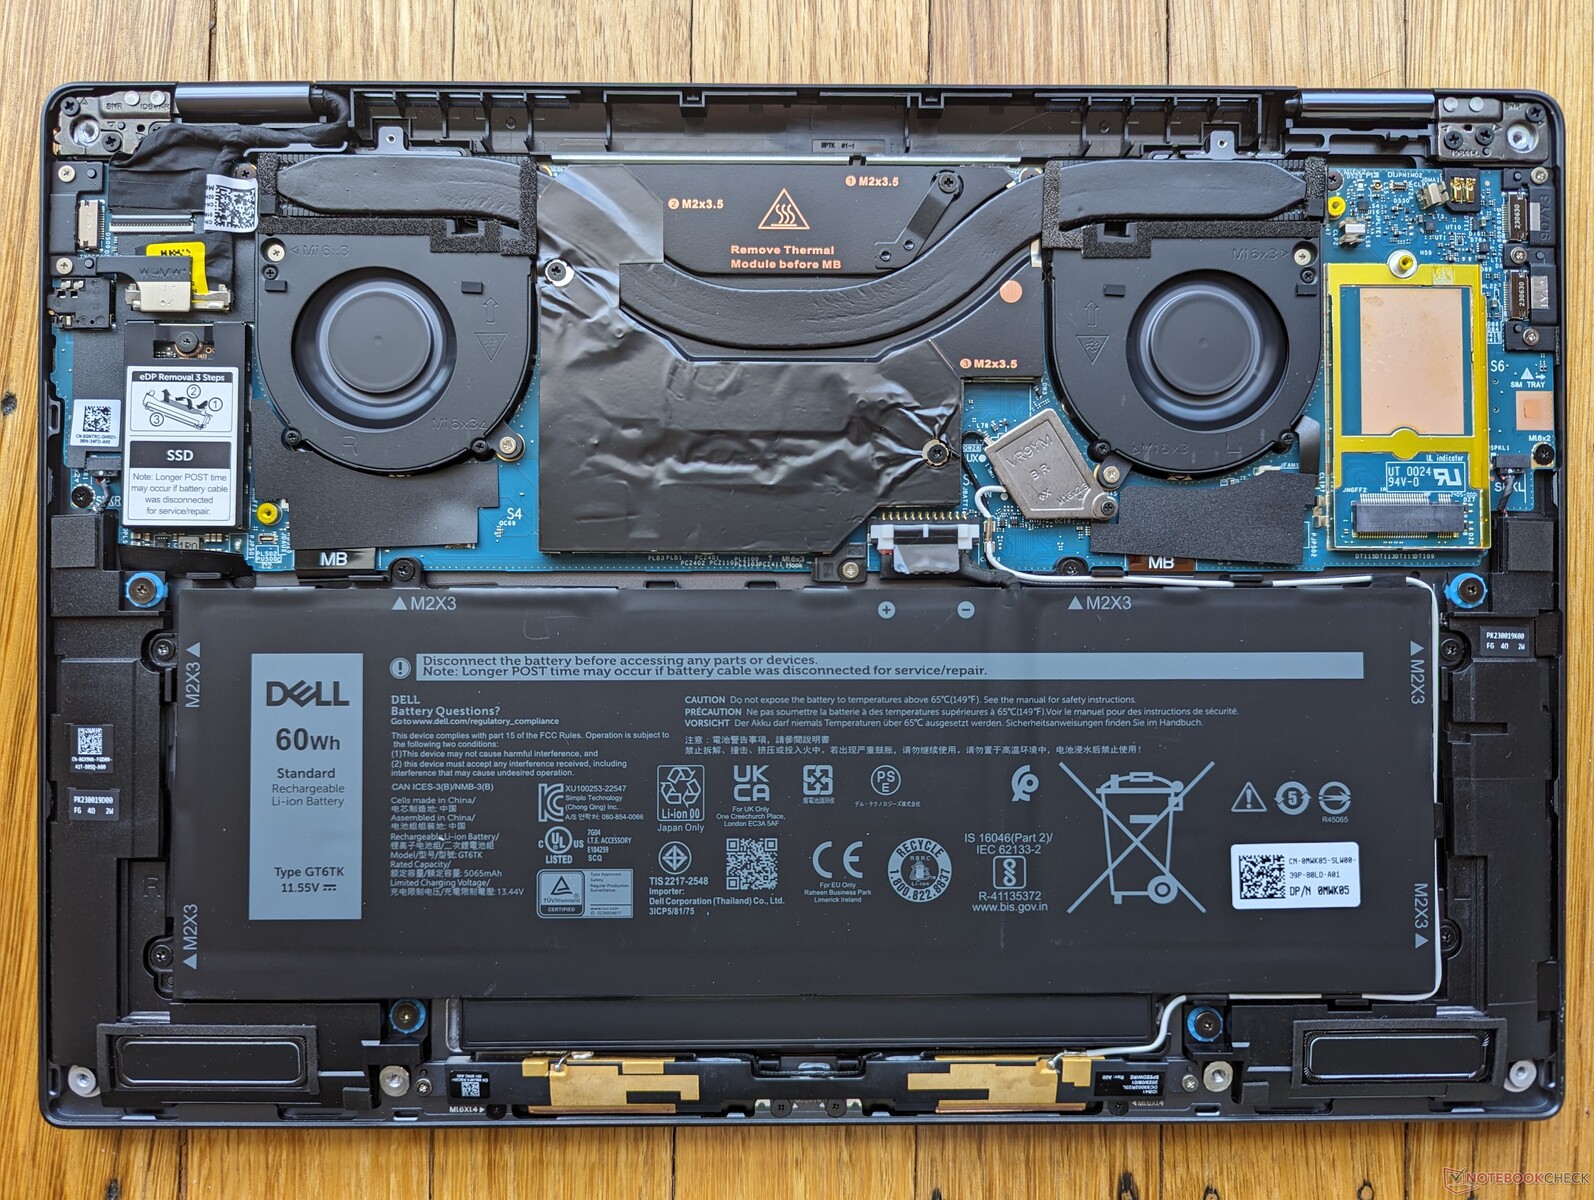
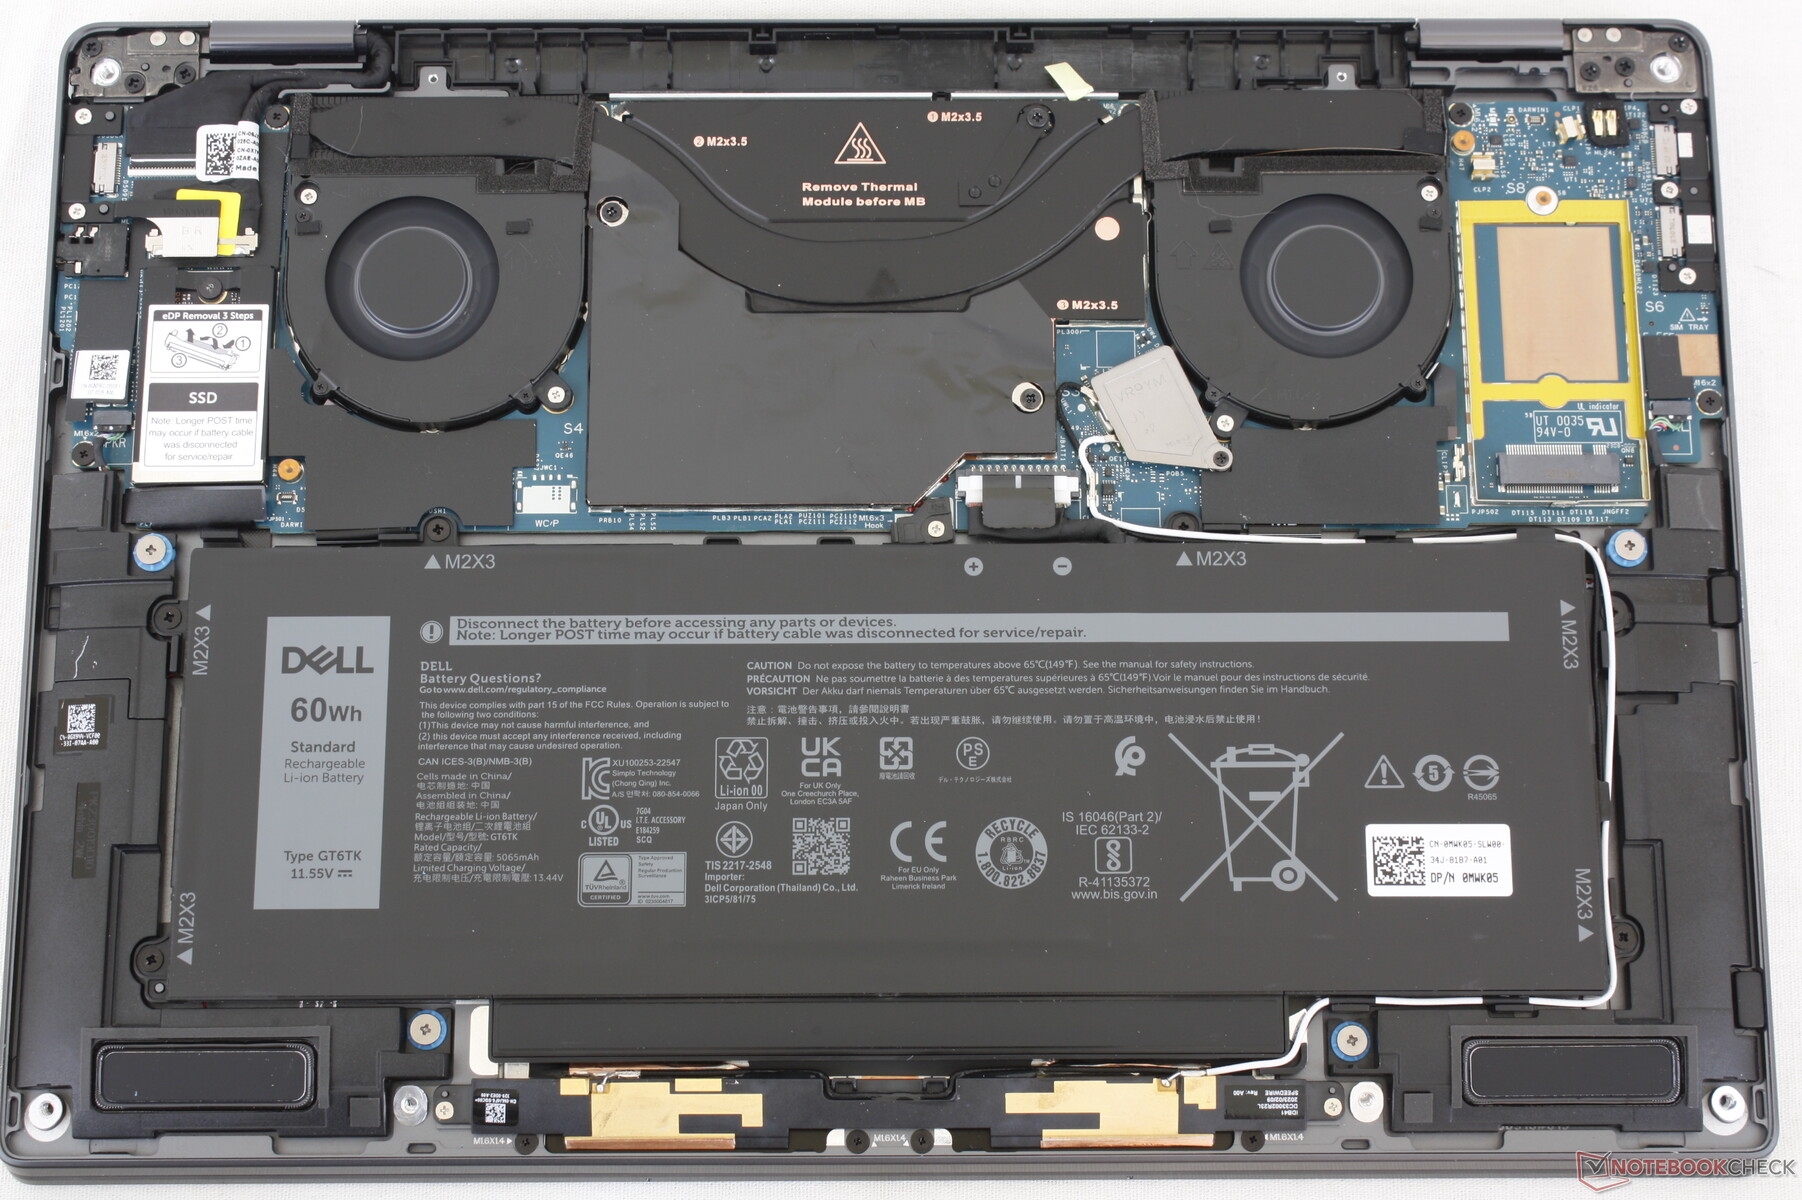
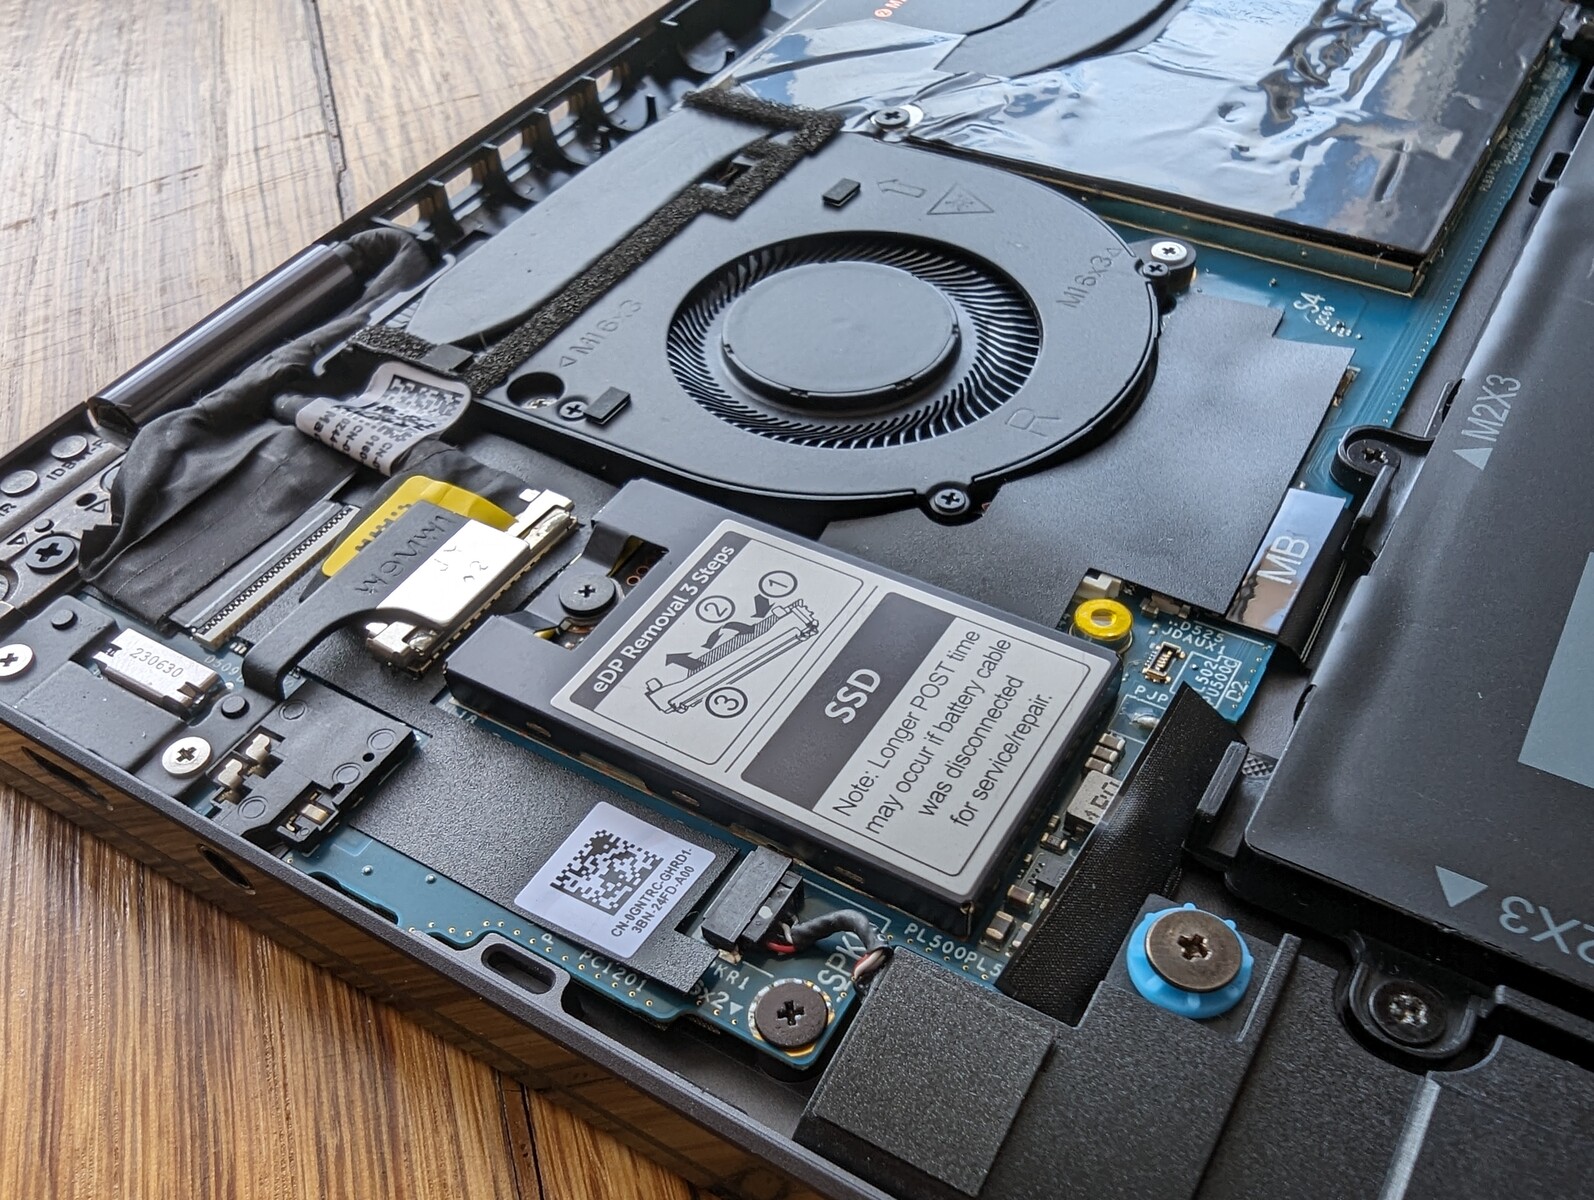
Maintenance
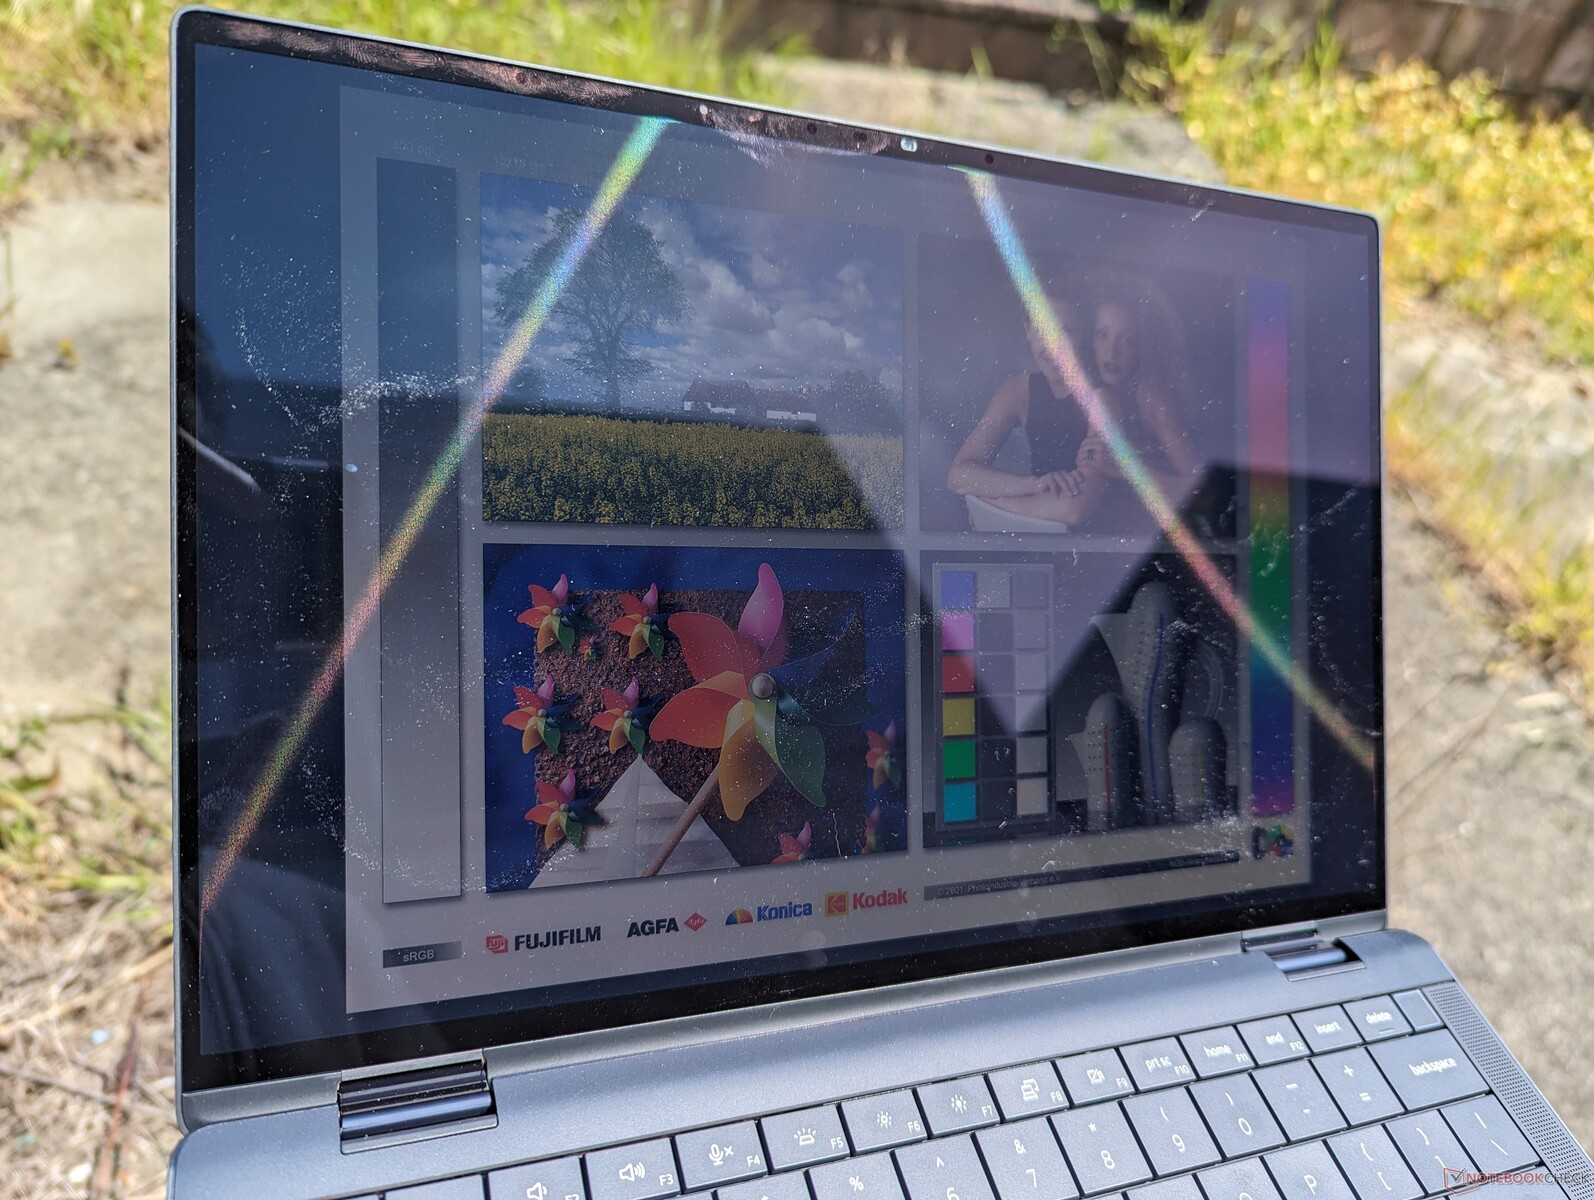
Display — IPS Only
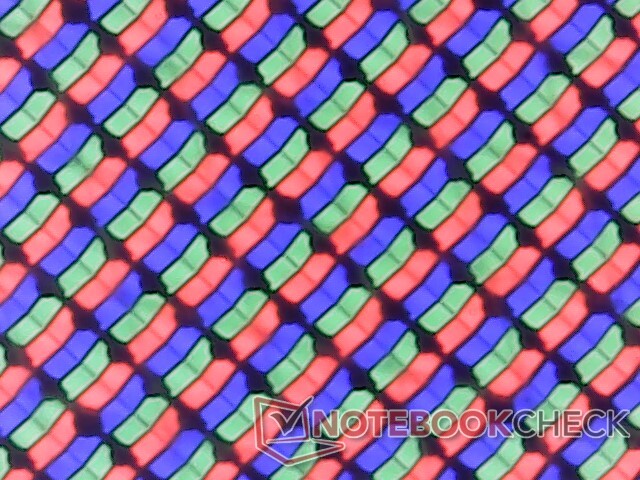
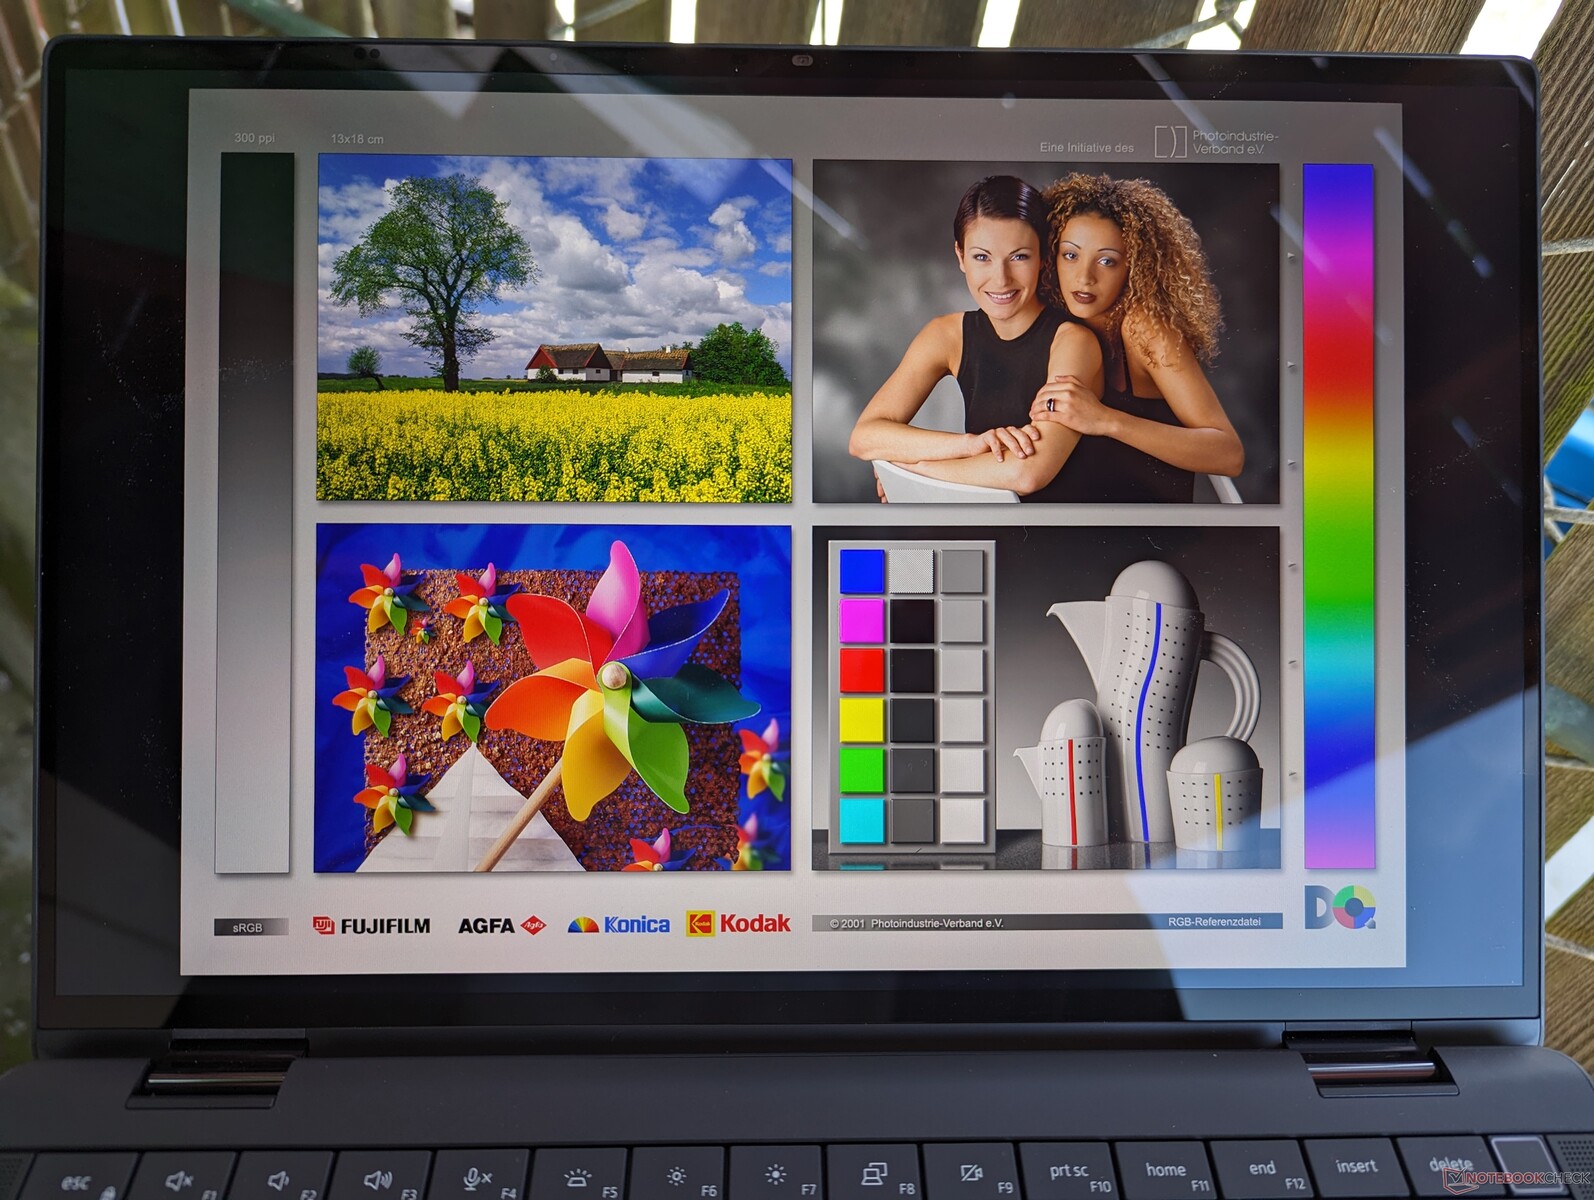
The touchscreen has not changed and so users are still getting the same AU Optronics B140QAN IPS panel as on the 2023 model. This panel is notorious for its slow black-white and gray-gray response times leading to very noticeable ghosting. For most office tasks, however, the ghosting shouldn't be a huge issue.
There are unfortunately still no other display options to choose from meaning OLED and higher refresh rates are out of the question.
| |||||||||||||||||||||||||
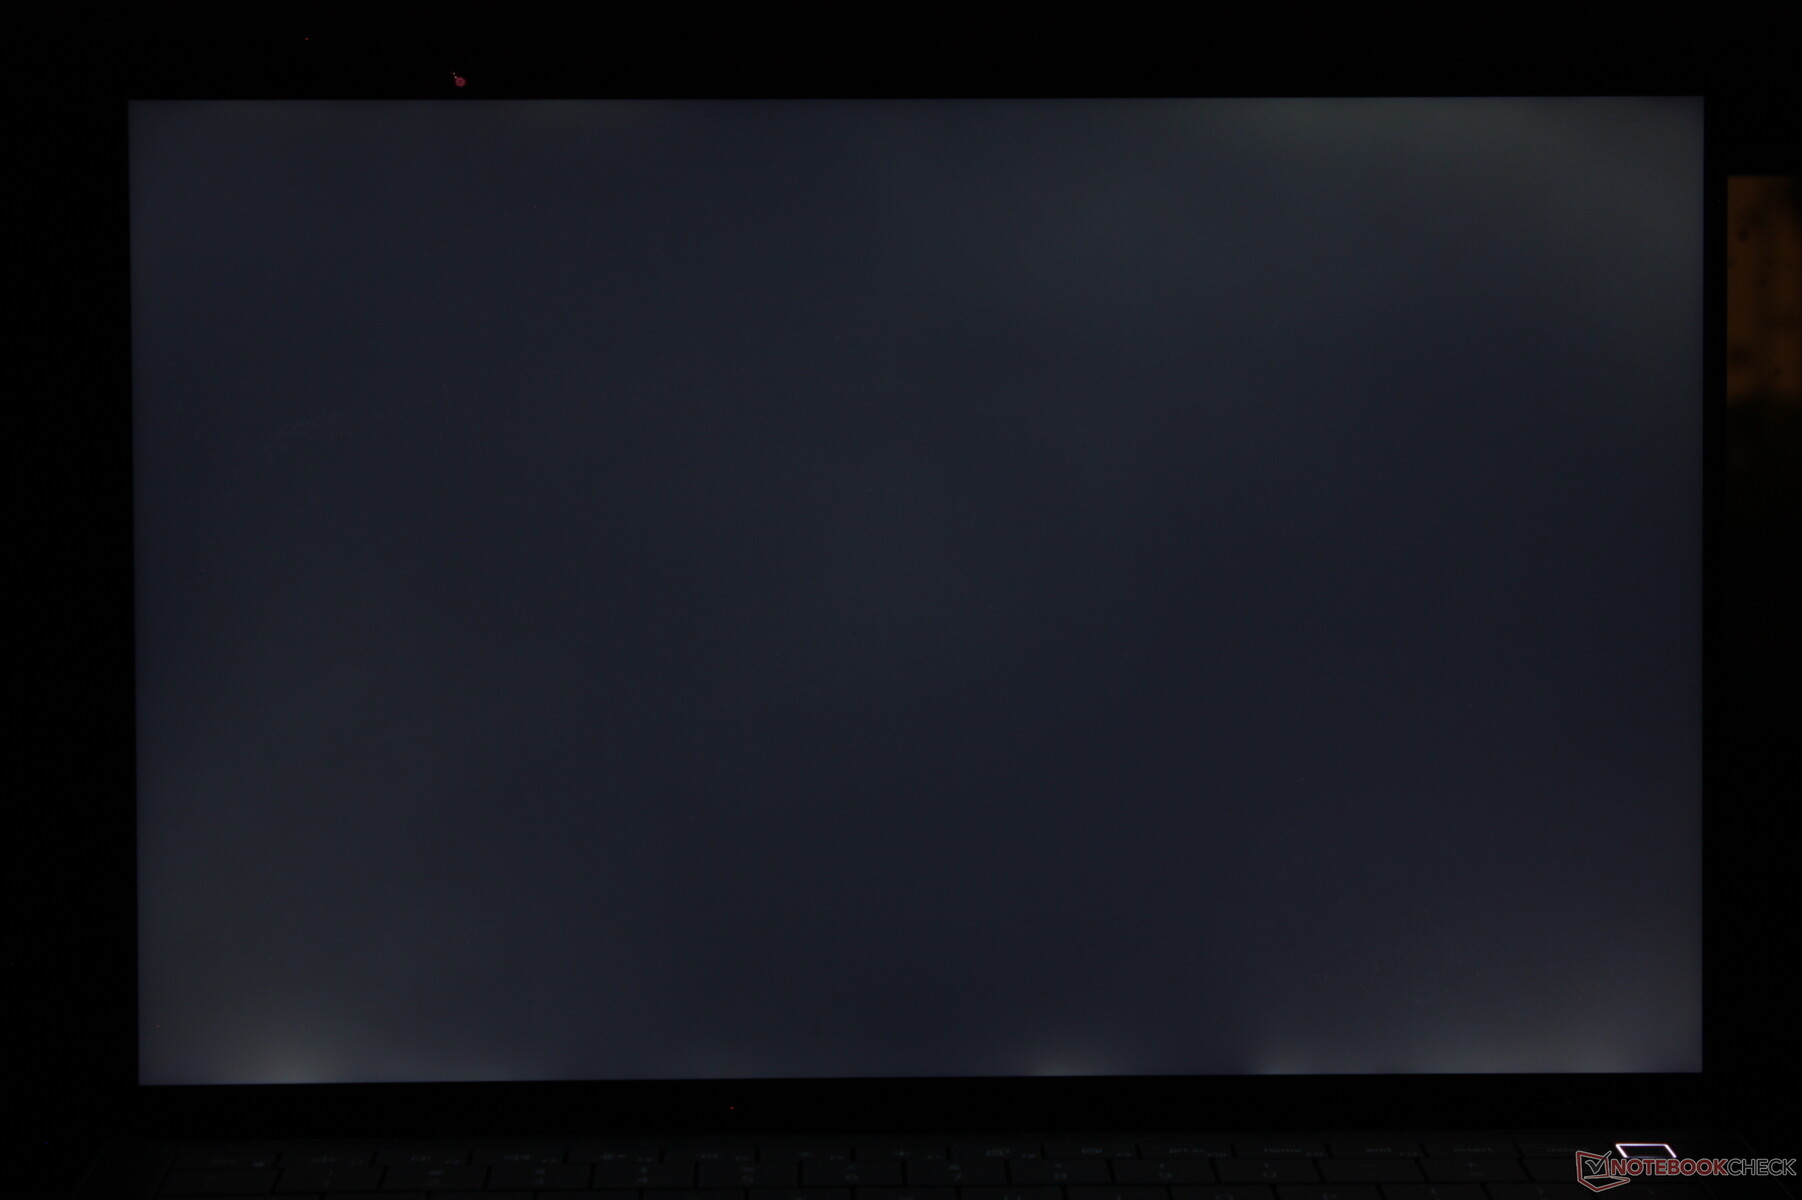
Brightness Distribution: 88 %
Center on Battery: 501.4 cd/m²
Contrast: 1567:1 (Black: 0.32 cd/m²)
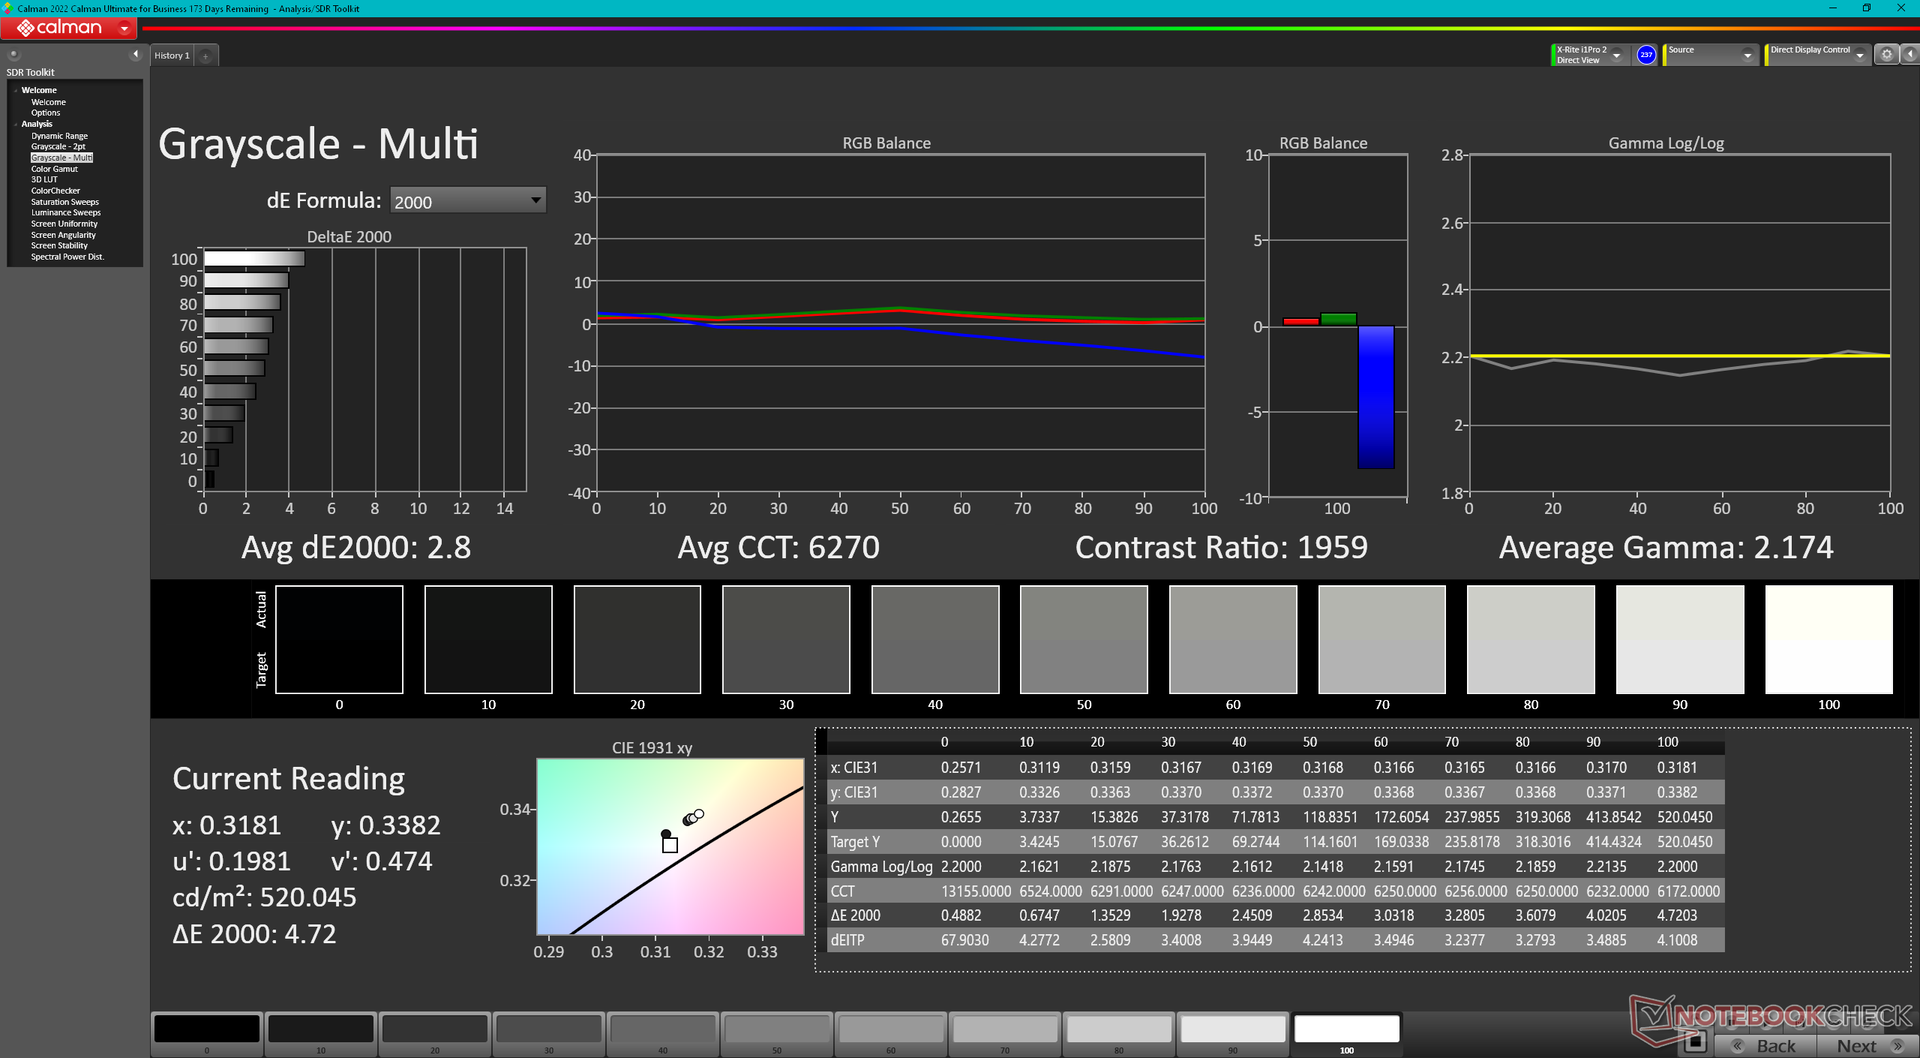
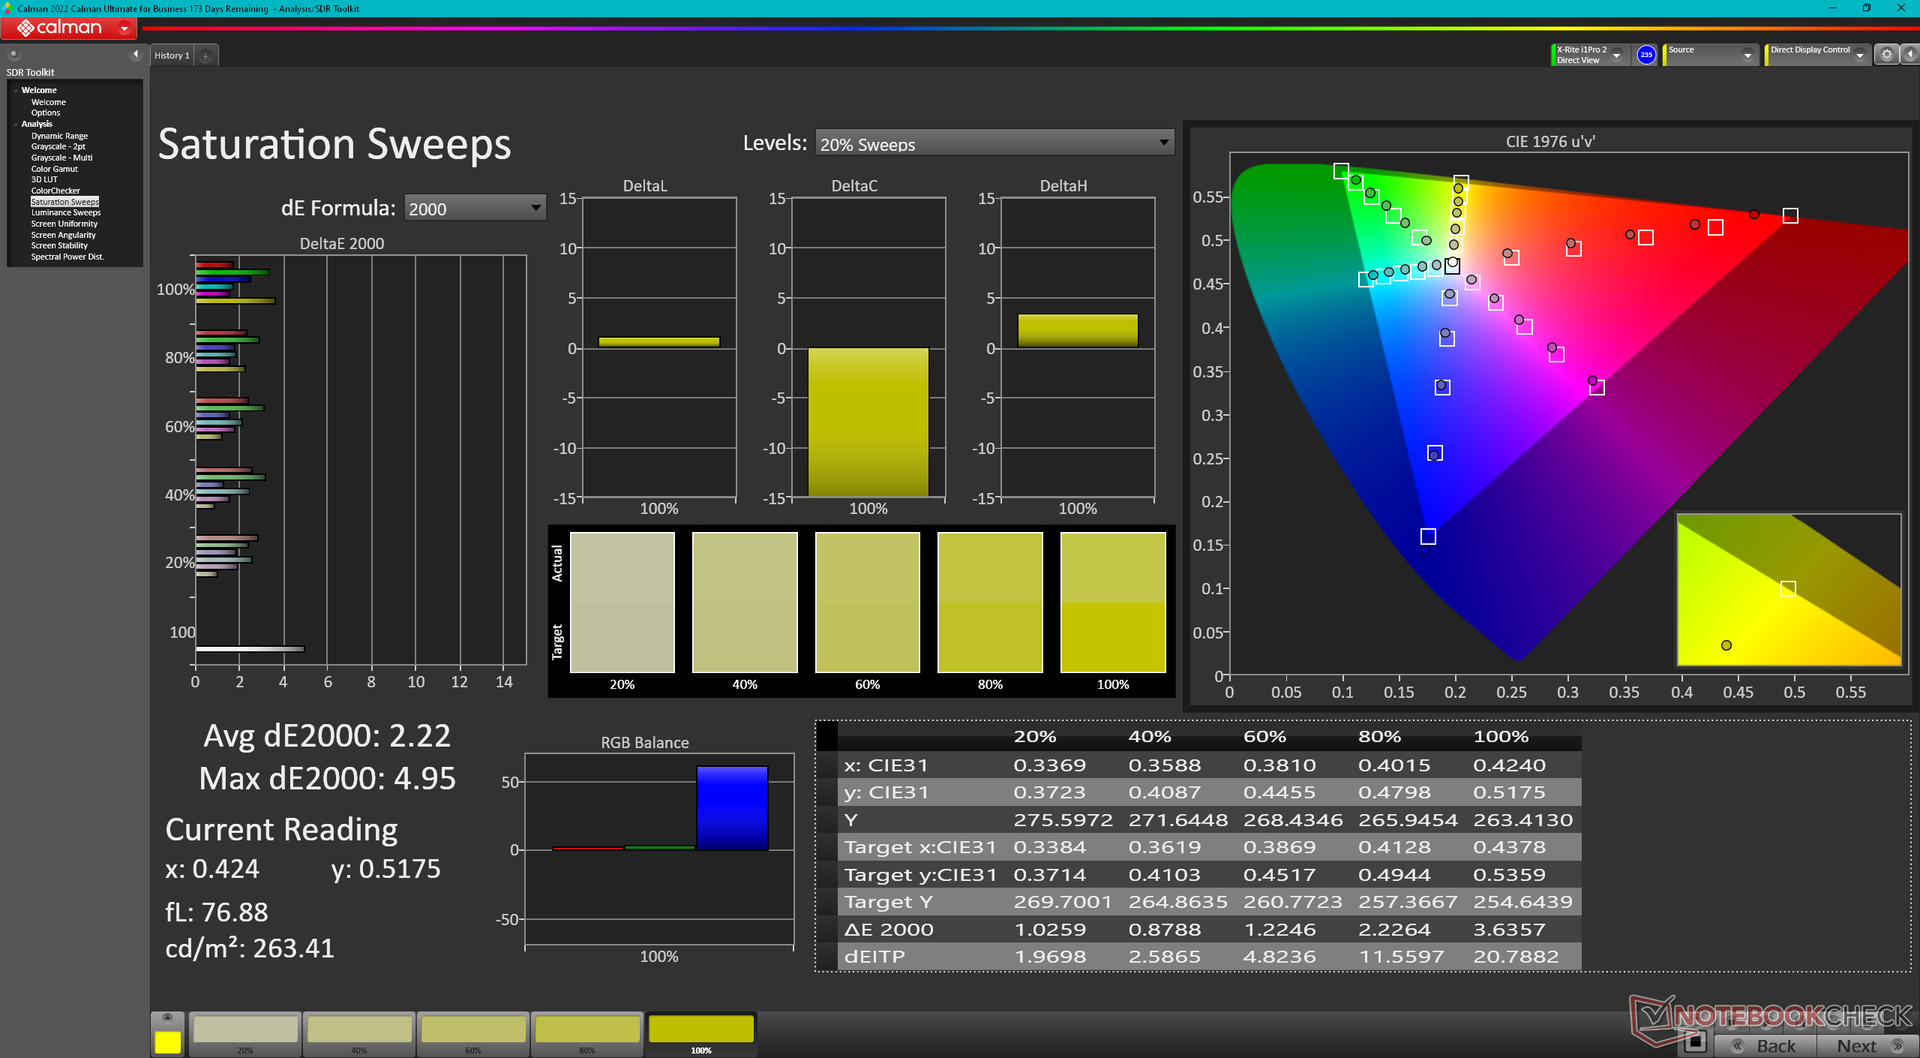
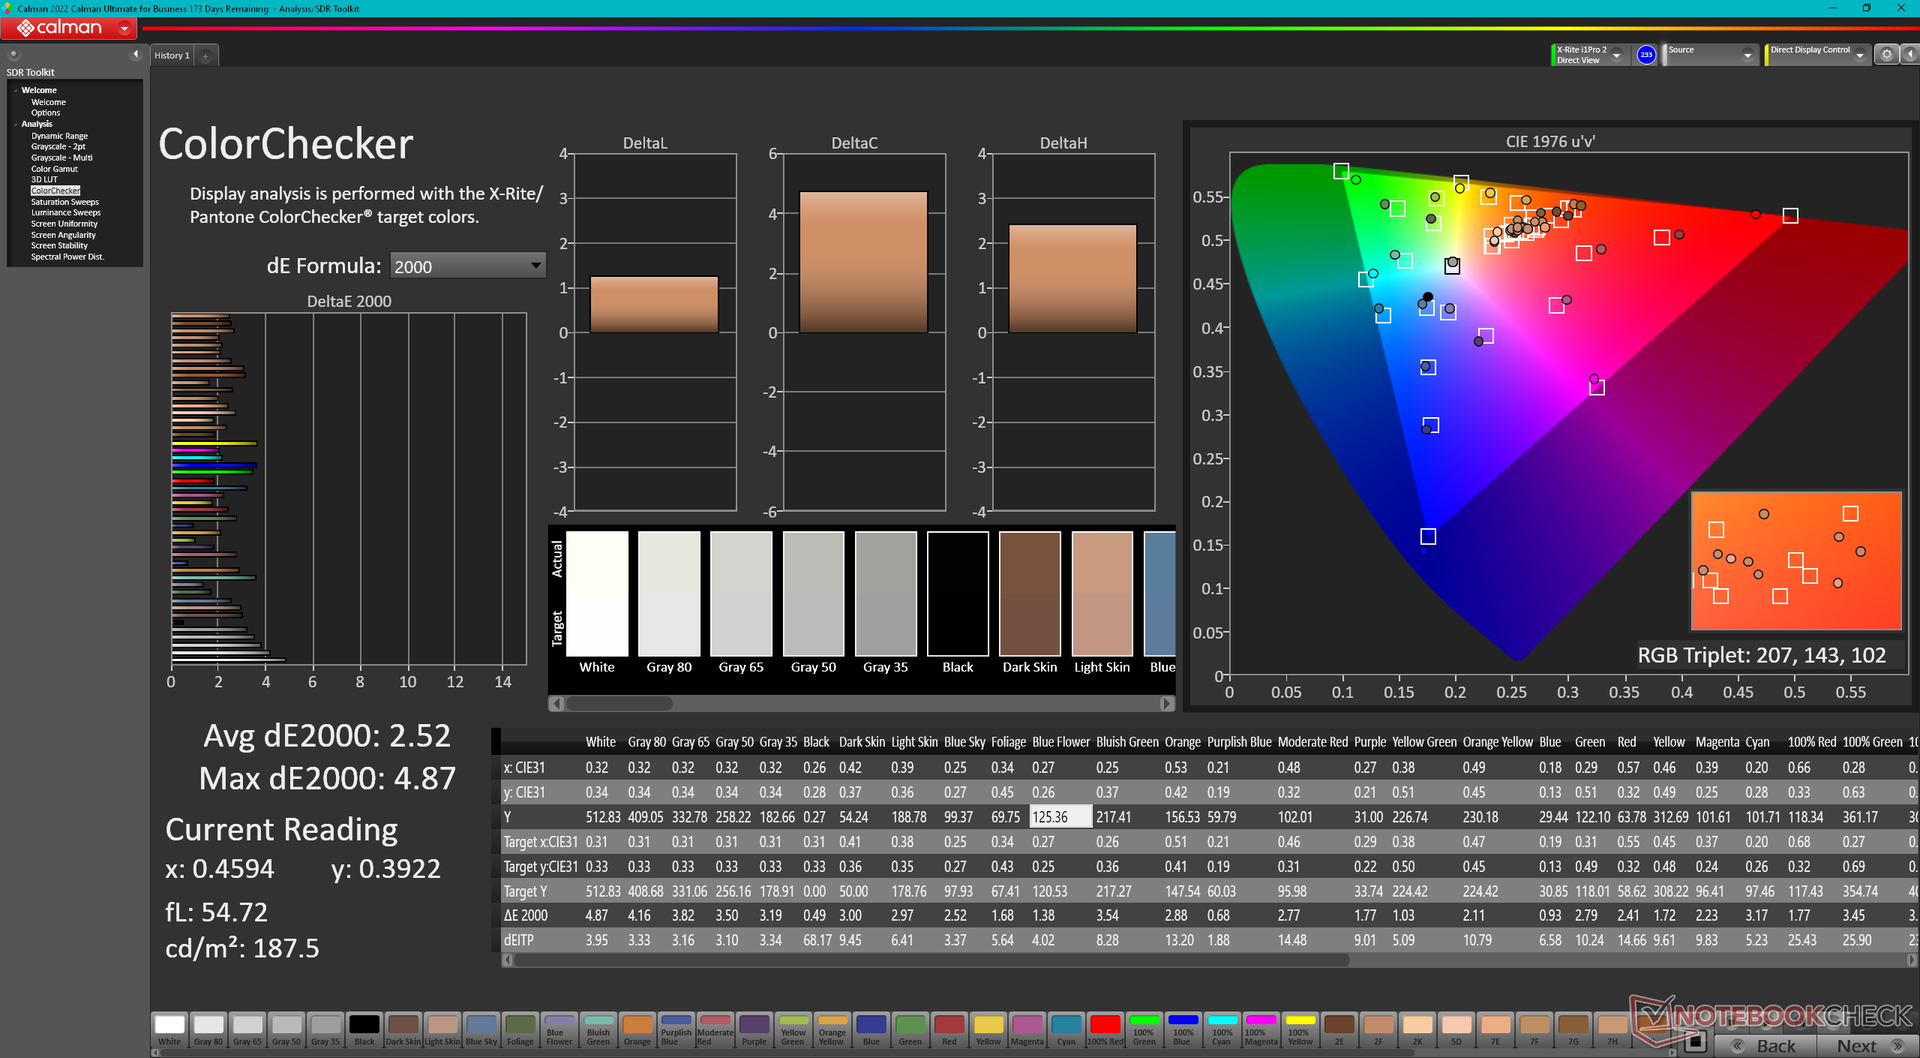
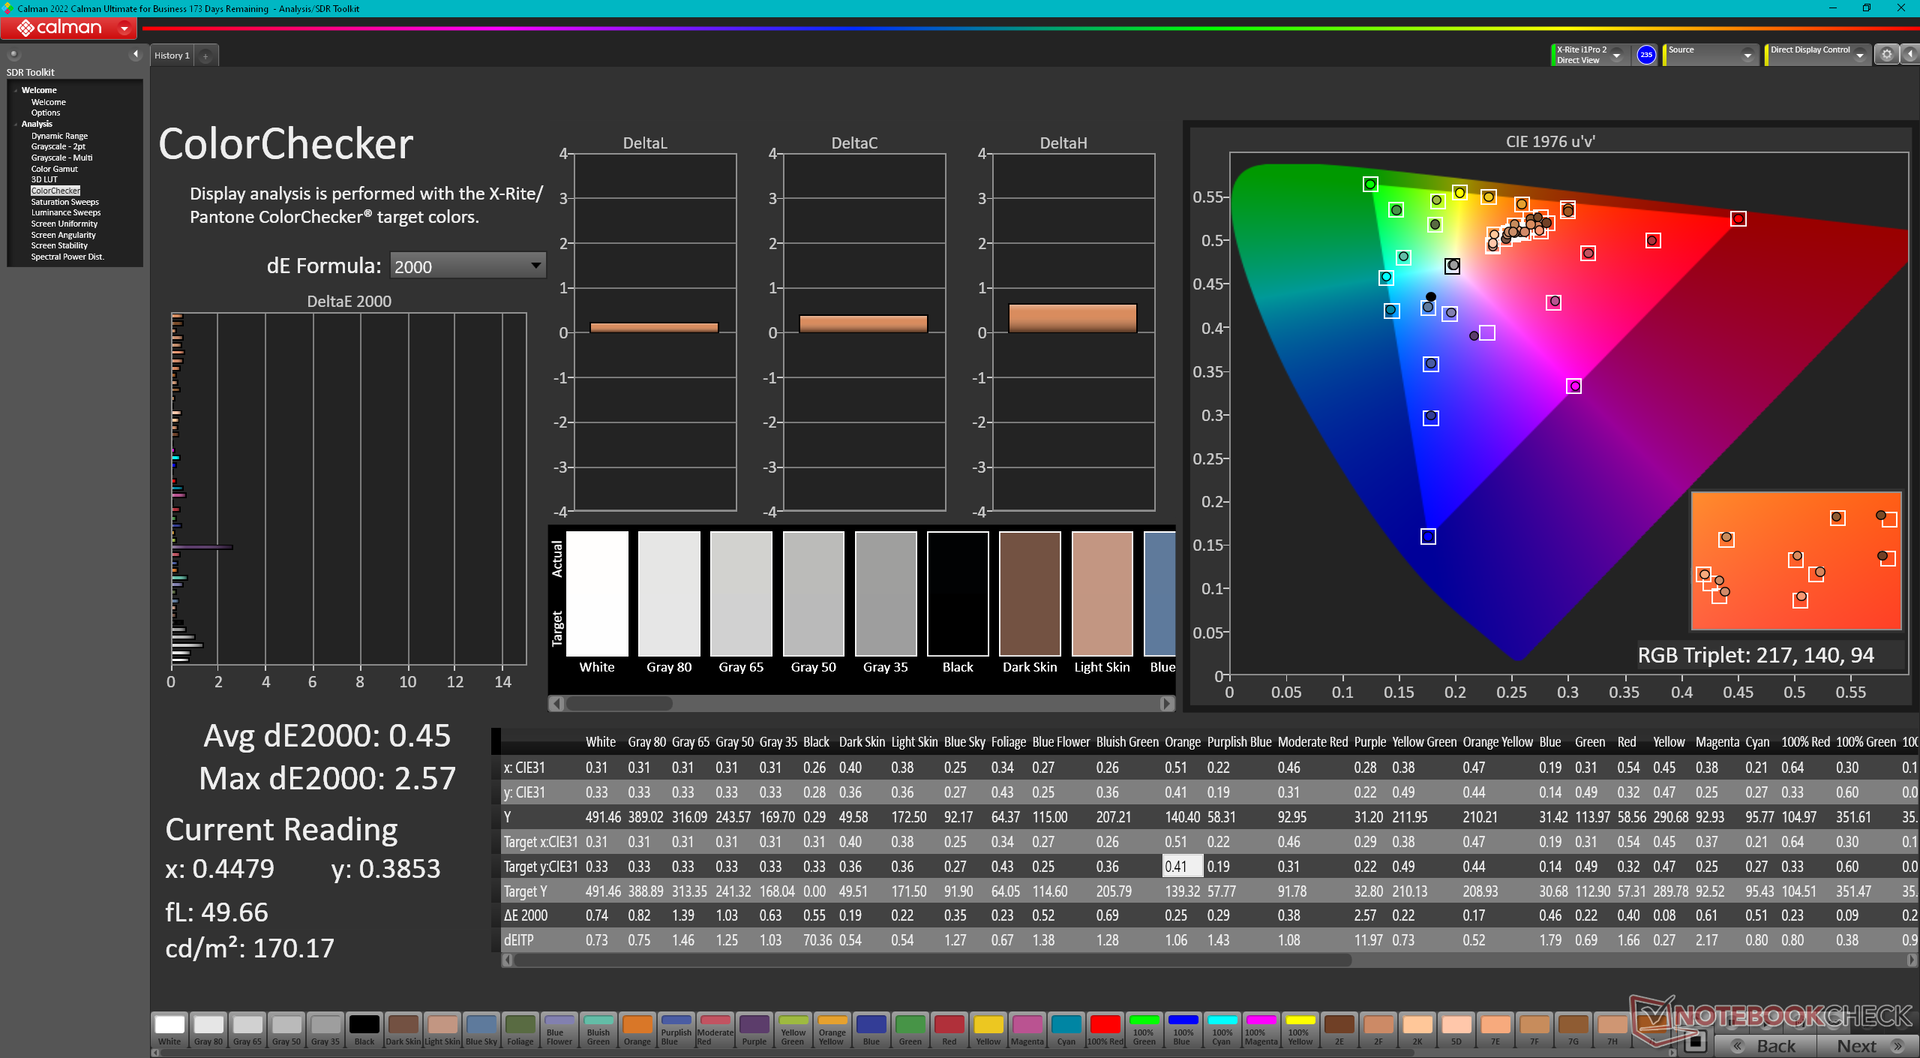
ΔE Color 2.52 | 0.5-29.43 Ø5, calibrated: 0.45
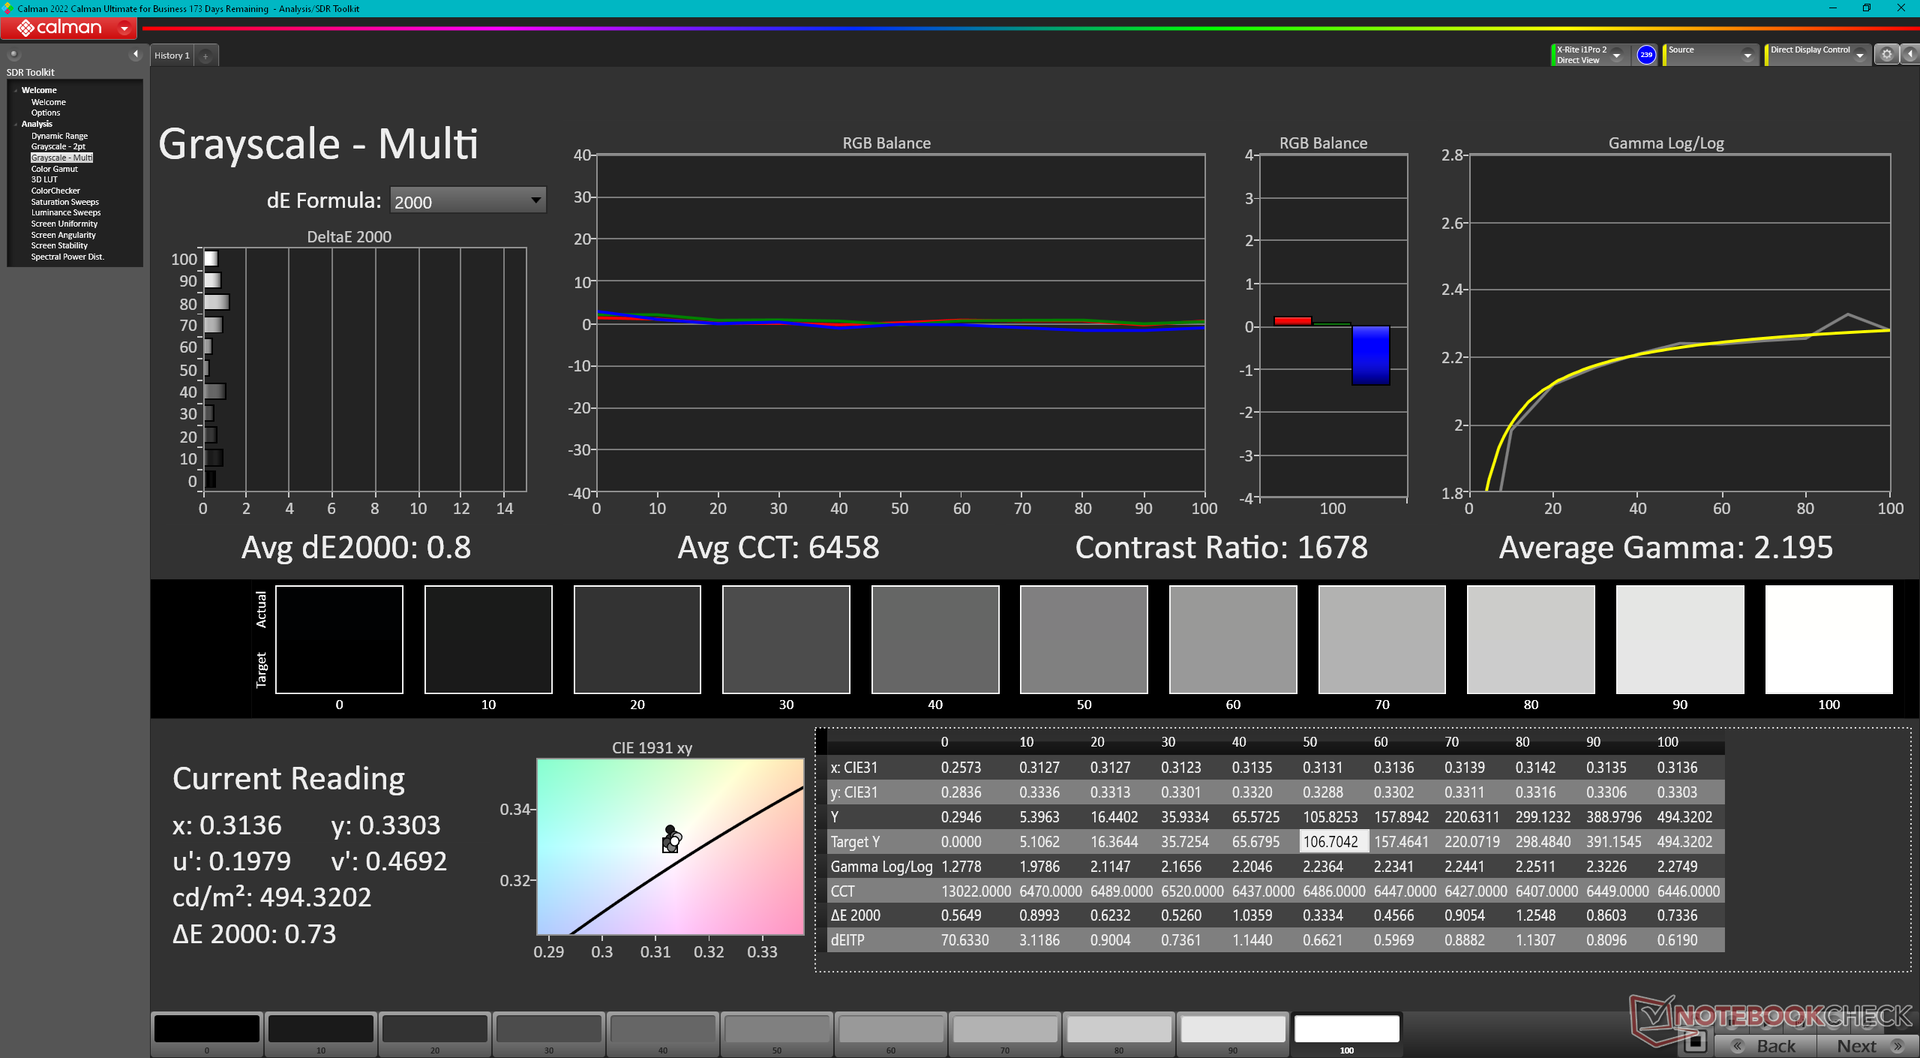
ΔE Greyscale 2.8 | 0.57-98 Ø5.3
80.1% AdobeRGB 1998 (Argyll 2.2.0 3D)
100% sRGB (Argyll 2.2.0 3D)
80.6% Display P3 (Argyll 2.2.0 3D)
Gamma: 2.17
| Dell Latitude 9450 2-in-1 AU Optronics B140QAN, IPS, 2560x1600, 14.00 | Dell Latitude 9440 2-in-1 AU Optronics B140QAN, IPS, 2560x1600, 14.00 | HP EliteBook 1040 G10 818N7EA CMN1435, IPS, 1920x1200, 14.00 | Asus Expertbook B5 Flip B5402F, i7-1360P N140HCE-EN2, IPS, 1920x1080, 14.00 | Lenovo Yoga 9 2-in-1 14IMH9 LEN140WQ+, OLED, 2880x1800, 14.00 | MSI Summit E14 Flip Evo A12MT AU Optronics B140QAN04.R, IPS, 2880x1800, 14.00 | |
|---|---|---|---|---|---|---|
| Display | -2% | -14% | -17% | 15% | 9% | |
| Display P3 Coverage | 80.6 | 77.2 -4% | 67.7 -16% | 62 -23% | 99.8 24% | 97.8 21% |
| sRGB Coverage | 100 | 99.6 0% | 88.1 -12% | 92.5 -7% | 100 0% | 99.9 0% |
| AdobeRGB 1998 Coverage | 80.1 | 77.4 -3% | 69.8 -13% | 64 -20% | 97.3 21% | 85.9 7% |
| Response Times | 9% | 15% | 38% | 98% | 65% | |
| Response Time Grey 50% / Grey 80% * | 59.6 ? | 53.5 ? 10% | 54.8 ? 8% | 31 ? 48% | 0.8 ? 99% | 16.9 ? 72% |
| Response Time Black / White * | 35.6 ? | 33 ? 7% | 28.3 ? 21% | 26 ? 27% | 1 ? 97% | 15.4 ? 57% |
| PWM Frequency | 240.5 ? | |||||
| Screen | -16% | -24% | -8% | -62% | -45% | |
| Brightness middle | 501.4 | 532.4 6% | 343 -32% | 373 -26% | 371.6 -26% | 496.7 -1% |
| Brightness | 491 | 502 2% | 330 -33% | 342 -30% | 373 -24% | 468 -5% |
| Brightness Distribution | 88 | 91 3% | 92 5% | 85 -3% | 99 13% | 87 -1% |
| Black Level * | 0.32 | 0.48 -50% | 0.19 41% | 0.2876 10% | 0.3 6% | |
| Contrast | 1567 | 1109 -29% | 1805 15% | 1297 -17% | 1656 6% | |
| Colorchecker dE 2000 * | 2.52 | 2.33 8% | 3 -19% | 1.7 33% | 4.91 -95% | 3.93 -56% |
| Colorchecker dE 2000 max. * | 4.87 | 5.99 -23% | 7 -44% | 3.55 27% | 8.33 -71% | 7.9 -62% |
| Colorchecker dE 2000 calibrated * | 0.45 | 0.92 -104% | 0.7 -56% | 0.71 -58% | 1.59 -253% | 1.27 -182% |
| Greyscale dE 2000 * | 2.8 | 1.6 43% | 5.4 -93% | 2.93 -5% | 2.2 21% | 5.9 -111% |
| Gamma | 2.17 101% | 2.17 101% | 2.14 103% | 2.119 104% | 2.25 98% | 2.04 108% |
| CCT | 6270 104% | 6314 103% | 7079 92% | 6765 96% | 6120 106% | 7618 85% |
| Total Average (Program / Settings) | -3% /
-10% | -8% /
-16% | 4% /
-3% | 17% /
-16% | 10% /
-18% |
* ... smaller is better
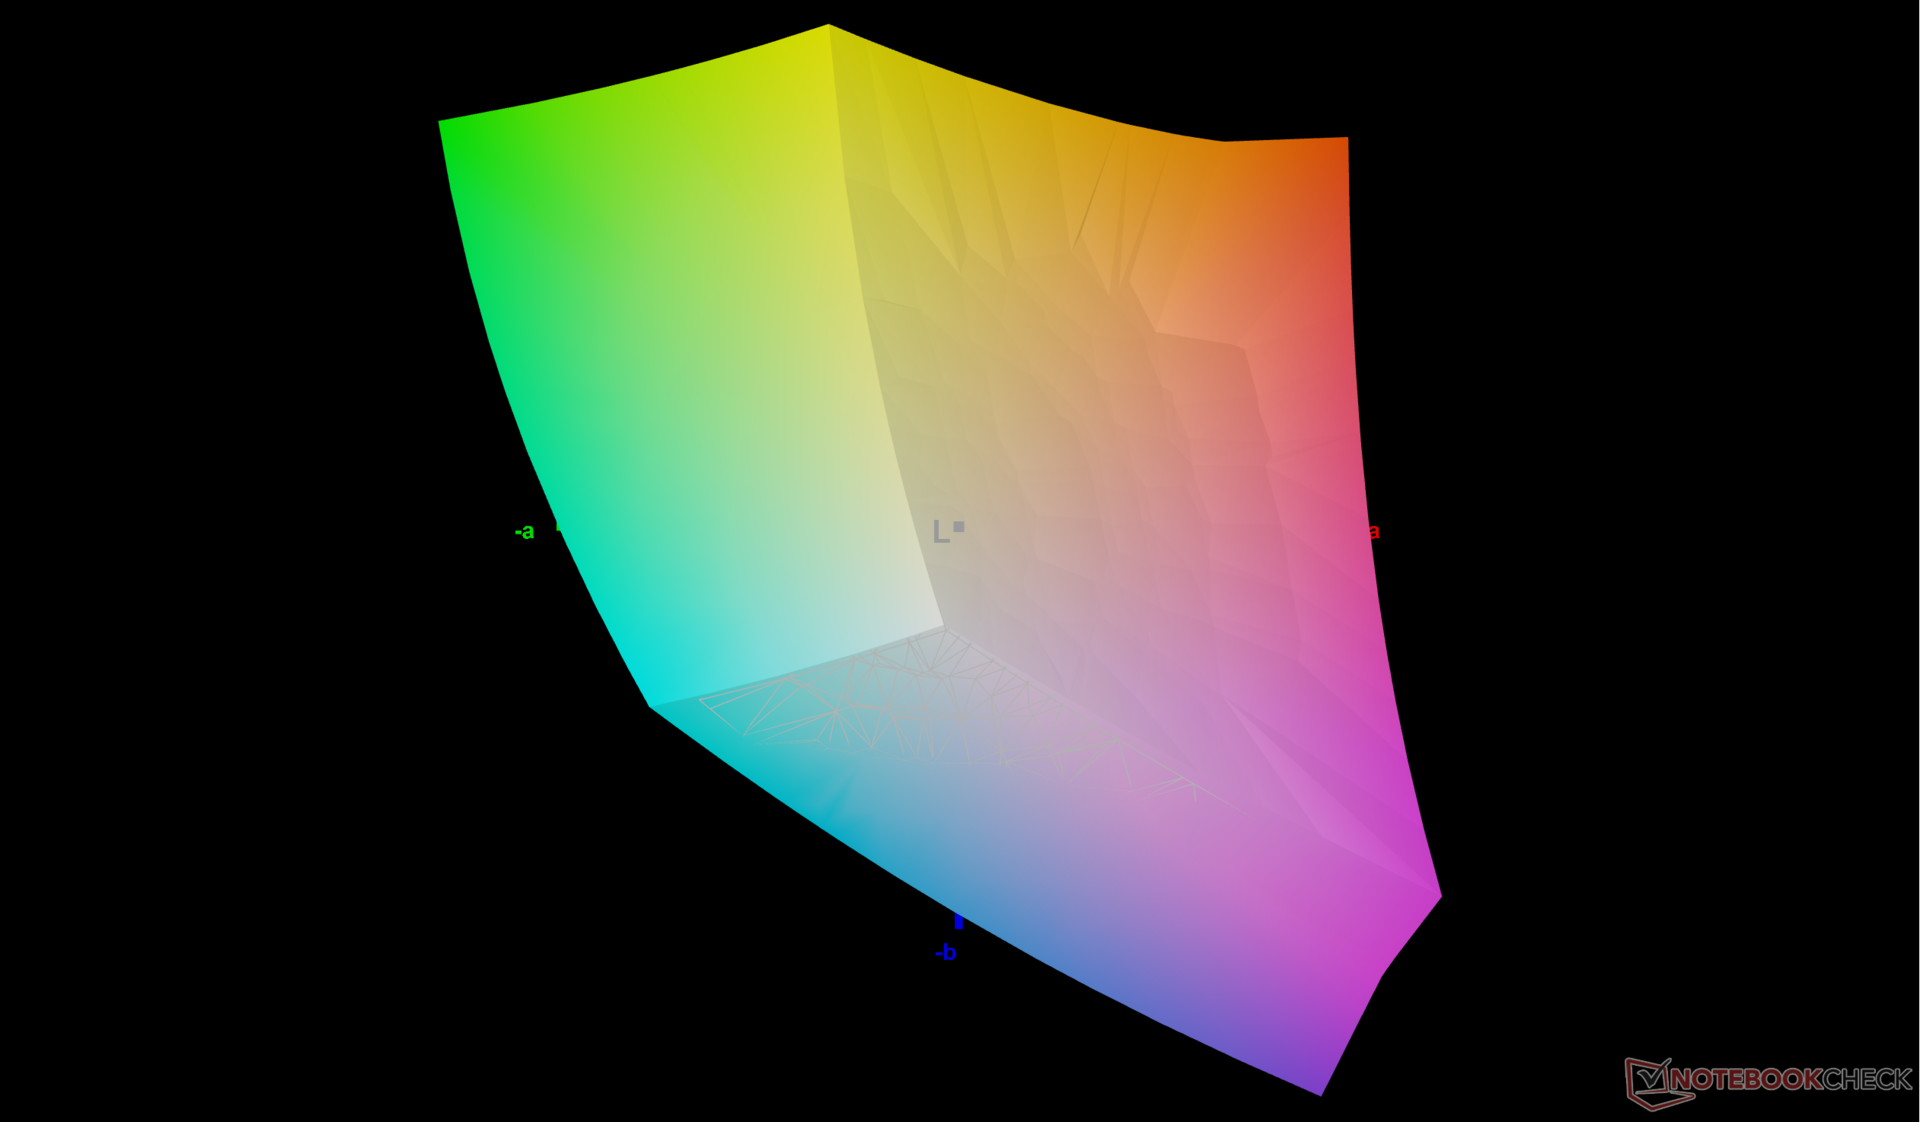
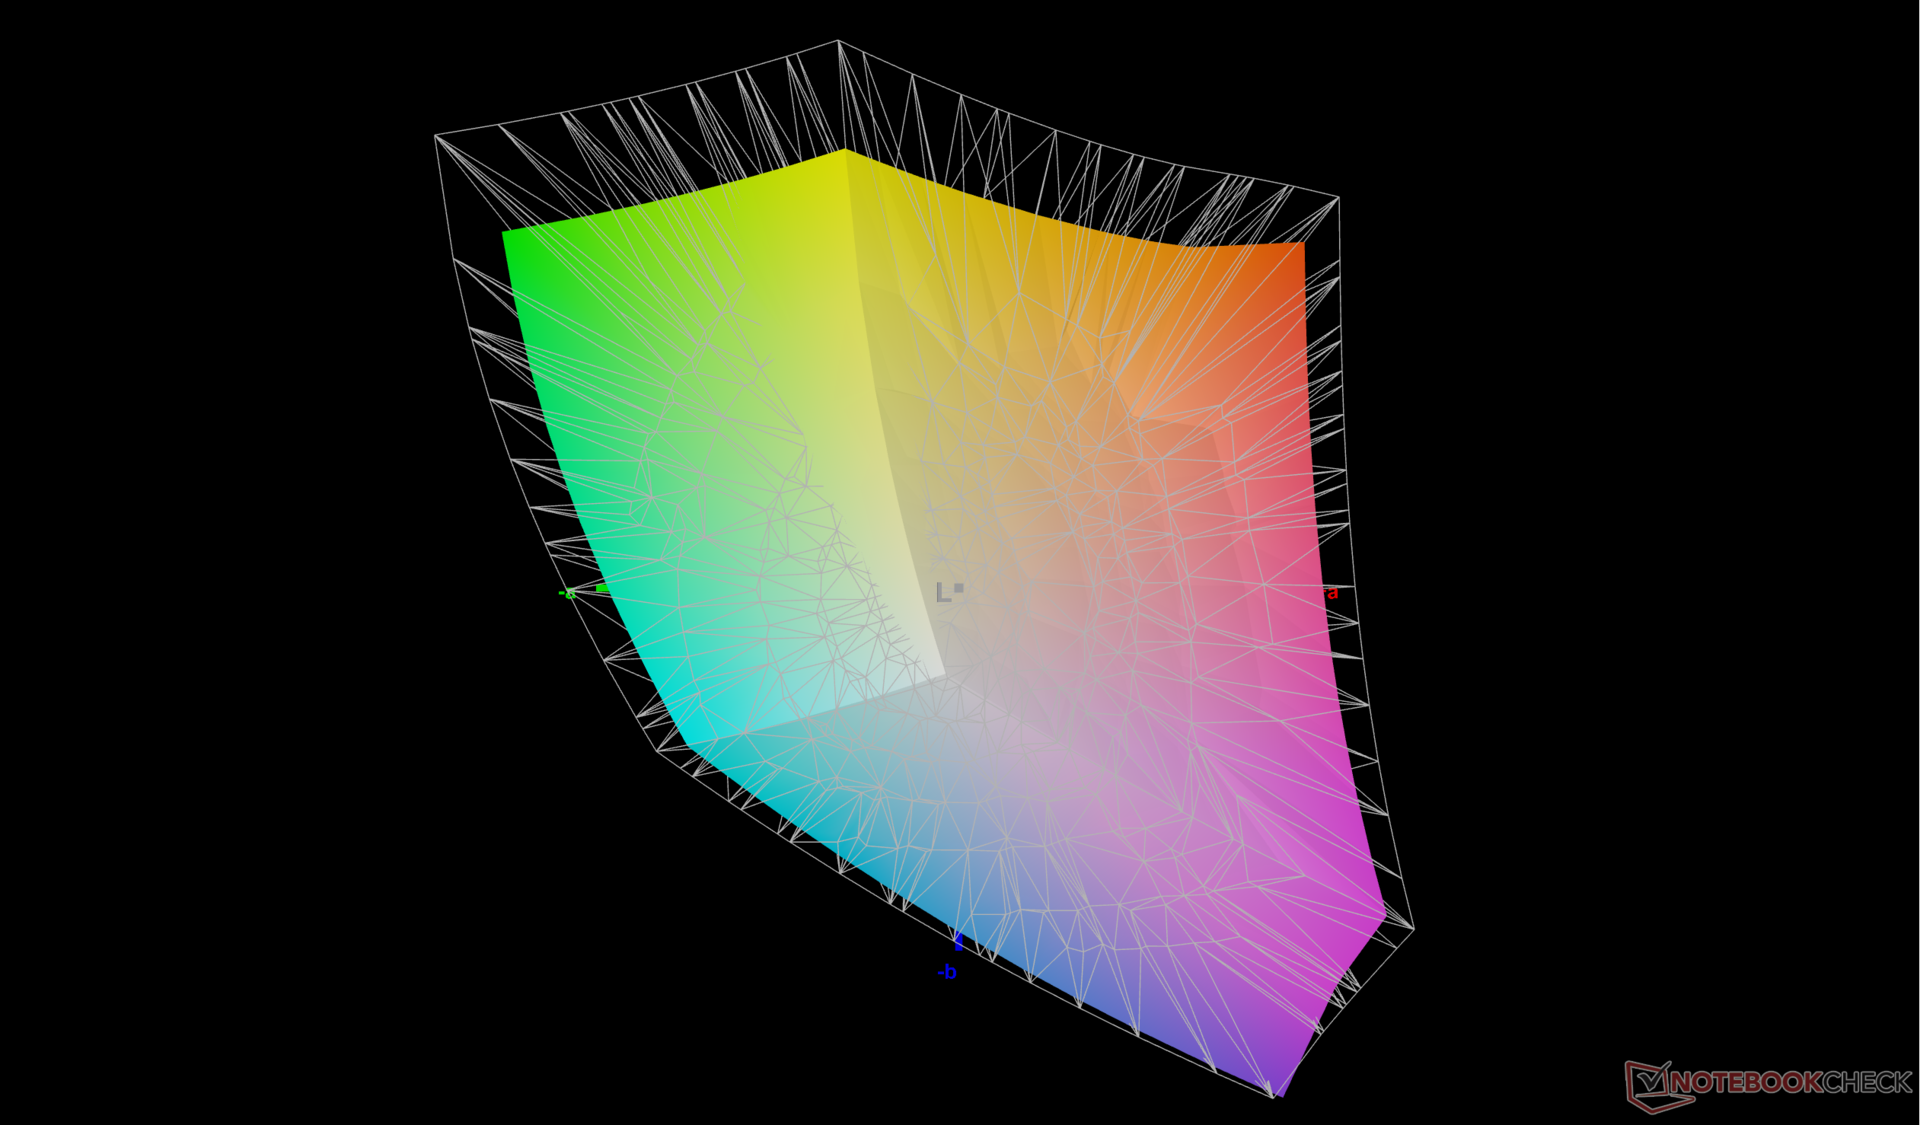
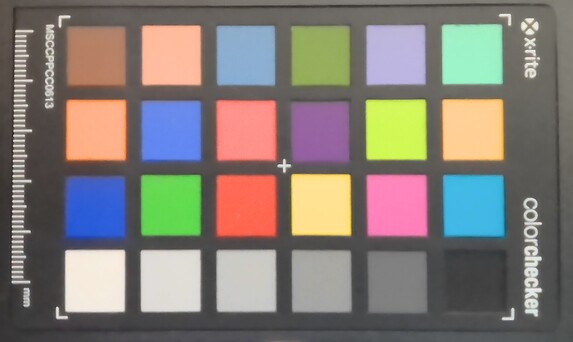
The display is set to P3 by default even though the the panel covers just 81 percent of the standard. Users may want to set the screen to sRGB instead since the panel is rated for 100% sRGB. Our caiibrated ICM profile is available to download above for free.
Display Response Times
| ↔ Response Time Black to White | ||
|---|---|---|
| 35.6 ms ... rise ↗ and fall ↘ combined | ↗ 17 ms rise | 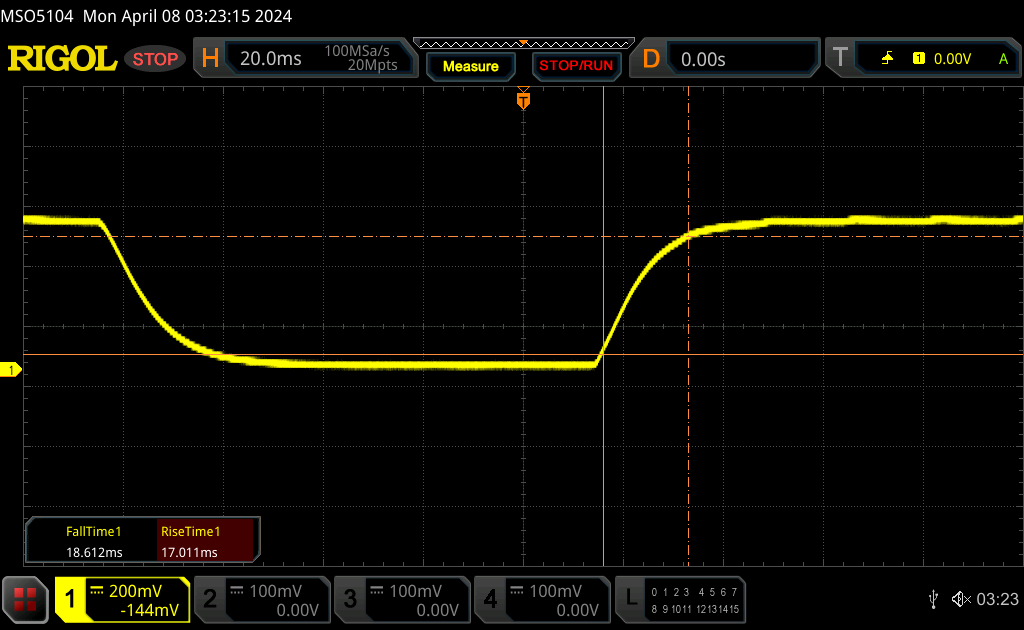 |
| ↘ 18.6 ms fall | ||
| The screen shows slow response rates in our tests and will be unsatisfactory for gamers. In comparison, all tested devices range from 0.1 (minimum) to 240 (maximum) ms. » 93 % of all devices are better. This means that the measured response time is worse than the average of all tested devices (21.5 ms). | ||
| ↔ Response Time 50% Grey to 80% Grey | ||
| 59.6 ms ... rise ↗ and fall ↘ combined | ↗ 27.8 ms rise | 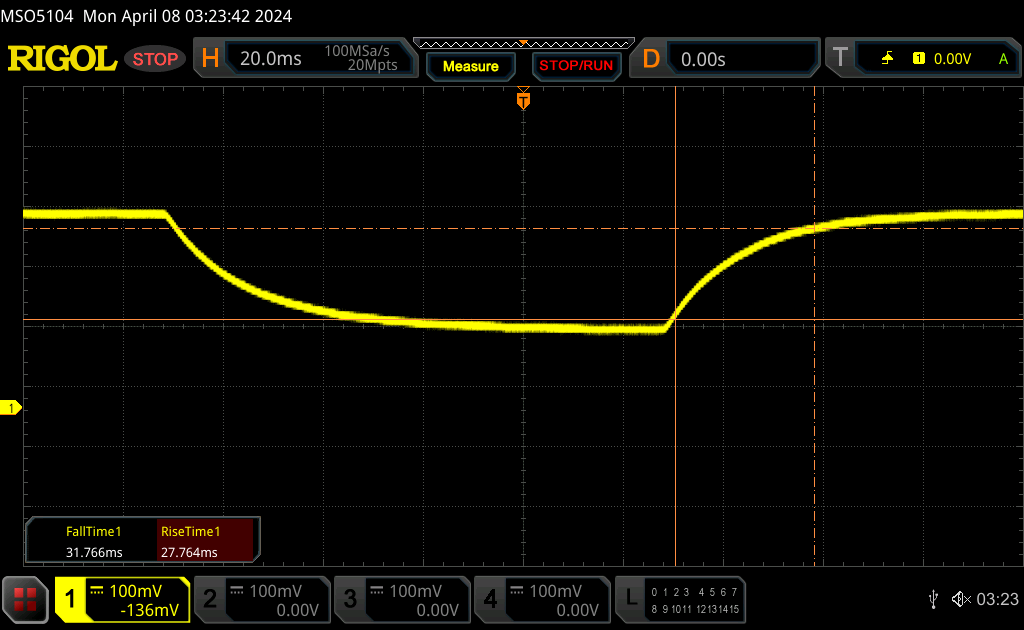 |
| ↘ 31.8 ms fall | ||
| The screen shows slow response rates in our tests and will be unsatisfactory for gamers. In comparison, all tested devices range from 0.2 (minimum) to 636 (maximum) ms. » 95 % of all devices are better. This means that the measured response time is worse than the average of all tested devices (33.7 ms). | ||
Screen Flickering / PWM (Pulse-Width Modulation)
| Screen flickering / PWM not detected | 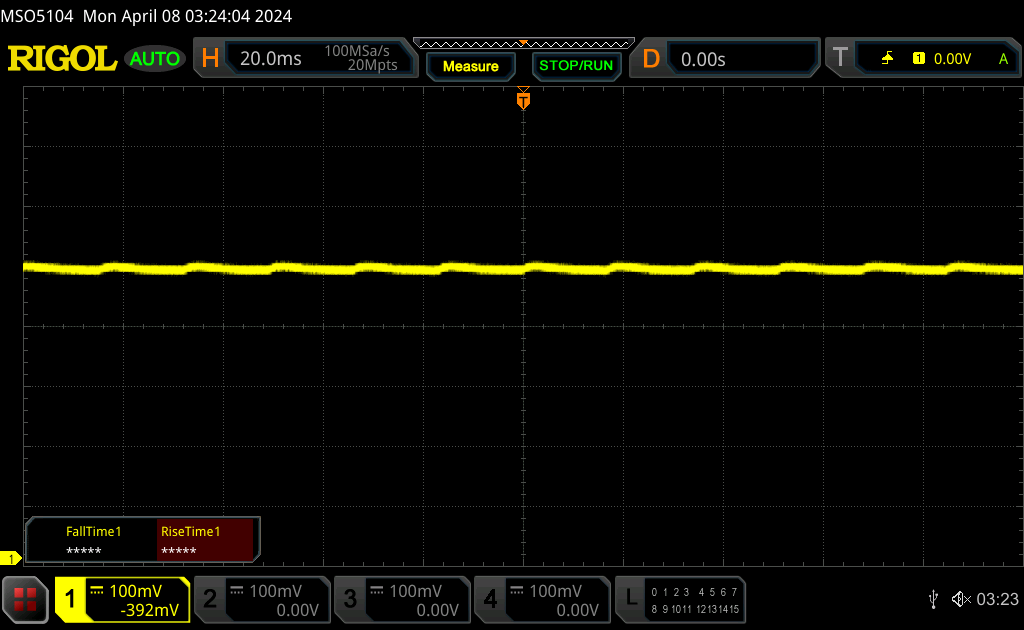 | ||
In comparison: 53 % of all tested devices do not use PWM to dim the display. If PWM was detected, an average of 17908 (minimum: 5 - maximum: 3846000) Hz was measured. | |||
Performance — Meteor Lake-U vs. Meteor Lake-H
Testing Conditions
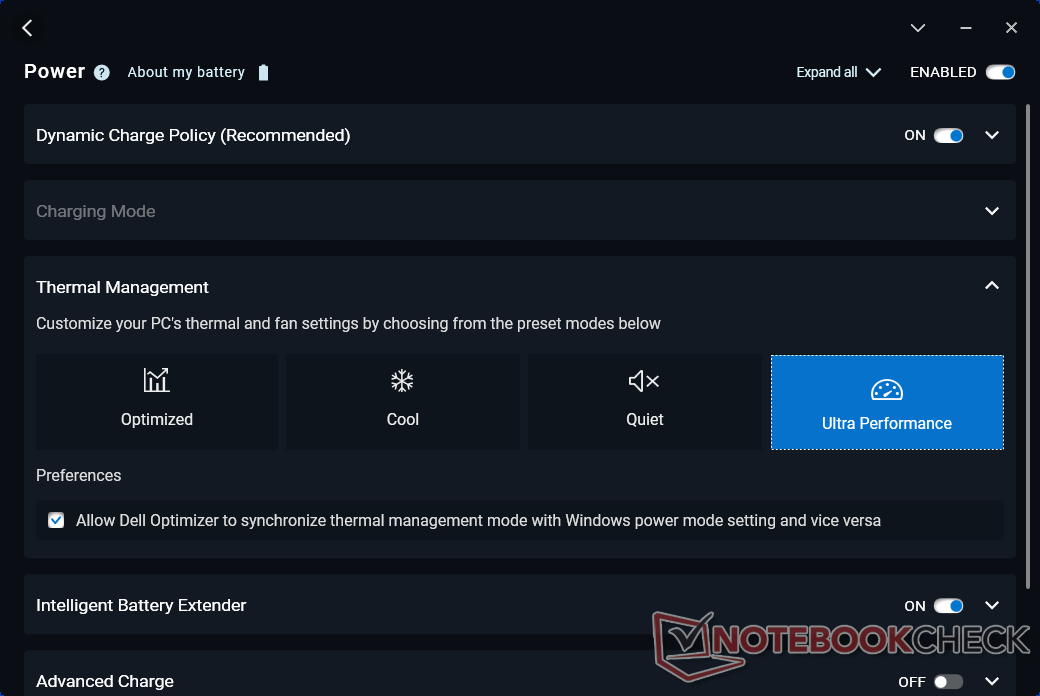
We set Dell Optimizer to Ultra Performance mode prior to running the benchmarks below.
Processor
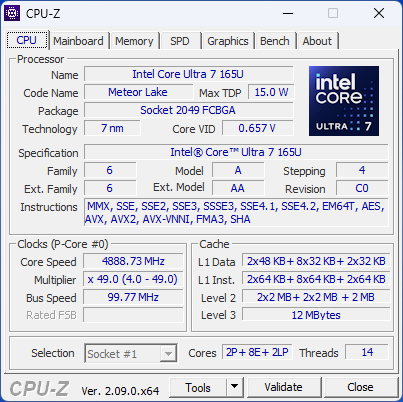
The Core Ultra 7 165U is the vPro version of the Core Ultra 7 155U. Both cache sizes and target clock rates are essentially the same between them except that the Core Ultra 7 165U targets a +100 MHz higher maximum. In practice, however, the Core Ultra 7 165H is not inherently any faster than the Core Ultra 7 155U.
Unfortunately, the Core Ultra 165U in our Dell is somewhat underwhelming with results that are neck-to-neck with the older Ryzen 7 7730U. It's still faster than the Core i7-1365U in last year's Latitude 9440 2-in-1 by about 10 to 15 percent, but the general performance uptick is relatively minor all things considered.
Cinebench R15 Multi Loop
Cinebench R23: Multi Core | Single Core
Cinebench R20: CPU (Multi Core) | CPU (Single Core)
Cinebench R15: CPU Multi 64Bit | CPU Single 64Bit
Blender: v2.79 BMW27 CPU
7-Zip 18.03: 7z b 4 | 7z b 4 -mmt1
Geekbench 6.2: Multi-Core | Single-Core
Geekbench 5.5: Multi-Core | Single-Core
HWBOT x265 Benchmark v2.2: 4k Preset
LibreOffice : 20 Documents To PDF
R Benchmark 2.5: Overall mean
| CPU Performance Rating | |
| Lenovo IdeaPad Pro 5 14AHP9 | |
| Lenovo ThinkPad P14s G4 21HF0017GE | |
| Lenovo Yoga 9 2-in-1 14IMH9 | |
| Lenovo ThinkPad T14s G4-21F8002TGE | |
| Asus Expertbook B5 Flip B5402F, i7-1360P | |
| Lenovo IdeaPad Slim 5 14IMH9 -1! | |
| Dell Latitude 9450 2-in-1 | |
| Average Intel Core Ultra 7 165U | |
| HP Dragonfly Pro 2023 -4! | |
| Dell Latitude 9440 2-in-1 -3! | |
| Lenovo ThinkPad P14s G3 AMD 21J6S05000 -2! | |
| Lenovo ThinkPad E14 G5-21JSS05C00 | |
| Lenovo ThinkPad X1 Carbon G10 21CB00DCGE -2! | |
| HP EliteBook 1040 G10 818N7EA | |
| HP ProBook 445 G10 | |
| LG Gram 14Z90Q -2! | |
| Asus F415EA-EK115W -2! | |
| Cinebench R20 / CPU (Multi Core) | |
| Lenovo IdeaPad Pro 5 14AHP9 | |
| Lenovo ThinkPad P14s G4 21HF0017GE | |
| Lenovo Yoga 9 2-in-1 14IMH9 | |
| Lenovo IdeaPad Slim 5 14IMH9 | |
| Lenovo ThinkPad T14s G4-21F8002TGE | |
| Lenovo ThinkPad P14s G3 AMD 21J6S05000 | |
| Dell Latitude 9450 2-in-1 | |
| Average Intel Core Ultra 7 165U () | |
| Lenovo ThinkPad E14 G5-21JSS05C00 | |
| Asus Expertbook B5 Flip B5402F, i7-1360P | |
| Lenovo ThinkPad X1 Carbon G10 21CB00DCGE | |
| Dell Latitude 9440 2-in-1 | |
| HP ProBook 445 G10 | |
| HP EliteBook 1040 G10 818N7EA | |
| Asus F415EA-EK115W | |
| LG Gram 14Z90Q | |
| Cinebench R20 / CPU (Single Core) | |
| Lenovo ThinkPad P14s G4 21HF0017GE | |
| Asus Expertbook B5 Flip B5402F, i7-1360P | |
| Dell Latitude 9440 2-in-1 | |
| Lenovo Yoga 9 2-in-1 14IMH9 | |
| Lenovo ThinkPad T14s G4-21F8002TGE | |
| Lenovo IdeaPad Pro 5 14AHP9 | |
| Dell Latitude 9450 2-in-1 | |
| Average Intel Core Ultra 7 165U () | |
| HP EliteBook 1040 G10 818N7EA | |
| Lenovo IdeaPad Slim 5 14IMH9 | |
| Lenovo ThinkPad X1 Carbon G10 21CB00DCGE | |
| Lenovo ThinkPad P14s G3 AMD 21J6S05000 | |
| Lenovo ThinkPad E14 G5-21JSS05C00 | |
| HP ProBook 445 G10 | |
| Asus F415EA-EK115W | |
| LG Gram 14Z90Q | |
| Geekbench 6.2 / Multi-Core | |
| Lenovo Yoga 9 2-in-1 14IMH9 | |
| Lenovo IdeaPad Pro 5 14AHP9 | |
| Lenovo ThinkPad P14s G4 21HF0017GE | |
| Asus Expertbook B5 Flip B5402F, i7-1360P | |
| Lenovo IdeaPad Slim 5 14IMH9 | |
| Lenovo ThinkPad T14s G4-21F8002TGE | |
| Dell Latitude 9450 2-in-1 | |
| Average Intel Core Ultra 7 165U () | |
| HP EliteBook 1040 G10 818N7EA | |
| Lenovo ThinkPad E14 G5-21JSS05C00 | |
| HP ProBook 445 G10 | |
| Geekbench 6.2 / Single-Core | |
| Lenovo ThinkPad P14s G4 21HF0017GE | |
| Asus Expertbook B5 Flip B5402F, i7-1360P | |
| Lenovo IdeaPad Pro 5 14AHP9 | |
| Lenovo Yoga 9 2-in-1 14IMH9 | |
| Lenovo ThinkPad T14s G4-21F8002TGE | |
| HP EliteBook 1040 G10 818N7EA | |
| Dell Latitude 9450 2-in-1 | |
| Average Intel Core Ultra 7 165U () | |
| Lenovo IdeaPad Slim 5 14IMH9 | |
| Lenovo ThinkPad E14 G5-21JSS05C00 | |
| HP ProBook 445 G10 | |
| HWBOT x265 Benchmark v2.2 / 4k Preset | |
| Lenovo IdeaPad Pro 5 14AHP9 | |
| HP Dragonfly Pro 2023 | |
| Lenovo ThinkPad P14s G4 21HF0017GE | |
| Lenovo ThinkPad T14s G4-21F8002TGE | |
| Lenovo IdeaPad Slim 5 14IMH9 | |
| Lenovo Yoga 9 2-in-1 14IMH9 | |
| Lenovo ThinkPad P14s G3 AMD 21J6S05000 | |
| Lenovo ThinkPad E14 G5-21JSS05C00 | |
| Asus Expertbook B5 Flip B5402F, i7-1360P | |
| Dell Latitude 9450 2-in-1 | |
| Average Intel Core Ultra 7 165U () | |
| Dell Latitude 9440 2-in-1 | |
| HP ProBook 445 G10 | |
| Lenovo ThinkPad X1 Carbon G10 21CB00DCGE | |
| LG Gram 14Z90Q | |
| HP EliteBook 1040 G10 818N7EA | |
| Asus F415EA-EK115W | |
Cinebench R23: Multi Core | Single Core
Cinebench R20: CPU (Multi Core) | CPU (Single Core)
Cinebench R15: CPU Multi 64Bit | CPU Single 64Bit
Blender: v2.79 BMW27 CPU
7-Zip 18.03: 7z b 4 | 7z b 4 -mmt1
Geekbench 6.2: Multi-Core | Single-Core
Geekbench 5.5: Multi-Core | Single-Core
HWBOT x265 Benchmark v2.2: 4k Preset
LibreOffice : 20 Documents To PDF
R Benchmark 2.5: Overall mean
* ... smaller is better
AIDA64: FP32 Ray-Trace | FPU Julia | CPU SHA3 | CPU Queen | FPU SinJulia | FPU Mandel | CPU AES | CPU ZLib | FP64 Ray-Trace | CPU PhotoWorxx
| Performance Rating | |
| Lenovo Yoga 9 2-in-1 14IMH9 | |
| Dell Latitude 9450 2-in-1 | |
| Average Intel Core Ultra 7 165U | |
| Asus Expertbook B5 Flip B5402F, i7-1360P | |
| Dell Latitude 9440 2-in-1 | |
| MSI Summit E14 Flip Evo A12MT | |
| HP EliteBook 1040 G10 818N7EA | |
| AIDA64 / FP32 Ray-Trace | |
| Lenovo Yoga 9 2-in-1 14IMH9 | |
| Dell Latitude 9450 2-in-1 | |
| Average Intel Core Ultra 7 165U () | |
| Dell Latitude 9440 2-in-1 | |
| Asus Expertbook B5 Flip B5402F, i7-1360P | |
| HP EliteBook 1040 G10 818N7EA | |
| MSI Summit E14 Flip Evo A12MT | |
| AIDA64 / FPU Julia | |
| Lenovo Yoga 9 2-in-1 14IMH9 | |
| Asus Expertbook B5 Flip B5402F, i7-1360P | |
| Dell Latitude 9450 2-in-1 | |
| Average Intel Core Ultra 7 165U () | |
| Dell Latitude 9440 2-in-1 | |
| HP EliteBook 1040 G10 818N7EA | |
| MSI Summit E14 Flip Evo A12MT | |
| AIDA64 / CPU SHA3 | |
| Lenovo Yoga 9 2-in-1 14IMH9 | |
| Dell Latitude 9450 2-in-1 | |
| Average Intel Core Ultra 7 165U () | |
| Asus Expertbook B5 Flip B5402F, i7-1360P | |
| Dell Latitude 9440 2-in-1 | |
| MSI Summit E14 Flip Evo A12MT | |
| HP EliteBook 1040 G10 818N7EA | |
| AIDA64 / CPU Queen | |
| Asus Expertbook B5 Flip B5402F, i7-1360P | |
| Lenovo Yoga 9 2-in-1 14IMH9 | |
| MSI Summit E14 Flip Evo A12MT | |
| Dell Latitude 9440 2-in-1 | |
| HP EliteBook 1040 G10 818N7EA | |
| Dell Latitude 9450 2-in-1 | |
| Average Intel Core Ultra 7 165U () | |
| AIDA64 / FPU SinJulia | |
| Lenovo Yoga 9 2-in-1 14IMH9 | |
| MSI Summit E14 Flip Evo A12MT | |
| Asus Expertbook B5 Flip B5402F, i7-1360P | |
| Dell Latitude 9450 2-in-1 | |
| Average Intel Core Ultra 7 165U () | |
| Dell Latitude 9440 2-in-1 | |
| HP EliteBook 1040 G10 818N7EA | |
| AIDA64 / FPU Mandel | |
| Lenovo Yoga 9 2-in-1 14IMH9 | |
| Asus Expertbook B5 Flip B5402F, i7-1360P | |
| Dell Latitude 9450 2-in-1 | |
| Average Intel Core Ultra 7 165U () | |
| Dell Latitude 9440 2-in-1 | |
| HP EliteBook 1040 G10 818N7EA | |
| MSI Summit E14 Flip Evo A12MT | |
| AIDA64 / CPU AES | |
| Lenovo Yoga 9 2-in-1 14IMH9 | |
| Asus Expertbook B5 Flip B5402F, i7-1360P | |
| Dell Latitude 9450 2-in-1 | |
| Average Intel Core Ultra 7 165U () | |
| Dell Latitude 9440 2-in-1 | |
| MSI Summit E14 Flip Evo A12MT | |
| HP EliteBook 1040 G10 818N7EA | |
| AIDA64 / CPU ZLib | |
| Lenovo Yoga 9 2-in-1 14IMH9 | |
| Dell Latitude 9450 2-in-1 | |
| Average Intel Core Ultra 7 165U () | |
| Asus Expertbook B5 Flip B5402F, i7-1360P | |
| Dell Latitude 9440 2-in-1 | |
| MSI Summit E14 Flip Evo A12MT | |
| HP EliteBook 1040 G10 818N7EA | |
| AIDA64 / FP64 Ray-Trace | |
| Lenovo Yoga 9 2-in-1 14IMH9 | |
| Dell Latitude 9450 2-in-1 | |
| Average Intel Core Ultra 7 165U () | |
| Dell Latitude 9440 2-in-1 | |
| Asus Expertbook B5 Flip B5402F, i7-1360P | |
| HP EliteBook 1040 G10 818N7EA | |
| MSI Summit E14 Flip Evo A12MT | |
| AIDA64 / CPU PhotoWorxx | |
| Dell Latitude 9450 2-in-1 | |
| Average Intel Core Ultra 7 165U () | |
| Lenovo Yoga 9 2-in-1 14IMH9 | |
| Dell Latitude 9440 2-in-1 | |
| MSI Summit E14 Flip Evo A12MT | |
| Asus Expertbook B5 Flip B5402F, i7-1360P | |
| HP EliteBook 1040 G10 818N7EA | |
Stress Test
CPU Turbo Boost sustainability is limited which aligns with the underwhelming CineBench results mentioned above. When running Prime95, for example, clock rate and board power draw would be as high as 3.4 GHz and 44 W, respectively, before slowly but steadily falling to just 2.2 GHz and 21 W after several minutes to keep temperatures in check. Our screenshot below shows core temperature reaching 102 C when Turbo Boost is unrestrained.
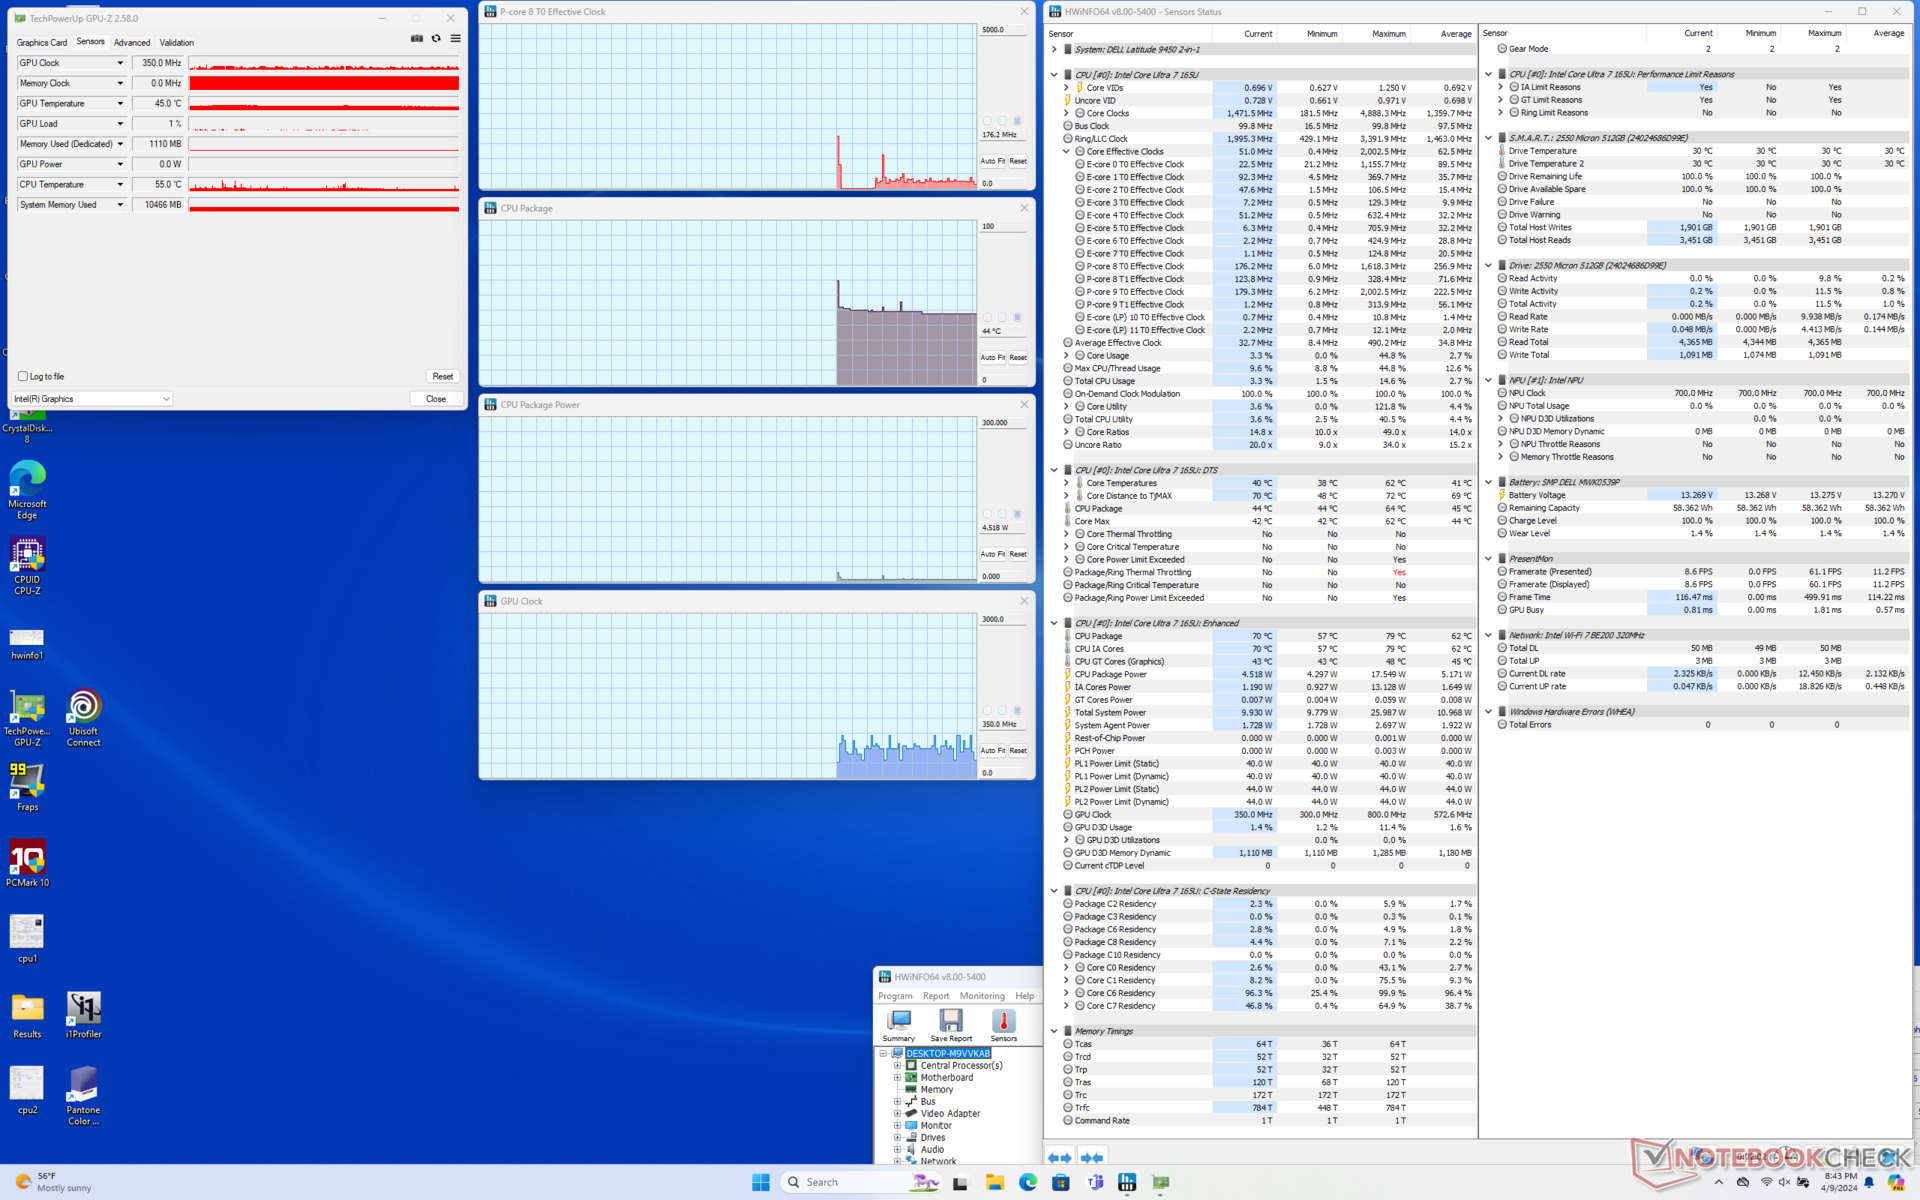
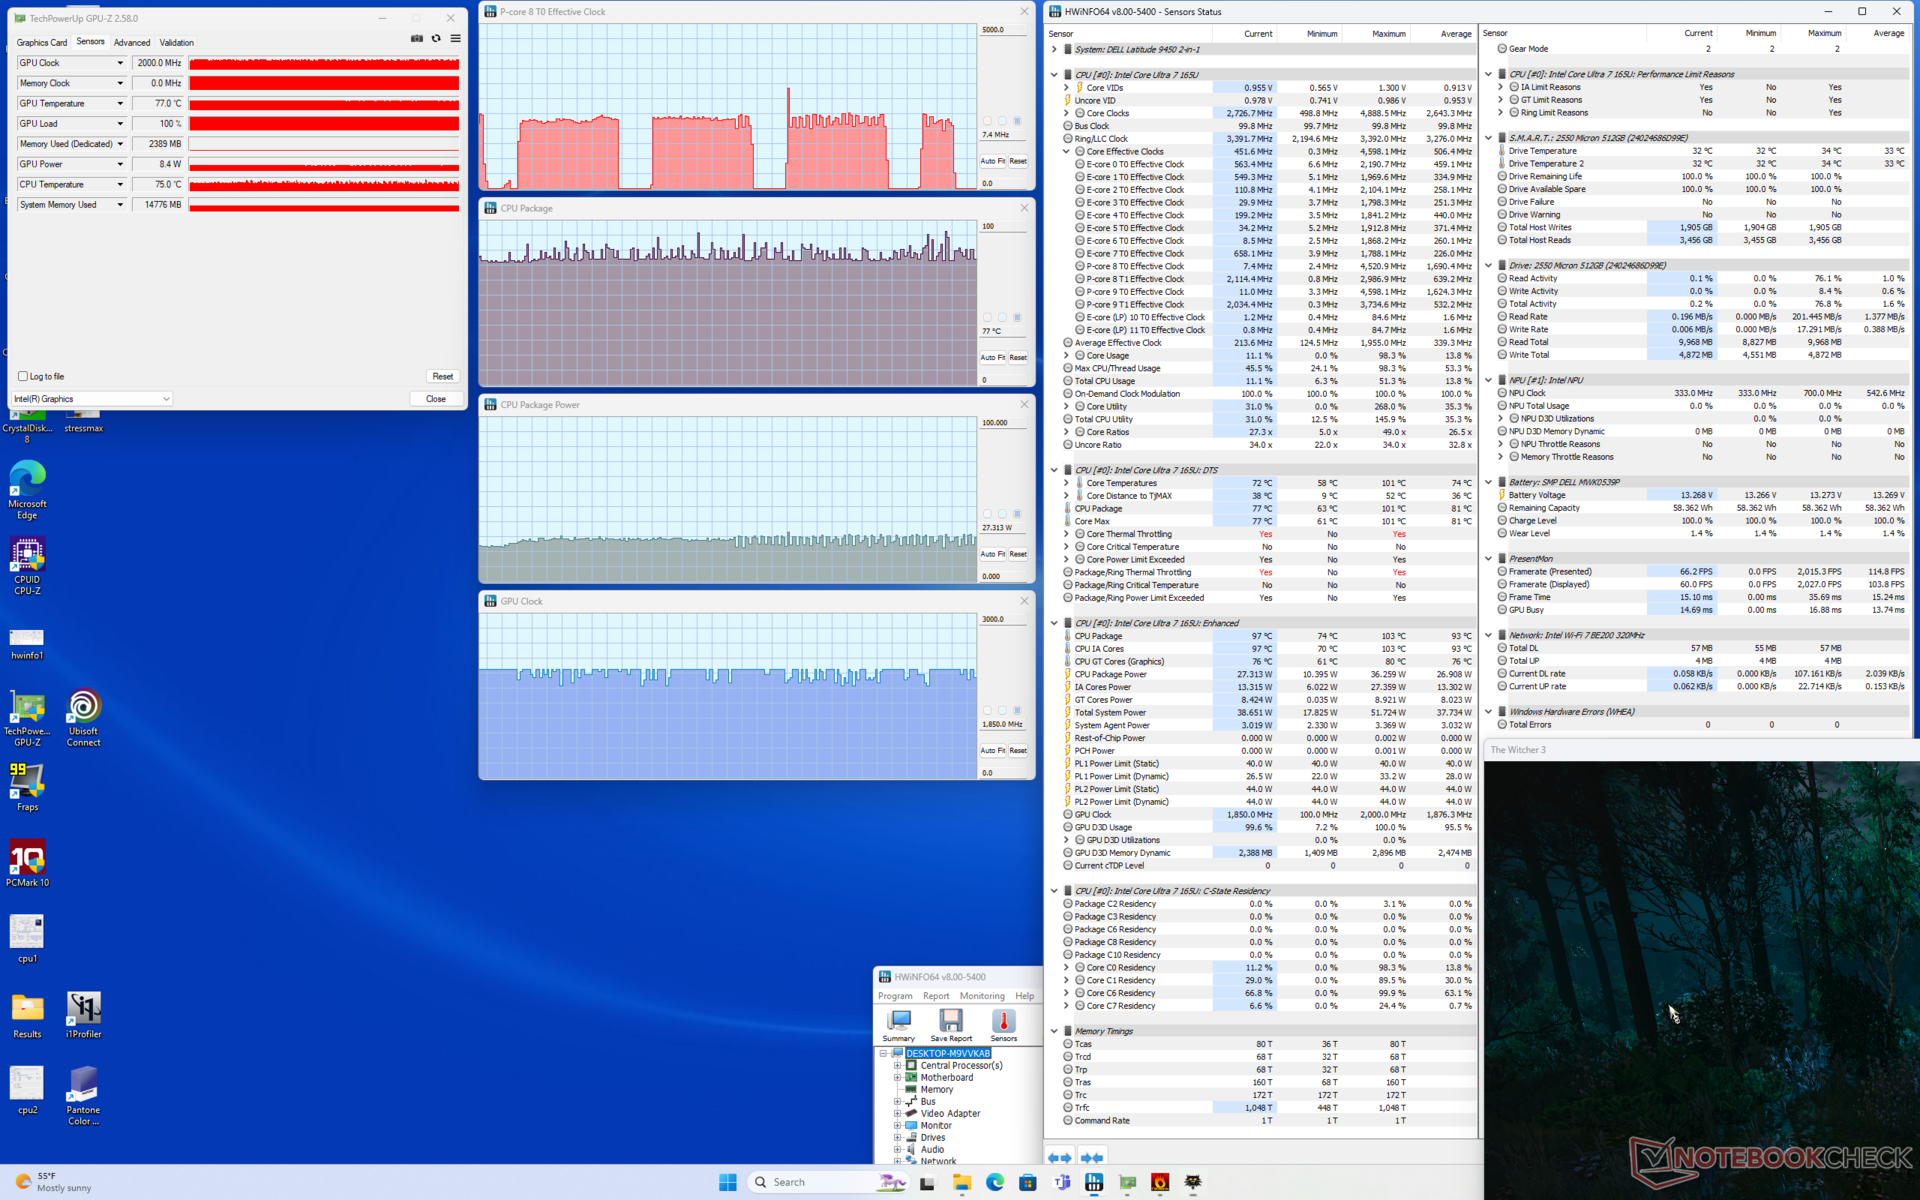
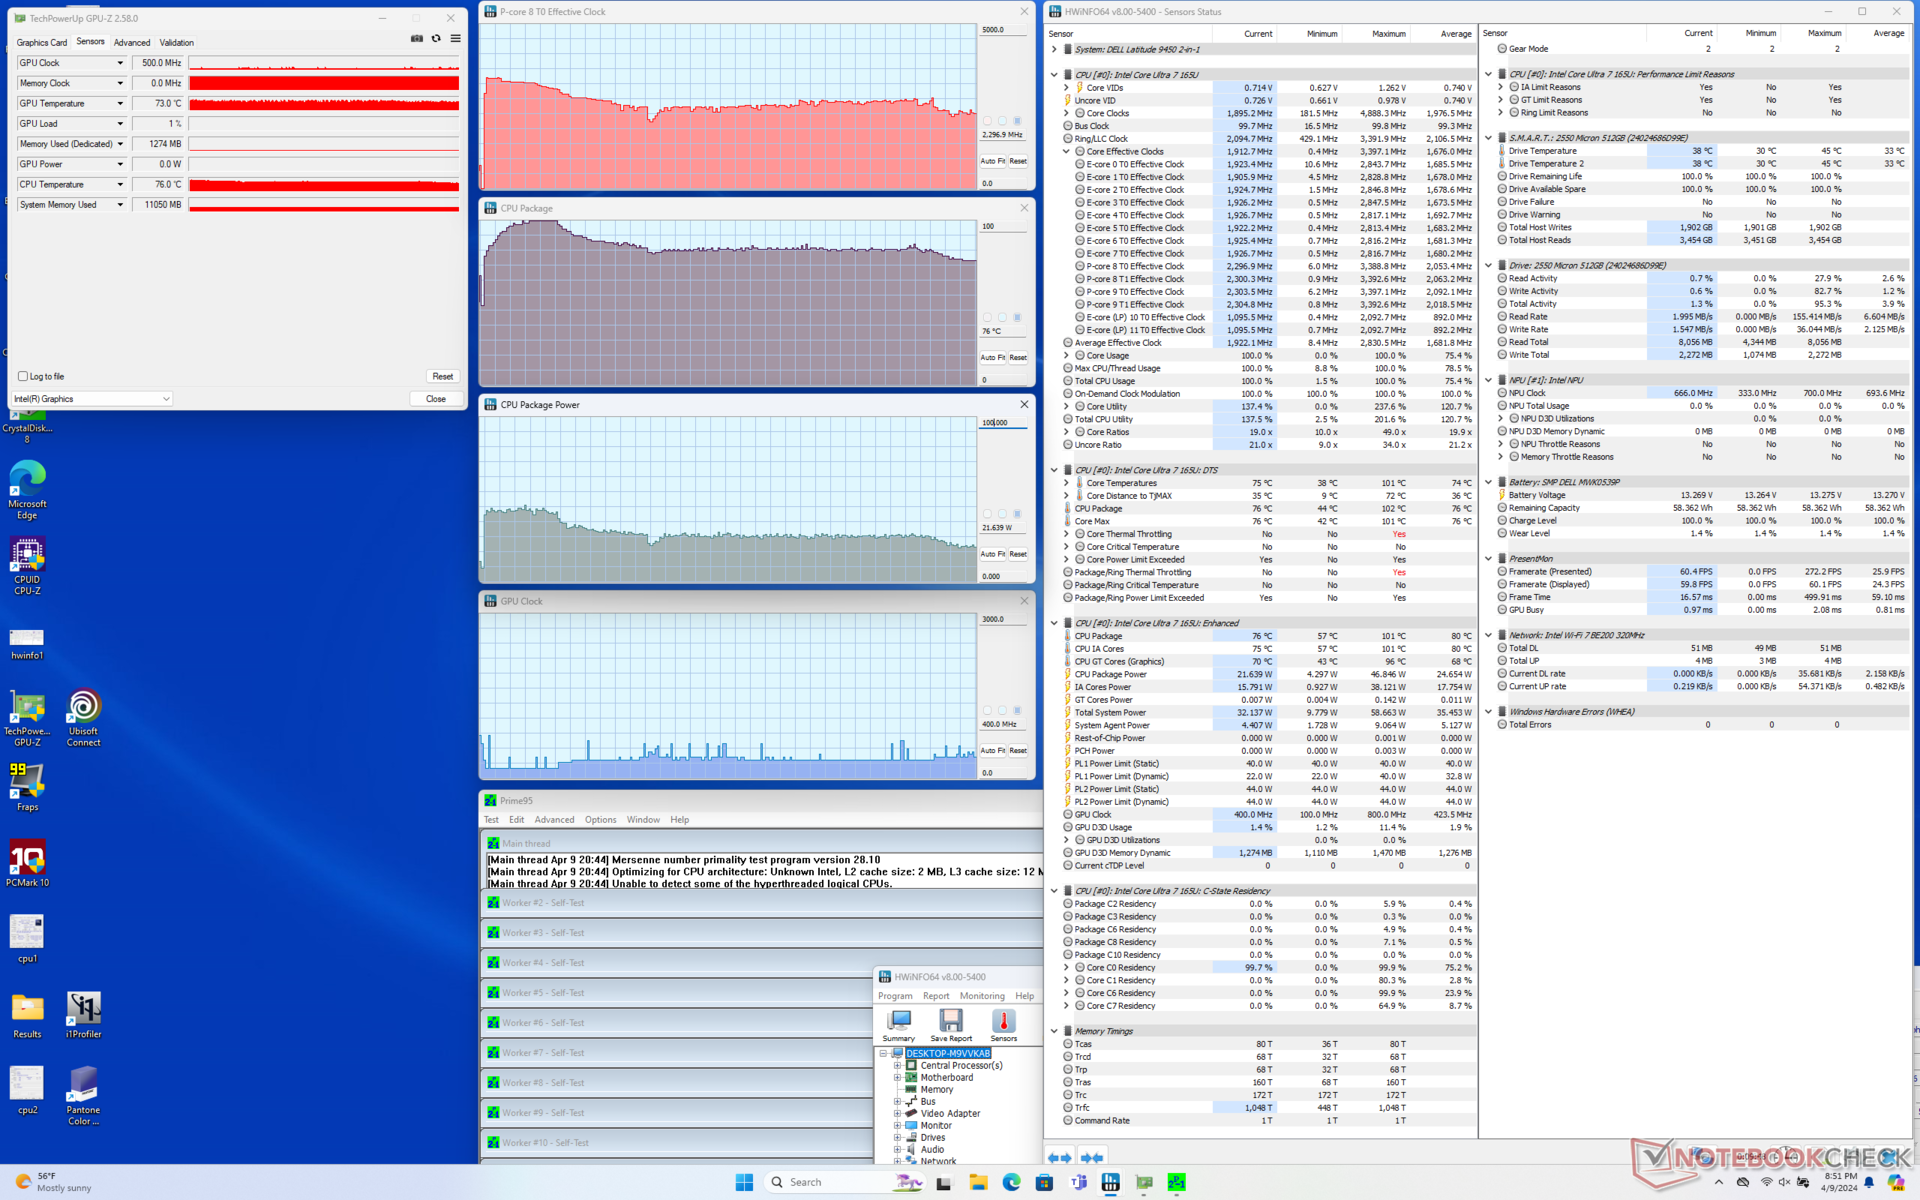
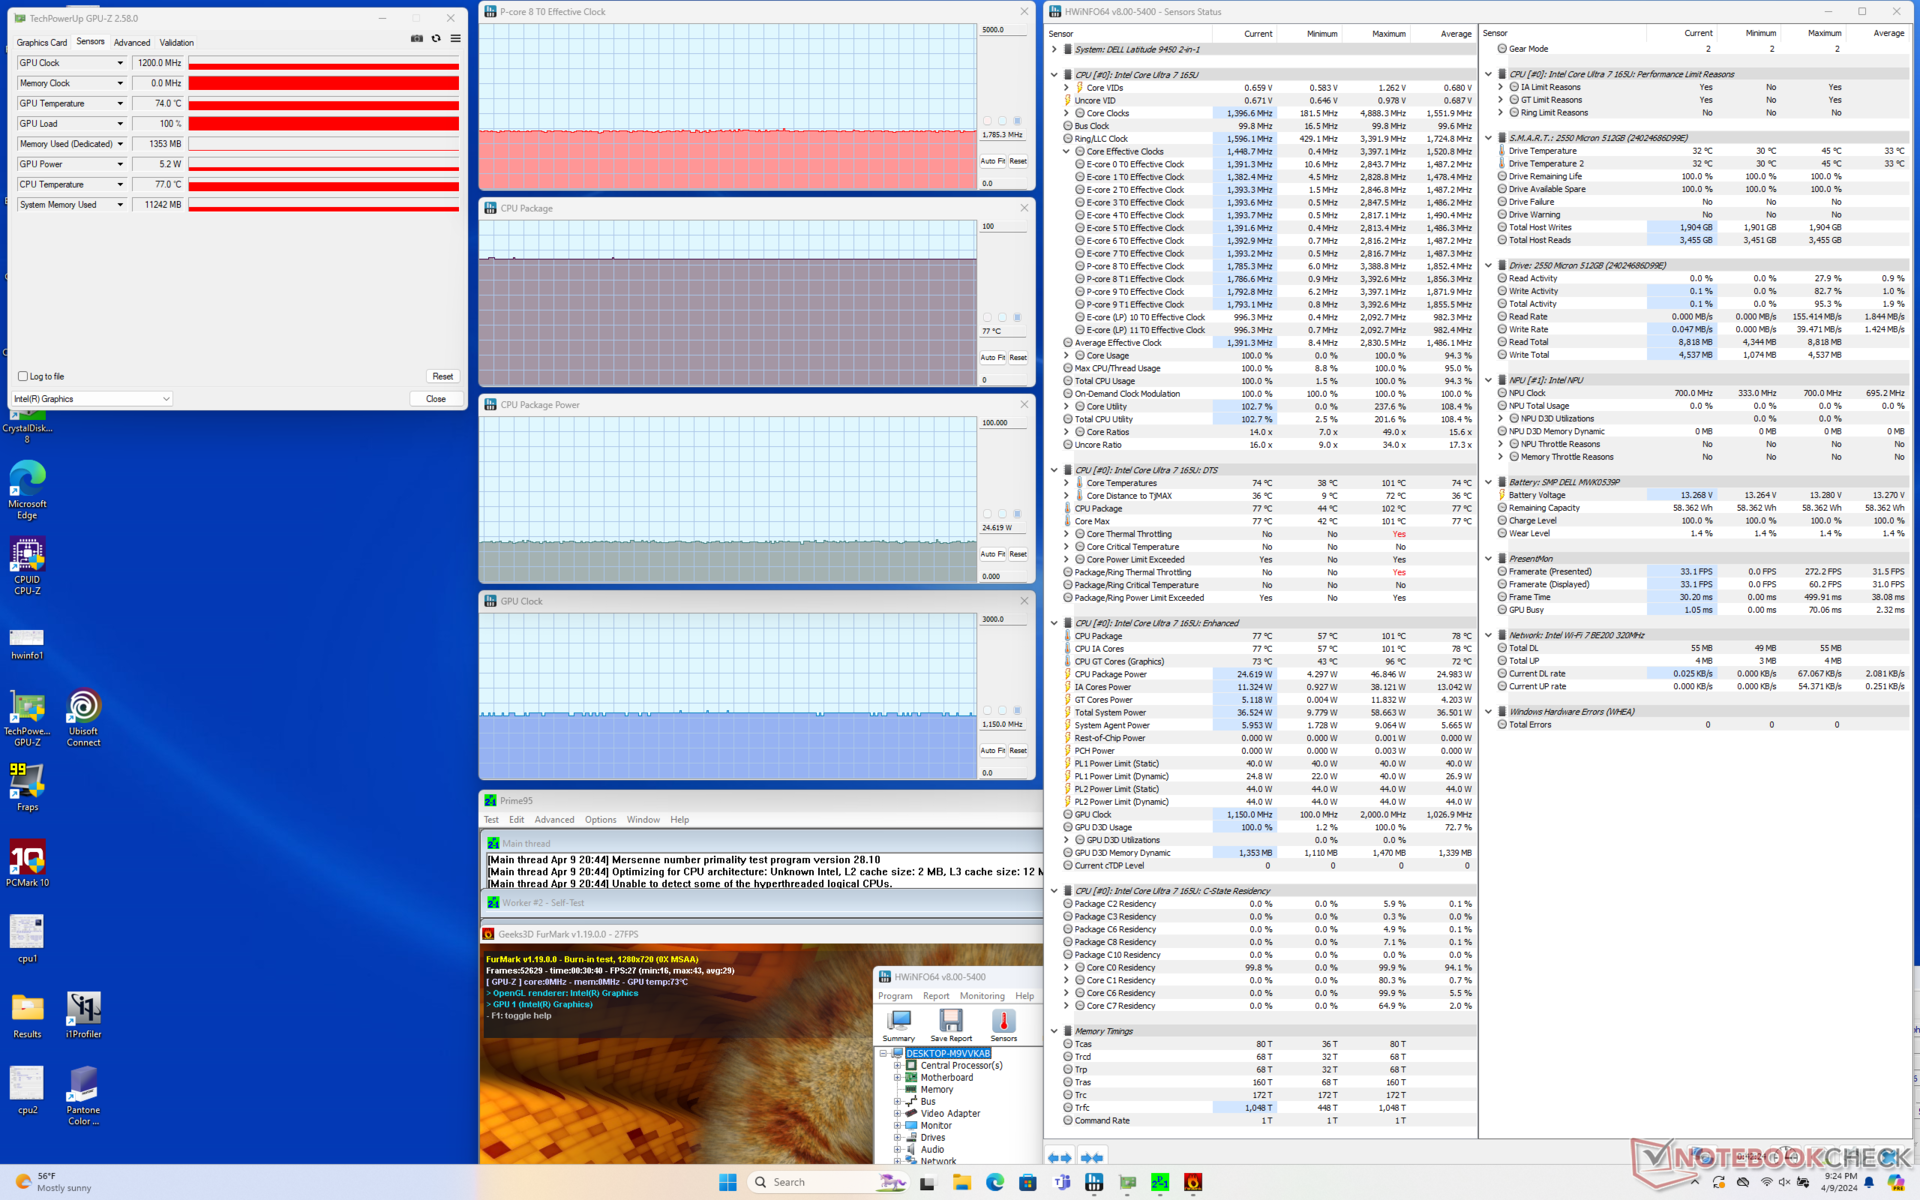
| CPU Clock (GHz) | GPU Clock (MHz) | Average CPU Temperature (°C) | |
| System Idle | -- | -- | 44 |
| Prime95 Stress | 2.3 | -- | 76 |
| Prime95 + FurMark Stress | 1.8 | 1150 | 77 |
| Witcher 3 Stress | ~2.1 | ~1600 - 2000 | 78 |
System Performance
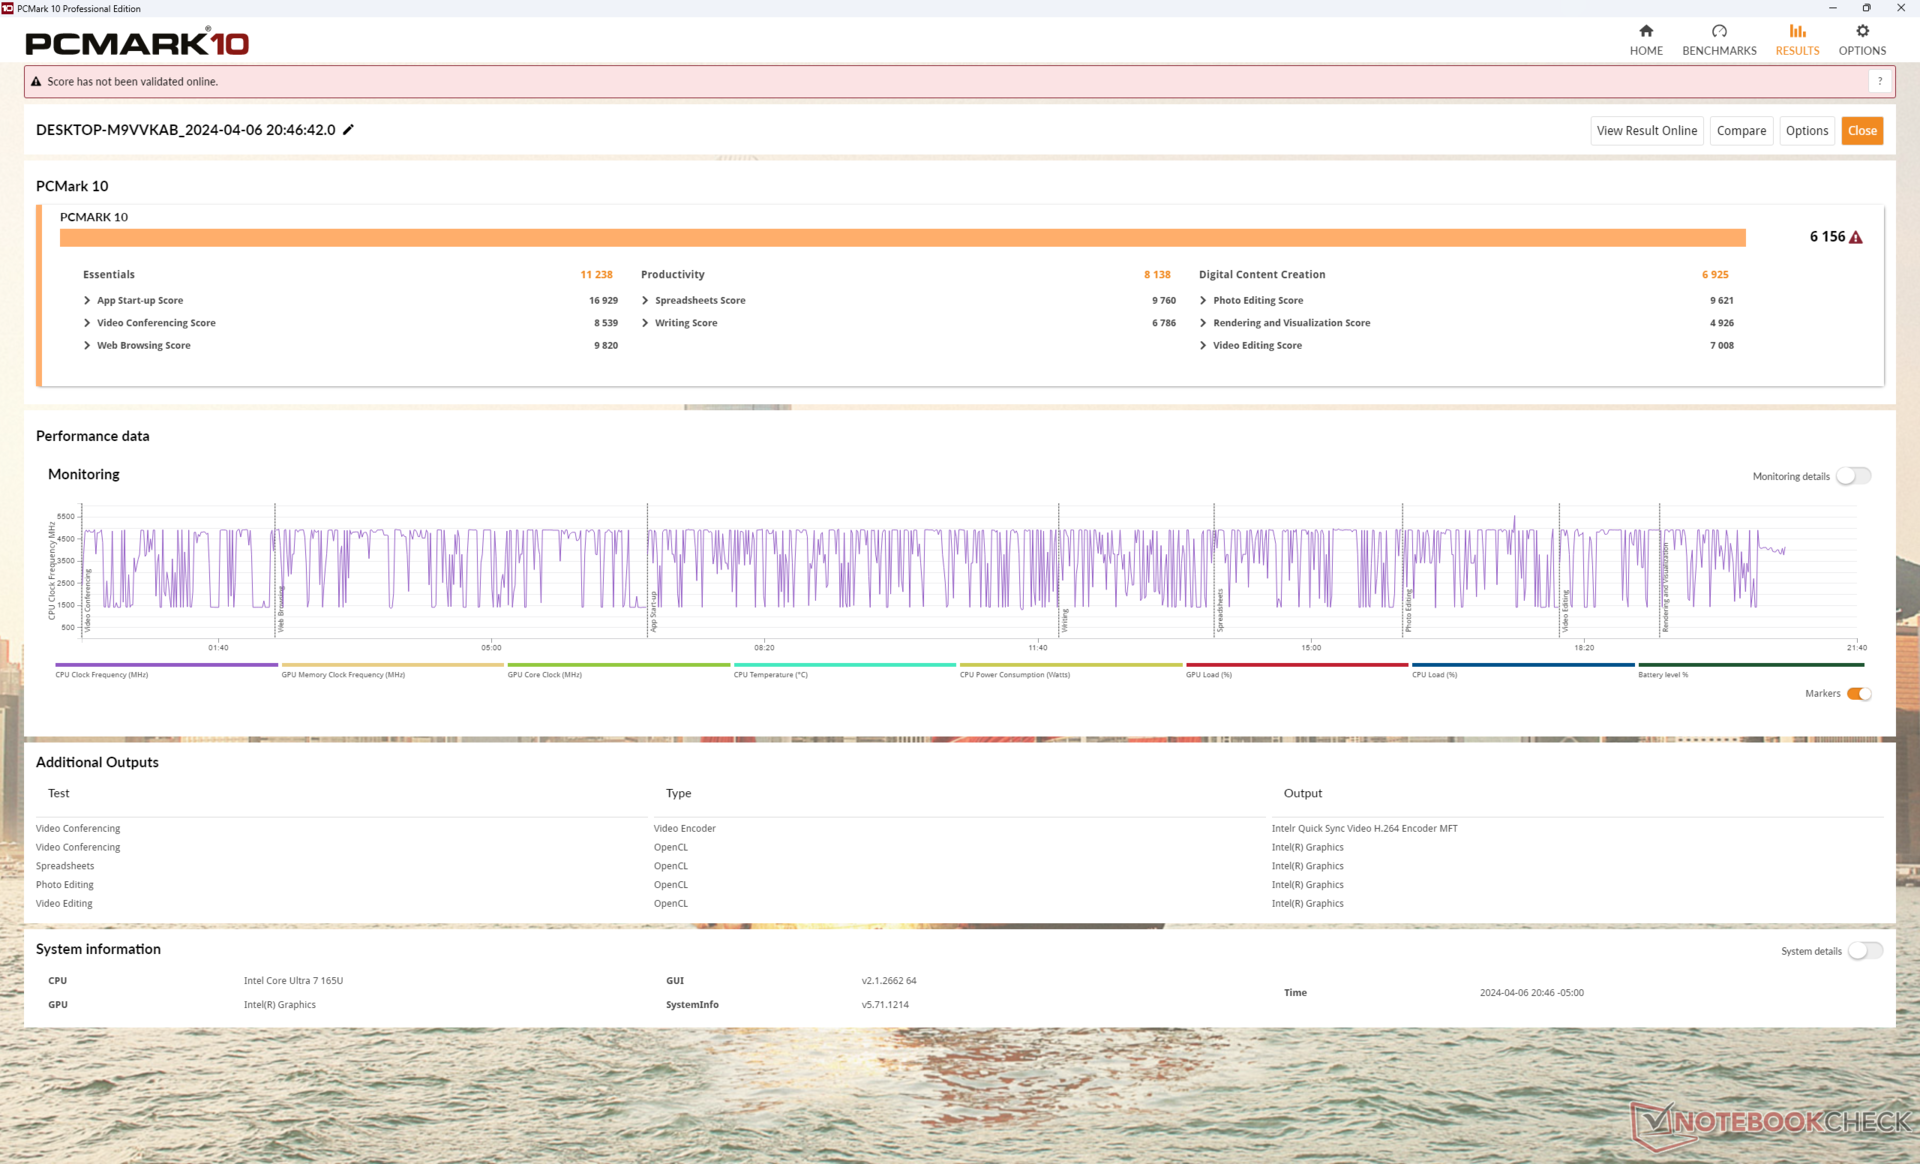
PCMark results are only slighyl ahead of the older Latitude 9440 2-in-1. Improvements are there, but they are perhaps not as noticeable as many users would like.
CrossMark: Overall | Productivity | Creativity | Responsiveness
WebXPRT 3: Overall
WebXPRT 4: Overall
Mozilla Kraken 1.1: Total
| PCMark 10 / Score | |
| Lenovo Yoga 9 2-in-1 14IMH9 | |
| Asus Expertbook B5 Flip B5402F, i7-1360P | |
| Dell Latitude 9450 2-in-1 | |
| Average Intel Core Ultra 7 165U, Intel Graphics 4-Cores iGPU (Arc) () | |
| Dell Latitude 9440 2-in-1 | |
| MSI Summit E14 Flip Evo A12MT | |
| HP EliteBook 1040 G10 818N7EA | |
| PCMark 10 / Essentials | |
| Dell Latitude 9440 2-in-1 | |
| Asus Expertbook B5 Flip B5402F, i7-1360P | |
| Dell Latitude 9450 2-in-1 | |
| Average Intel Core Ultra 7 165U, Intel Graphics 4-Cores iGPU (Arc) () | |
| Lenovo Yoga 9 2-in-1 14IMH9 | |
| MSI Summit E14 Flip Evo A12MT | |
| HP EliteBook 1040 G10 818N7EA | |
| PCMark 10 / Productivity | |
| Lenovo Yoga 9 2-in-1 14IMH9 | |
| Dell Latitude 9450 2-in-1 | |
| Average Intel Core Ultra 7 165U, Intel Graphics 4-Cores iGPU (Arc) () | |
| Asus Expertbook B5 Flip B5402F, i7-1360P | |
| Dell Latitude 9440 2-in-1 | |
| MSI Summit E14 Flip Evo A12MT | |
| HP EliteBook 1040 G10 818N7EA | |
| PCMark 10 / Digital Content Creation | |
| Lenovo Yoga 9 2-in-1 14IMH9 | |
| Asus Expertbook B5 Flip B5402F, i7-1360P | |
| Dell Latitude 9450 2-in-1 | |
| Average Intel Core Ultra 7 165U, Intel Graphics 4-Cores iGPU (Arc) () | |
| Dell Latitude 9440 2-in-1 | |
| MSI Summit E14 Flip Evo A12MT | |
| HP EliteBook 1040 G10 818N7EA | |
| CrossMark / Overall | |
| Asus Expertbook B5 Flip B5402F, i7-1360P | |
| MSI Summit E14 Flip Evo A12MT | |
| Dell Latitude 9440 2-in-1 | |
| Lenovo Yoga 9 2-in-1 14IMH9 | |
| Dell Latitude 9450 2-in-1 | |
| Average Intel Core Ultra 7 165U, Intel Graphics 4-Cores iGPU (Arc) () | |
| HP EliteBook 1040 G10 818N7EA | |
| CrossMark / Productivity | |
| MSI Summit E14 Flip Evo A12MT | |
| Asus Expertbook B5 Flip B5402F, i7-1360P | |
| Dell Latitude 9440 2-in-1 | |
| Lenovo Yoga 9 2-in-1 14IMH9 | |
| Dell Latitude 9450 2-in-1 | |
| Average Intel Core Ultra 7 165U, Intel Graphics 4-Cores iGPU (Arc) () | |
| HP EliteBook 1040 G10 818N7EA | |
| CrossMark / Creativity | |
| Asus Expertbook B5 Flip B5402F, i7-1360P | |
| MSI Summit E14 Flip Evo A12MT | |
| Lenovo Yoga 9 2-in-1 14IMH9 | |
| Dell Latitude 9440 2-in-1 | |
| Dell Latitude 9450 2-in-1 | |
| Average Intel Core Ultra 7 165U, Intel Graphics 4-Cores iGPU (Arc) () | |
| HP EliteBook 1040 G10 818N7EA | |
| CrossMark / Responsiveness | |
| MSI Summit E14 Flip Evo A12MT | |
| Asus Expertbook B5 Flip B5402F, i7-1360P | |
| Dell Latitude 9440 2-in-1 | |
| Lenovo Yoga 9 2-in-1 14IMH9 | |
| Dell Latitude 9450 2-in-1 | |
| Average Intel Core Ultra 7 165U, Intel Graphics 4-Cores iGPU (Arc) () | |
| HP EliteBook 1040 G10 818N7EA | |
| WebXPRT 3 / Overall | |
| Dell Latitude 9440 2-in-1 | |
| Asus Expertbook B5 Flip B5402F, i7-1360P | |
| MSI Summit E14 Flip Evo A12MT | |
| Dell Latitude 9450 2-in-1 | |
| Average Intel Core Ultra 7 165U, Intel Graphics 4-Cores iGPU (Arc) () | |
| HP EliteBook 1040 G10 818N7EA | |
| Lenovo Yoga 9 2-in-1 14IMH9 | |
| WebXPRT 4 / Overall | |
| Asus Expertbook B5 Flip B5402F, i7-1360P | |
| Dell Latitude 9440 2-in-1 | |
| Dell Latitude 9450 2-in-1 | |
| Average Intel Core Ultra 7 165U, Intel Graphics 4-Cores iGPU (Arc) () | |
| Lenovo Yoga 9 2-in-1 14IMH9 | |
| HP EliteBook 1040 G10 818N7EA | |
| Mozilla Kraken 1.1 / Total | |
| MSI Summit E14 Flip Evo A12MT | |
| HP EliteBook 1040 G10 818N7EA | |
| Lenovo Yoga 9 2-in-1 14IMH9 | |
| Dell Latitude 9450 2-in-1 | |
| Average Intel Core Ultra 7 165U, Intel Graphics 4-Cores iGPU (Arc) () | |
| Dell Latitude 9440 2-in-1 | |
| Asus Expertbook B5 Flip B5402F, i7-1360P | |
* ... smaller is better
| PCMark 10 Score | 6156 points | |
Help | ||
| AIDA64 / Memory Copy | |
| Lenovo Yoga 9 2-in-1 14IMH9 | |
| Dell Latitude 9450 2-in-1 | |
| Average Intel Core Ultra 7 165U () | |
| Dell Latitude 9440 2-in-1 | |
| MSI Summit E14 Flip Evo A12MT | |
| Asus Expertbook B5 Flip B5402F, i7-1360P | |
| HP EliteBook 1040 G10 818N7EA | |
| AIDA64 / Memory Read | |
| Lenovo Yoga 9 2-in-1 14IMH9 | |
| MSI Summit E14 Flip Evo A12MT | |
| Asus Expertbook B5 Flip B5402F, i7-1360P | |
| HP EliteBook 1040 G10 818N7EA | |
| Dell Latitude 9450 2-in-1 | |
| Average Intel Core Ultra 7 165U () | |
| Dell Latitude 9440 2-in-1 | |
| AIDA64 / Memory Write | |
| Dell Latitude 9440 2-in-1 | |
| Lenovo Yoga 9 2-in-1 14IMH9 | |
| Dell Latitude 9450 2-in-1 | |
| Average Intel Core Ultra 7 165U () | |
| HP EliteBook 1040 G10 818N7EA | |
| Asus Expertbook B5 Flip B5402F, i7-1360P | |
| MSI Summit E14 Flip Evo A12MT | |
| AIDA64 / Memory Latency | |
| Lenovo Yoga 9 2-in-1 14IMH9 | |
| Dell Latitude 9450 2-in-1 | |
| Average Intel Core Ultra 7 165U () | |
| Dell Latitude 9440 2-in-1 | |
| Asus Expertbook B5 Flip B5402F, i7-1360P | |
| HP EliteBook 1040 G10 818N7EA | |
| MSI Summit E14 Flip Evo A12MT | |
* ... smaller is better
DPC Latency
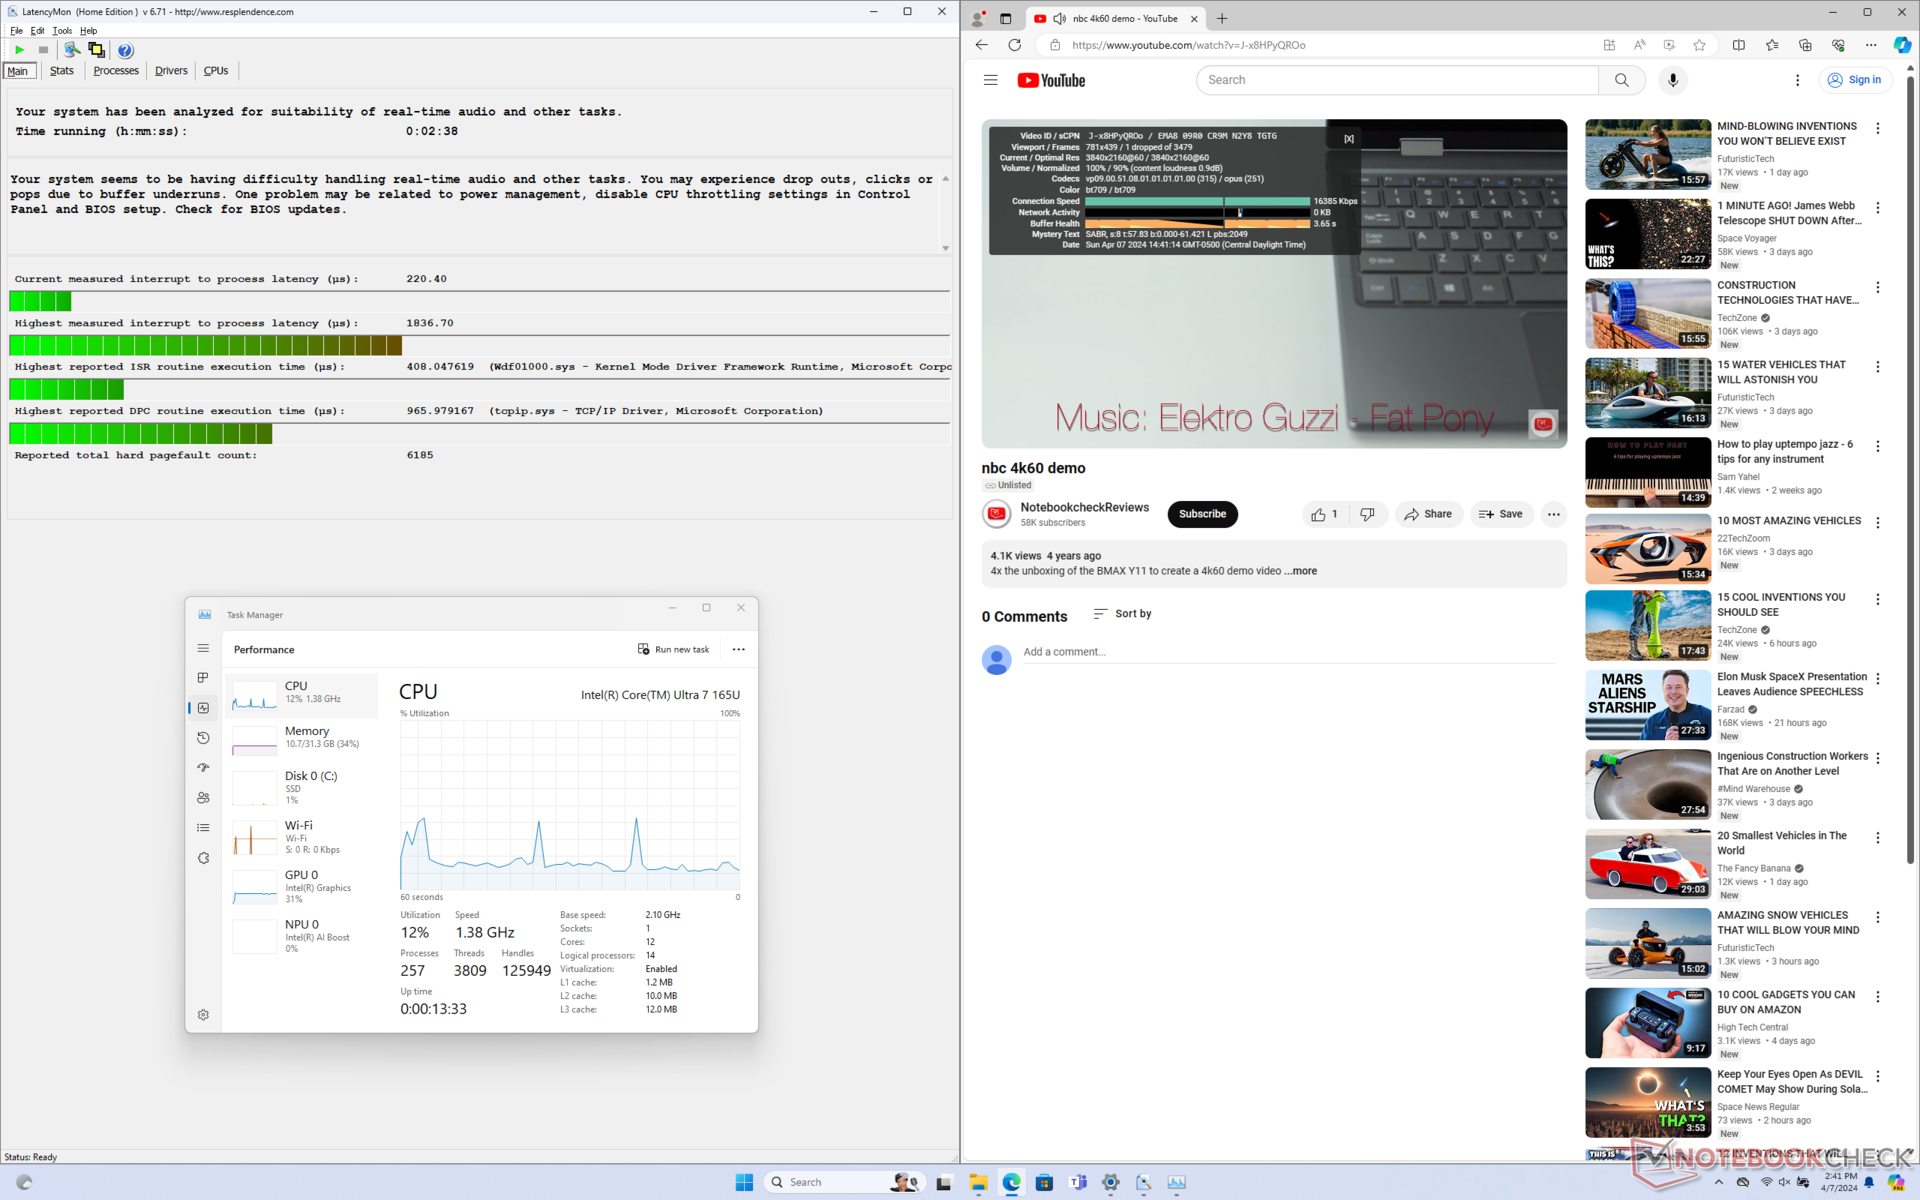
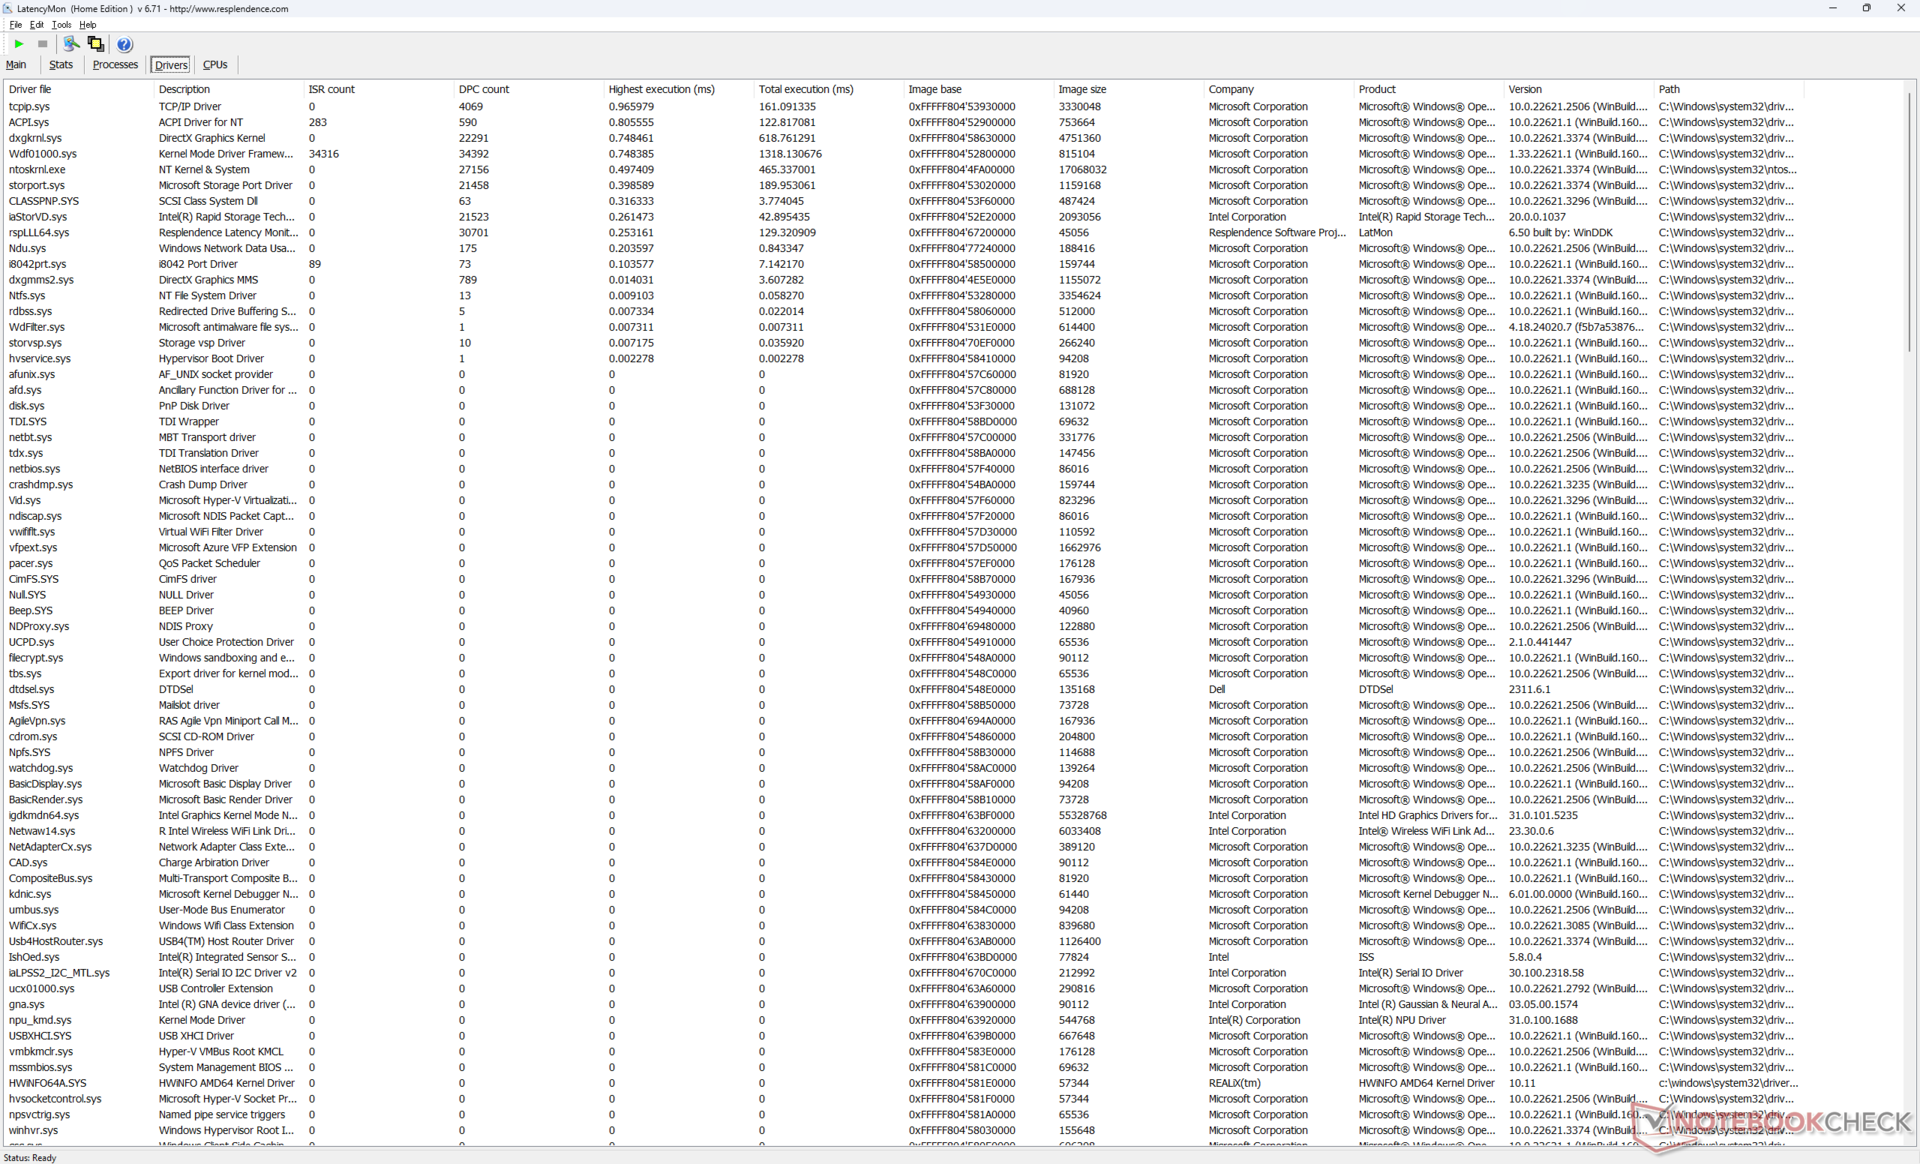
LatencyMon reveals minor DPC issues when opening multiple browser tabs of our homepage just like on last year's model. 4K video playback at 60 FPS is otherwise perfect with just a single dropped frame recorded when taking a screenshot after 60 seconds.
| DPC Latencies / LatencyMon - interrupt to process latency (max), Web, Youtube, Prime95 | |
| MSI Summit E14 Flip Evo A12MT | |
| Asus Expertbook B5 Flip B5402F, i7-1360P | |
| Dell Latitude 9450 2-in-1 | |
| Lenovo Yoga 9 2-in-1 14IMH9 | |
| Dell Latitude 9440 2-in-1 | |
| HP EliteBook 1040 G10 818N7EA | |
* ... smaller is better
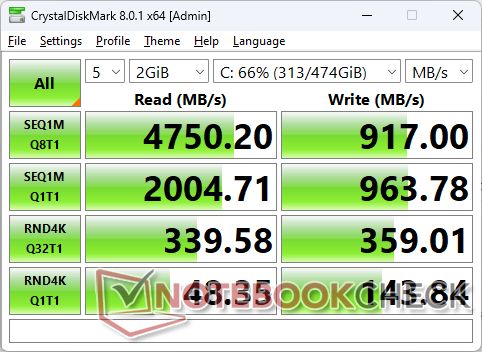
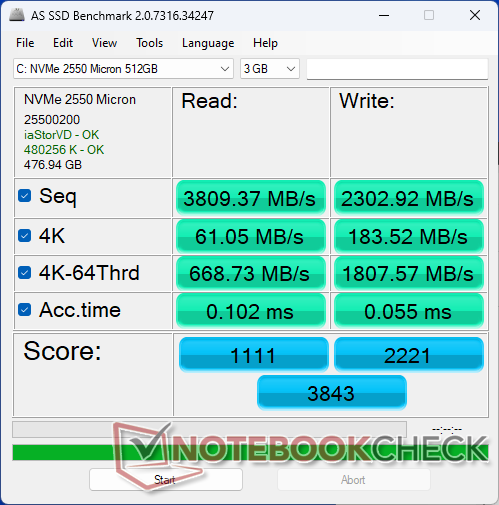
Storage Devices
Our test unit ships with the Micron 2550 instead of the Samsung PM9B1 on last year's Latitude 9440 2-in-1. The new Micron drive is less susceptible to performance throttling as shown by the DiskSpd Read Loop test results below.

* ... smaller is better
Disk Throttling: DiskSpd Read Loop, Queue Depth 8
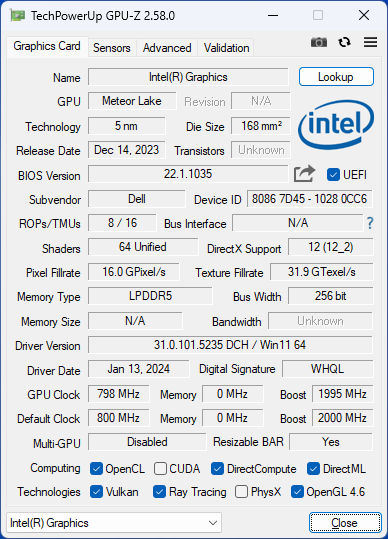
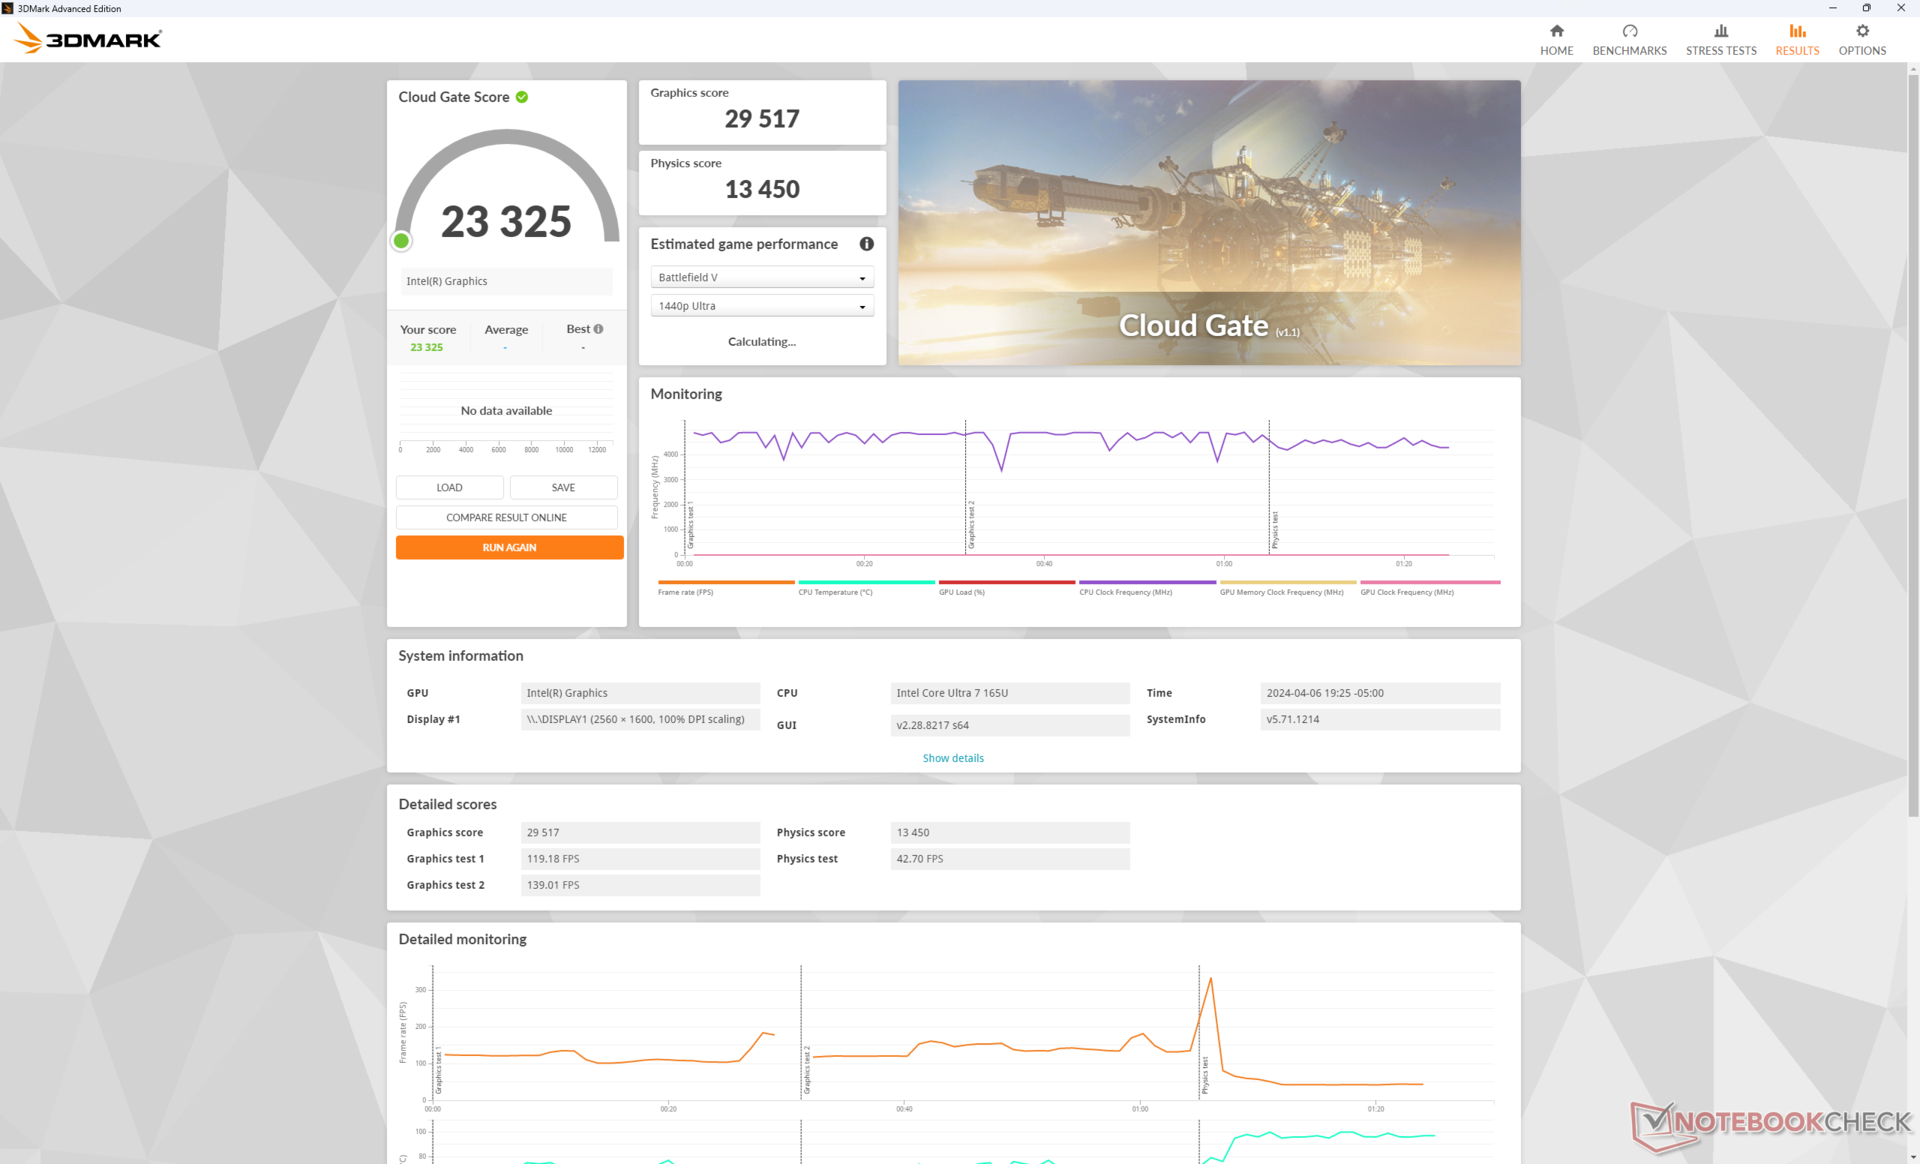
GPU Performance
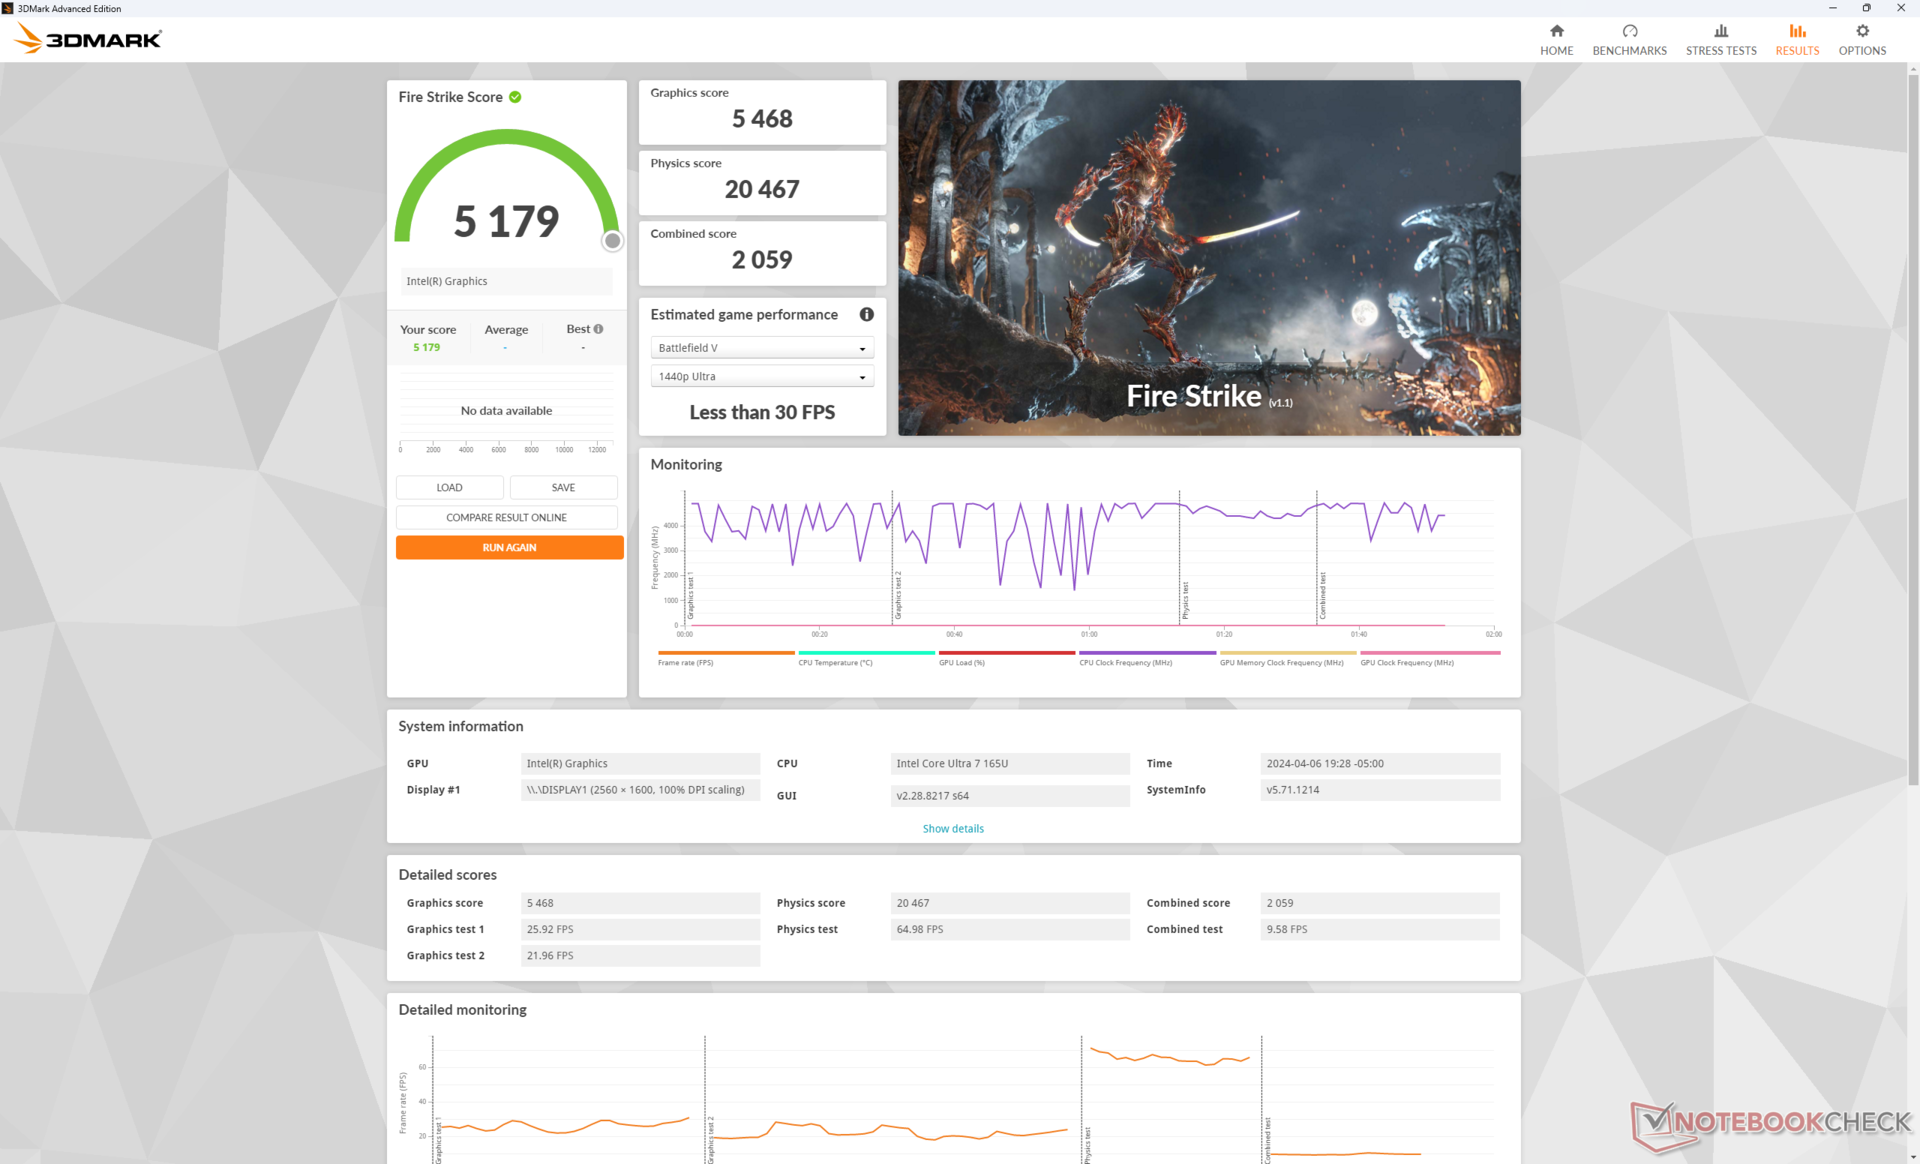
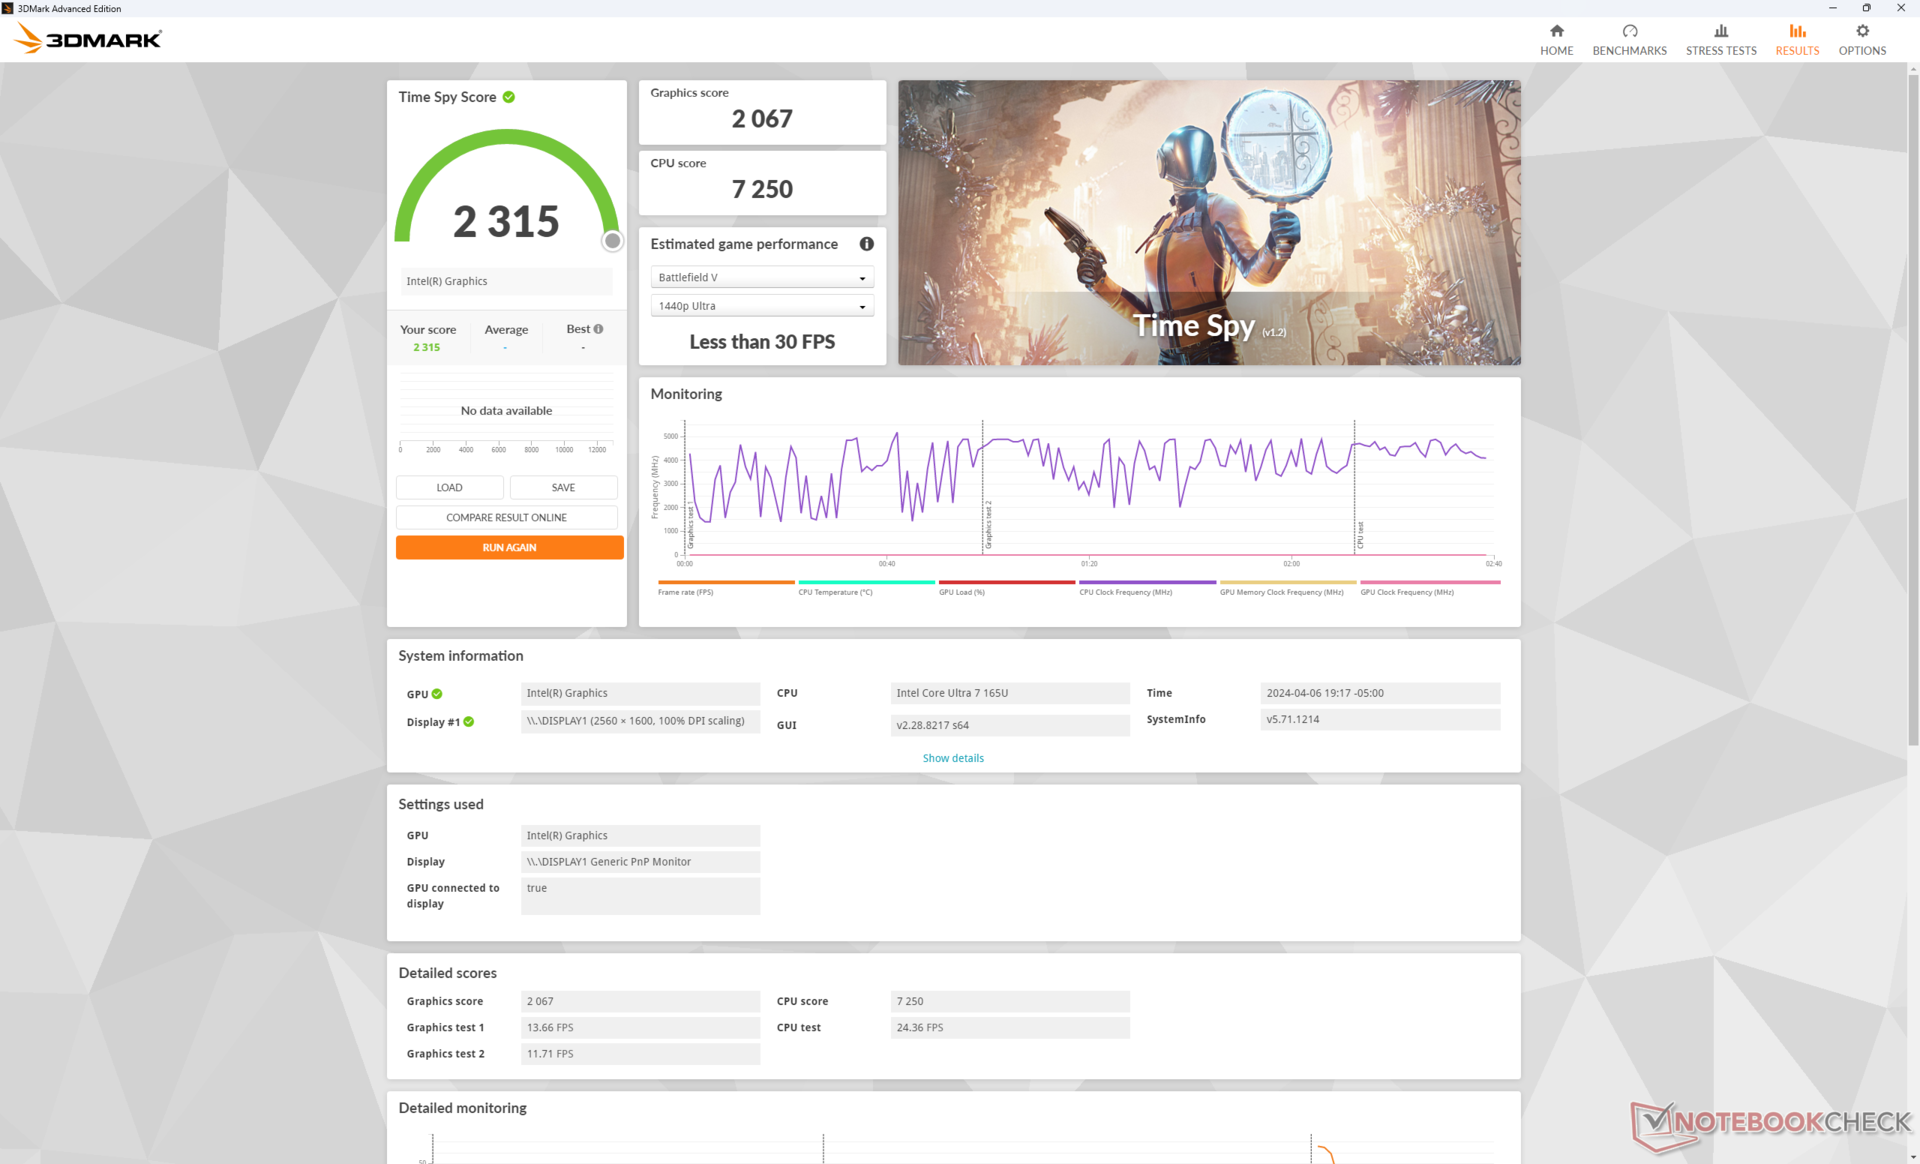
The Core Ultra 7 165U ships with an integrated Arc 4 GPU whereas the Core Ultra 7 155H ships with the integrated Arc 8. This small nominal difference entails significant performance differences that don't favor our Dell system. 3DMark results, for example, rank our Arc 4 30 to 50 percent slower than the Arc 8. Graphics performance is still faster than last year's Iris Xe 96 EUs, but the advantage is subsequently small at only 20 to 25 percent. Demanding games remain unplayable unless if on the lowest possible settings. Some games like Tiny Tina's Wonderlands would even crash if on higher settings.
| Power Profile | Graphics Score | Physics Score | Combined Score |
| Performance Mode | 5468 | 20467 | 2059 |
| Balanced Mode | 5503 (-0%) | 20310 (-0%) | 2041 (-0%) |
| Battery Power | 5255 (-4%) | 13578 (-34%) | 1614 (-22%) |
Running on Balanced mode instead of Performance mode does not impact system performance as shown by our Fire Strike results table above. Running on battery power, however, reduces CPU performance.
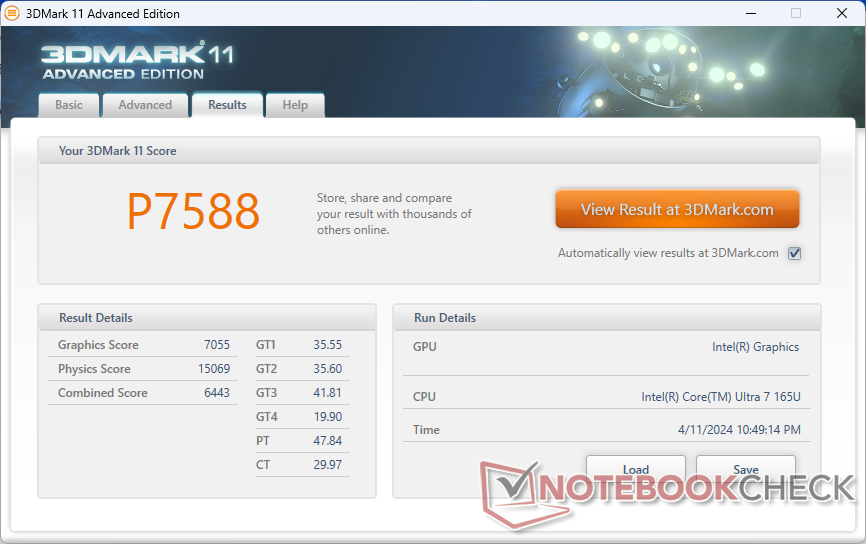
| 3DMark 11 Performance | 7588 points | |
| 3DMark Cloud Gate Standard Score | 23325 points | |
| 3DMark Fire Strike Score | 5179 points | |
| 3DMark Time Spy Score | 2315 points | |
Help | ||
| Blender | |
| v3.3 Classroom HIP/AMD | |
| HP ProBook 445 G10 | |
| Lenovo ThinkPad E14 G5-21JSS05C00 | |
| Lenovo ThinkPad P14s G3 AMD 21J6S05000 | |
| Lenovo ThinkPad P14s G3 AMD 21J6S05000 | |
| HP Dragonfly Pro 2023 | |
| v3.3 Classroom OPTIX/RTX | |
| Lenovo ThinkPad P14s G4 21HF0017GE | |
| v3.3 Classroom CUDA | |
| Lenovo ThinkPad P14s G4 21HF0017GE | |
| Lenovo ThinkPad P14s G4 21HF0017GE | |
| v3.3 Classroom CPU | |
| Asus F415EA-EK115W | |
| HP EliteBook 1040 G10 818N7EA | |
| LG Gram 14Z90Q | |
| Lenovo ThinkPad X1 Carbon G10 21CB00DCGE | |
| Asus Expertbook B5 Flip B5402F, i7-1360P | |
| HP ProBook 445 G10 | |
| Dell Latitude 9440 2-in-1 | |
| Average Intel Graphics 4-Cores iGPU (Arc) (592 - 649, n=3) | |
| Dell Latitude 9450 2-in-1 | |
| Lenovo IdeaPad Slim 5 14IMH9 | |
| Lenovo Yoga 9 2-in-1 14IMH9 | |
| Lenovo ThinkPad E14 G5-21JSS05C00 | |
| Lenovo ThinkPad P14s G3 AMD 21J6S05000 | |
| Lenovo ThinkPad P14s G4 21HF0017GE | |
| HP Dragonfly Pro 2023 | |
| Lenovo ThinkPad T14s G4-21F8002TGE | |
| Lenovo IdeaPad Pro 5 14AHP9 | |
* ... smaller is better
| The Witcher 3 - 1920x1080 Ultra Graphics & Postprocessing (HBAO+) | |
| Lenovo Yoga 9 2-in-1 14IMH9 | |
| Dell Latitude 9450 2-in-1 | |
| MSI Summit E14 Flip Evo A12MT | |
| Dell Latitude 9440 2-in-1 | |
| Asus Expertbook B5 Flip B5402F, i7-1360P | |
| HP EliteBook 1040 G10 818N7EA | |
| Final Fantasy XV Benchmark - 1920x1080 High Quality | |
| MSI Summit E14 Flip Evo A12MT | |
| Lenovo Yoga 9 2-in-1 14IMH9 | |
| Dell Latitude 9450 2-in-1 | |
| Dell Latitude 9440 2-in-1 | |
| Asus Expertbook B5 Flip B5402F, i7-1360P | |
| HP EliteBook 1040 G10 818N7EA | |
| Strange Brigade - 1920x1080 ultra AA:ultra AF:16 | |
| Lenovo Yoga 9 2-in-1 14IMH9 | |
| Dell Latitude 9450 2-in-1 | |
| MSI Summit E14 Flip Evo A12MT | |
| Asus Expertbook B5 Flip B5402F, i7-1360P | |
| Dell Latitude 9440 2-in-1 | |
| HP EliteBook 1040 G10 818N7EA | |
| Dota 2 Reborn - 1920x1080 ultra (3/3) best looking | |
| Lenovo Yoga 9 2-in-1 14IMH9 | |
| MSI Summit E14 Flip Evo A12MT | |
| Dell Latitude 9440 2-in-1 | |
| Dell Latitude 9450 2-in-1 | |
| Asus Expertbook B5 Flip B5402F, i7-1360P | |
| HP EliteBook 1040 G10 818N7EA | |
| Cyberpunk 2077 2.0 Phantom Liberty | |
| 1280x720 Low Preset (FSR off) | |
| Lenovo Yoga 9 2-in-1 14IMH9 | |
| Average Intel Graphics 4-Cores iGPU (Arc) (31.7 - 32.8, n=3) | |
| Dell Latitude 9450 2-in-1 | |
| 1920x1080 Low Preset (FSR off) | |
| Lenovo IdeaPad Pro 5 14AHP9 | |
| Lenovo Yoga 9 2-in-1 14IMH9 | |
| Average Intel Graphics 4-Cores iGPU (Arc) (20.3 - 21.6, n=3) | |
| Dell Latitude 9450 2-in-1 | |
| 1920x1080 Medium Preset (FSR off) | |
| Lenovo IdeaPad Pro 5 14AHP9 | |
| Lenovo Yoga 9 2-in-1 14IMH9 | |
| Average Intel Graphics 4-Cores iGPU (Arc) (16.7 - 17.6, n=3) | |
| Dell Latitude 9450 2-in-1 | |
| 1920x1080 High Preset (FSR off) | |
| Lenovo IdeaPad Pro 5 14AHP9 | |
| Lenovo Yoga 9 2-in-1 14IMH9 | |
| Average Intel Graphics 4-Cores iGPU (Arc) (14.3 - 14.9, n=3) | |
| Dell Latitude 9450 2-in-1 | |
| 1920x1080 Ultra Preset (FSR off) | |
| Lenovo Yoga 9 2-in-1 14IMH9 | |
| Lenovo IdeaPad Pro 5 14AHP9 | |
| Dell Latitude 9450 2-in-1 | |
| Average Intel Graphics 4-Cores iGPU (Arc) (12.5 - 13, n=3) | |
| Tiny Tina's Wonderlands - 1280x720 Lowest Preset (DX12) | |
| Lenovo Yoga 9 2-in-1 14IMH9 | |
| Dell Latitude 9450 2-in-1 | |
| Average Intel Graphics 4-Cores iGPU (Arc) (54.8 - 61.8, n=3) | |
| Dell Latitude 9440 2-in-1 | |
Witcher 3 FPS Chart
| low | med. | high | ultra | |
| The Witcher 3 (2015) | 92.1 | 57 | 32.4 | 17.9 |
| Dota 2 Reborn (2015) | 91.4 | 69 | 61 | 57.3 |
| Final Fantasy XV Benchmark (2018) | 48.2 | 25.9 | 18.2 | |
| X-Plane 11.11 (2018) | 37.6 | 30.1 | 25.3 | |
| Far Cry 5 (2018) | 48 | 24 | 23 | 21 |
| Strange Brigade (2018) | 121.1 | 52.1 | 41.9 | 33.3 |
| Tiny Tina's Wonderlands (2022) | ||||
| F1 22 (2022) | 46.3 | 42 | 29.5 | 7.62 |
| Baldur's Gate 3 (2023) | 15 | 12.3 | 11 | 10.6 |
| Cyberpunk 2077 2.0 Phantom Liberty (2023) | 20.3 | 16.7 | 14.4 | 12.7 |
Emissions
System Noise
Fan noise and behavior are essentially identical to what we observed on the Latitude 9440 2-in-1 despite the performance differences between the two models.
Noise Level
| Idle |
| 23.9 / 23.9 / 23.9 dB(A) |
| Load |
| 36.4 / 44.7 dB(A) |
 | ||
30 dB silent 40 dB(A) audible 50 dB(A) loud |
||
min: | ||
| Dell Latitude 9450 2-in-1 Graphics 4-Core, Ultra 7 165U | Dell Latitude 9440 2-in-1 Iris Xe G7 96EUs, i7-1365U, Samsung PM9B1 1024GB MZAL41T0HBLB | HP EliteBook 1040 G10 818N7EA Iris Xe G7 80EUs, i5-1335U, Samsung MZ9L4512HBLU-00BMV | Asus Expertbook B5 Flip B5402F, i7-1360P Iris Xe G7 96EUs, i7-1360P, Micron 2400 MTFDKBA1T0QFM | Lenovo Yoga 9 2-in-1 14IMH9 Arc 8-Cores, Ultra 7 155H, Samsung PM9C1a MZAL81T0HDLB | MSI Summit E14 Flip Evo A12MT Iris Xe G7 96EUs, i7-1260P, Samsung PM9A1 MZVL21T0HCLR | |
|---|---|---|---|---|---|---|
| Noise | -1% | 6% | -3% | 2% | 6% | |
| off / environment * | 23.9 | 24.1 -1% | 23.1 3% | 24.78 -4% | 23.2 3% | 23.3 3% |
| Idle Minimum * | 23.9 | 24.3 -2% | 23.1 3% | 24.78 -4% | 23.6 1% | 23.3 3% |
| Idle Average * | 23.9 | 24.3 -2% | 23.1 3% | 24.78 -4% | 23.6 1% | 23.3 3% |
| Idle Maximum * | 23.9 | 24.3 -2% | 23.1 3% | 24.78 -4% | 25 -5% | 23.3 3% |
| Load Average * | 36.4 | 36.3 -0% | 35.3 3% | 37 -2% | 34.8 4% | 24 34% |
| Witcher 3 ultra * | 44.7 | 44.5 -0% | 37.3 17% | 37.7 16% | 35.6 20% | |
| Load Maximum * | 44.7 | 44.5 -0% | 41.1 8% | 45 -1% | 46.2 -3% | 55.8 -25% |
* ... smaller is better
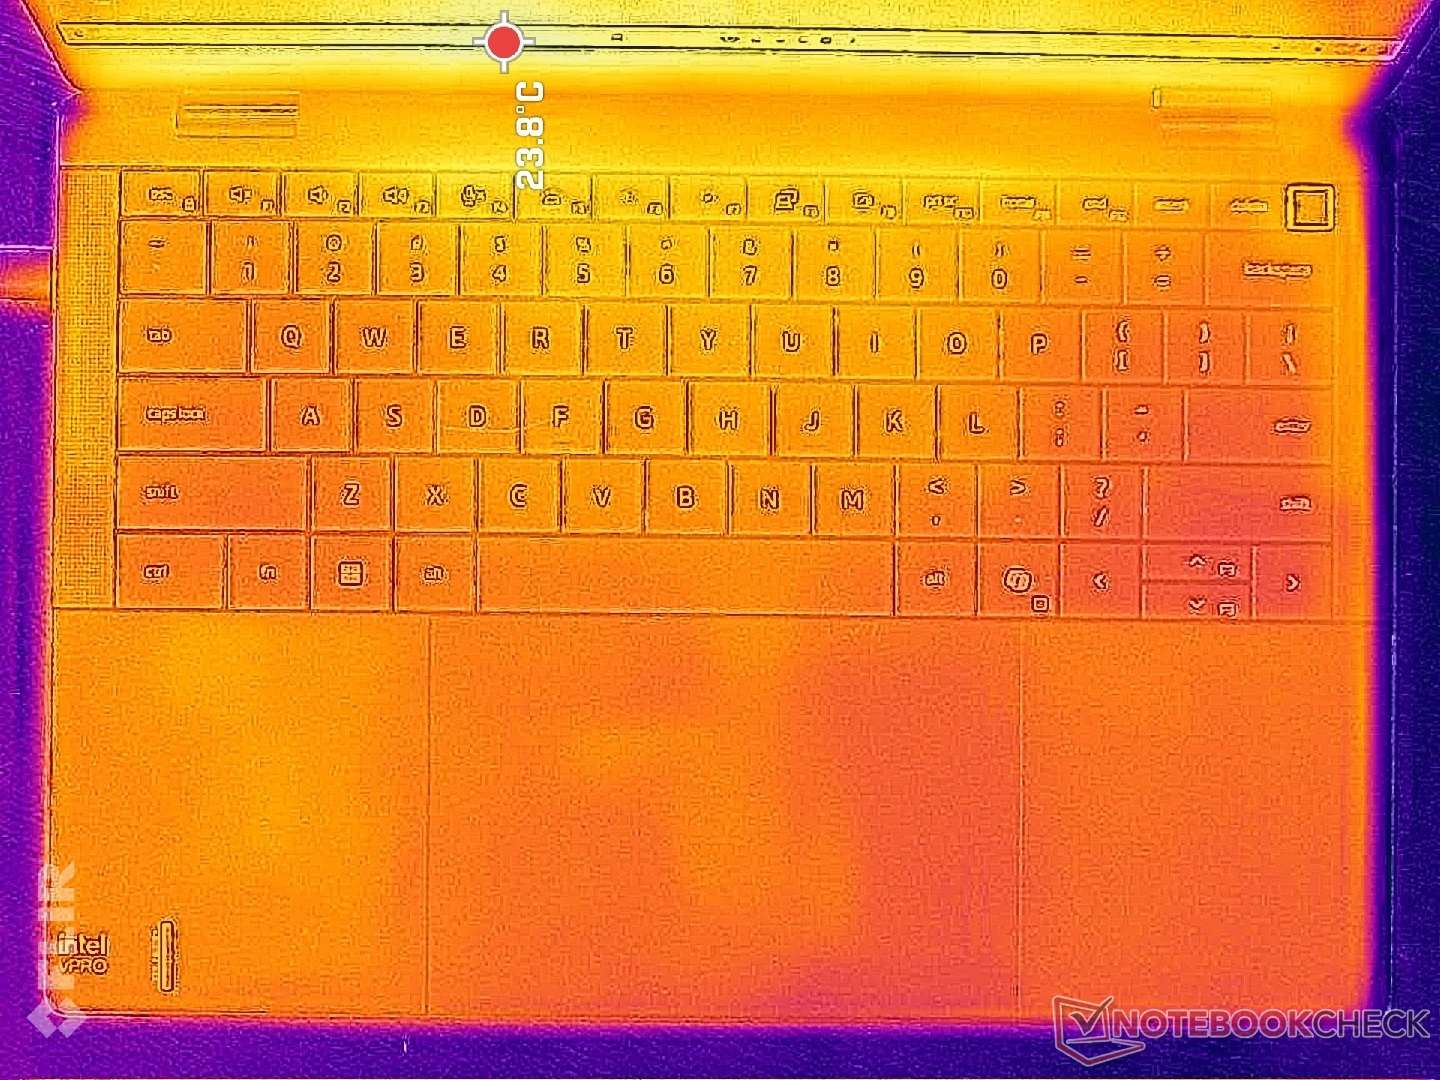
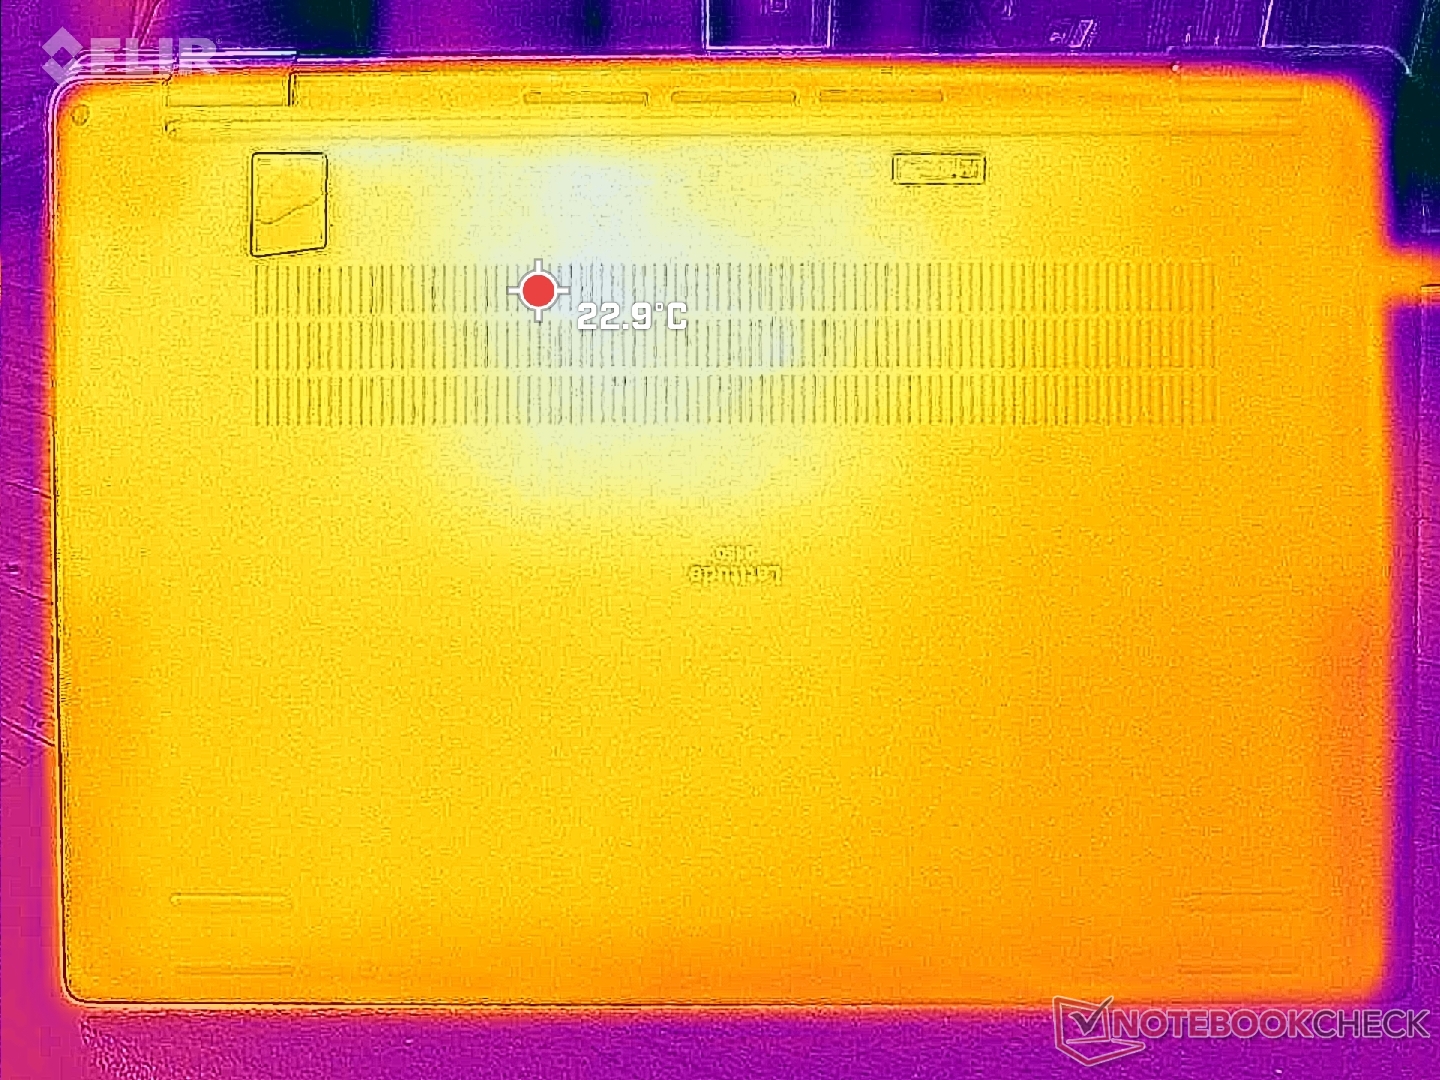
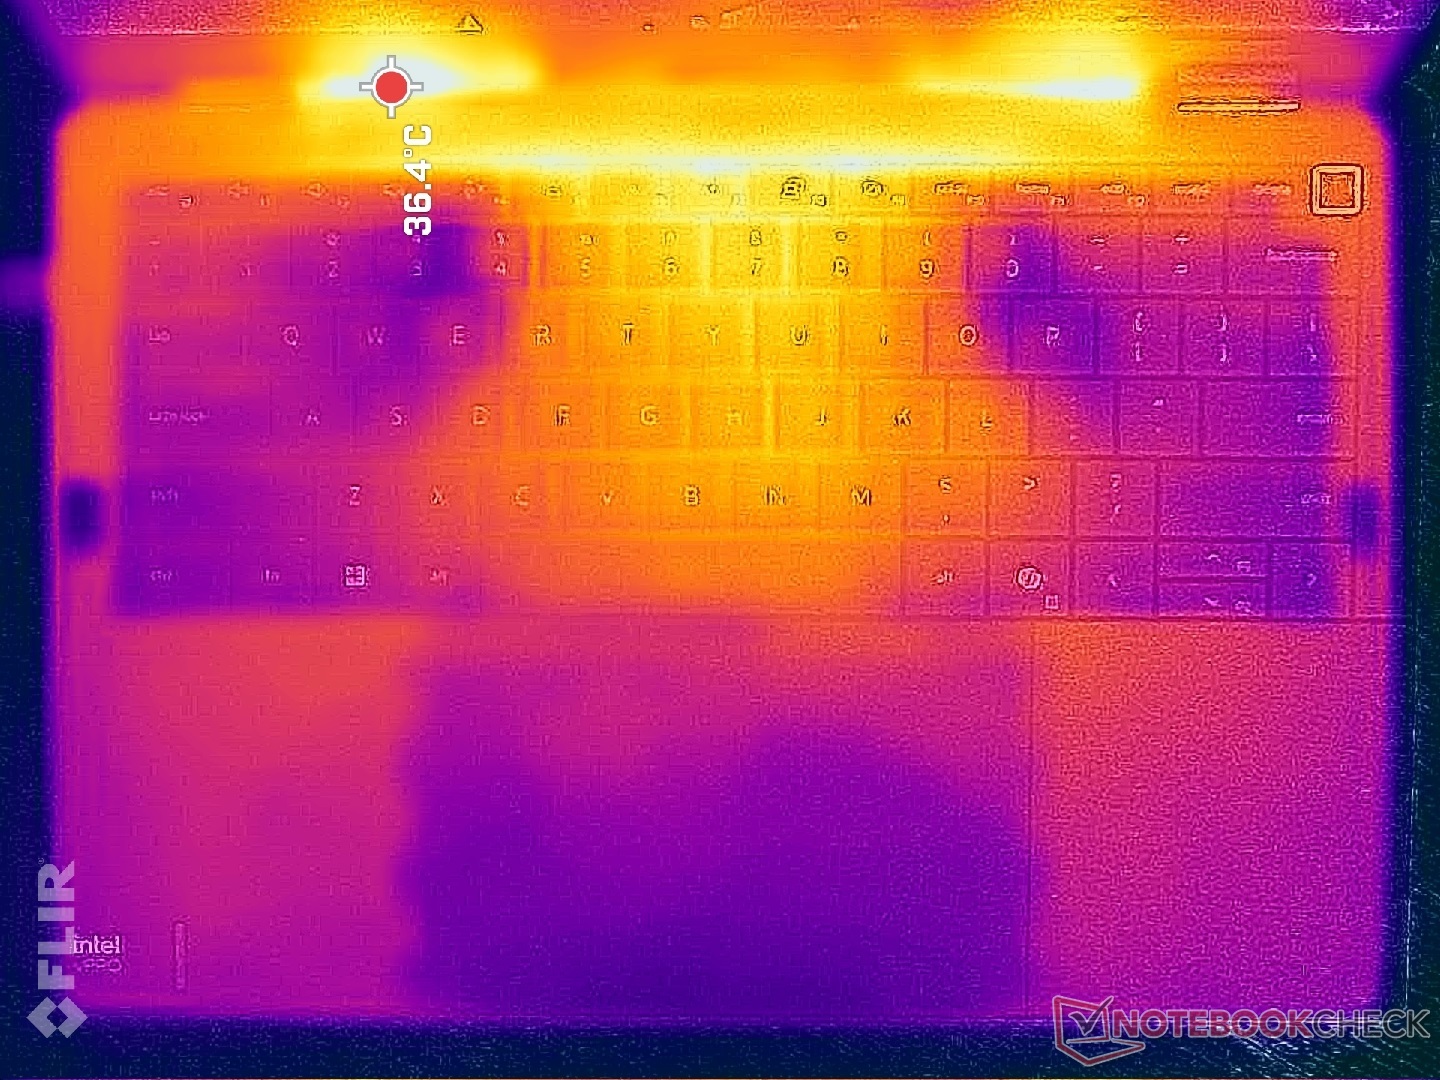
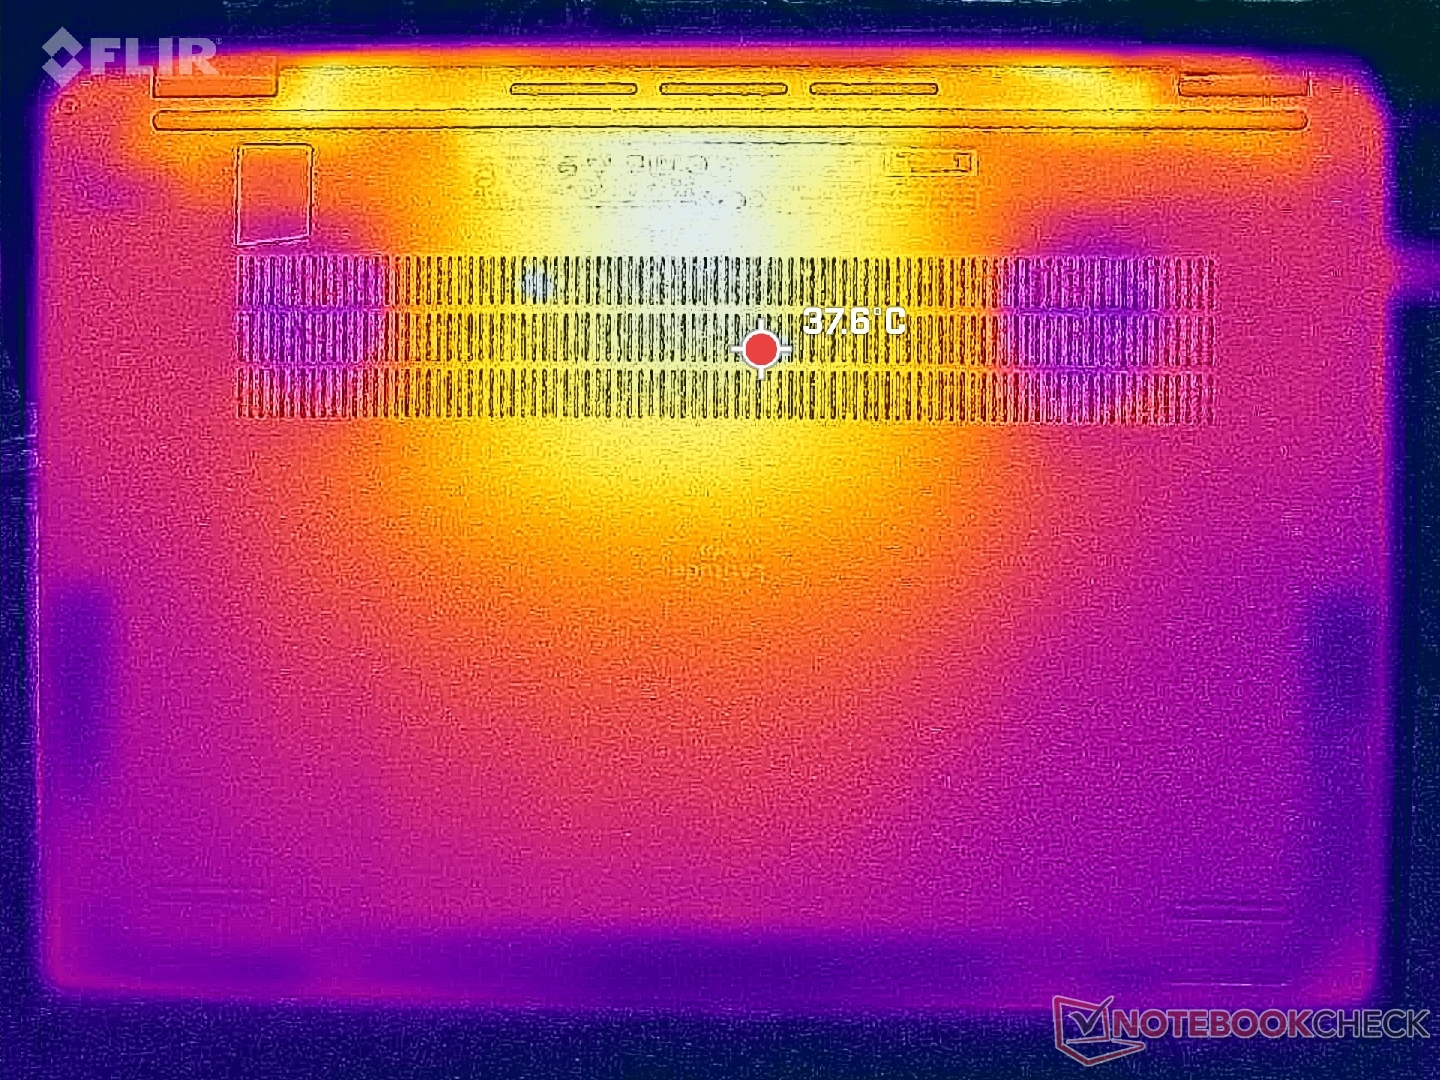
Temperature
Hot spots near the center of the base can reach 36 C and 38 C depending on the side. Results remain much cooler than on the HP EliteBook 1040 G10 or MSI Summit E14 Flip Evo where hot spots can reach over 45 C in comparison.
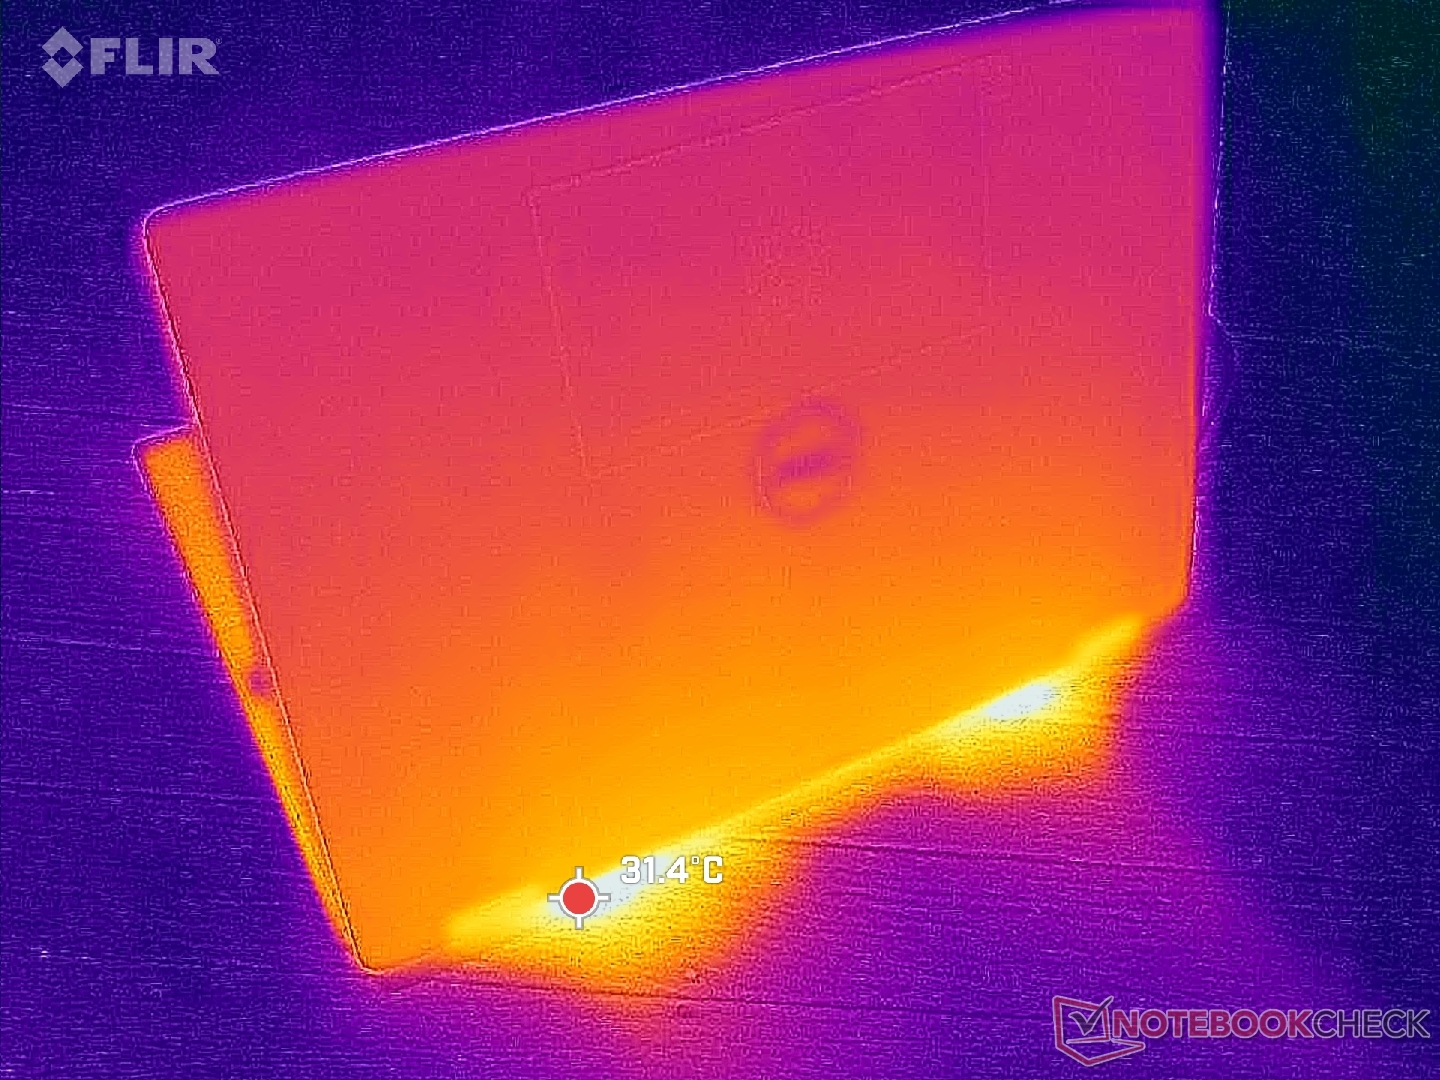
(+) The maximum temperature on the upper side is 35.4 °C / 96 F, compared to the average of 35.3 °C / 96 F, ranging from 19.6 to 55.7 °C for the class Convertible.
(+) The bottom heats up to a maximum of 37.8 °C / 100 F, compared to the average of 36.7 °C / 98 F
(+) In idle usage, the average temperature for the upper side is 26.8 °C / 80 F, compared to the device average of 30.2 °C / 86 F.
(+) The palmrests and touchpad are cooler than skin temperature with a maximum of 28 °C / 82.4 F and are therefore cool to the touch.
(±) The average temperature of the palmrest area of similar devices was 28.1 °C / 82.6 F (+0.1 °C / 0.2 F).
| Dell Latitude 9450 2-in-1 Intel Core Ultra 7 165U, Intel Graphics 4-Cores iGPU (Arc) | Dell Latitude 9440 2-in-1 Intel Core i7-1365U, Intel Iris Xe Graphics G7 96EUs | HP EliteBook 1040 G10 818N7EA Intel Core i5-1335U, Intel Iris Xe Graphics G7 80EUs | Asus Expertbook B5 Flip B5402F, i7-1360P Intel Core i7-1360P, Intel Iris Xe Graphics G7 96EUs | Lenovo Yoga 9 2-in-1 14IMH9 Intel Core Ultra 7 155H, Intel Arc 8-Cores iGPU | MSI Summit E14 Flip Evo A12MT Intel Core i7-1260P, Intel Iris Xe Graphics G7 96EUs | |
|---|---|---|---|---|---|---|
| Heat | -12% | -6% | -8% | -18% | 1% | |
| Maximum Upper Side * | 35.4 | 40.8 -15% | 40.5 -14% | 42 -19% | 40 -13% | 44.2 -25% |
| Maximum Bottom * | 37.8 | 40 -6% | 45.8 -21% | 40 -6% | 43 -14% | 45.8 -21% |
| Idle Upper Side * | 27.2 | 30.4 -12% | 25.5 6% | 25.8 5% | 32 -18% | 19.6 28% |
| Idle Bottom * | 28.2 | 32.8 -16% | 26.1 7% | 32 -13% | 35.2 -25% | 22 22% |
* ... smaller is better
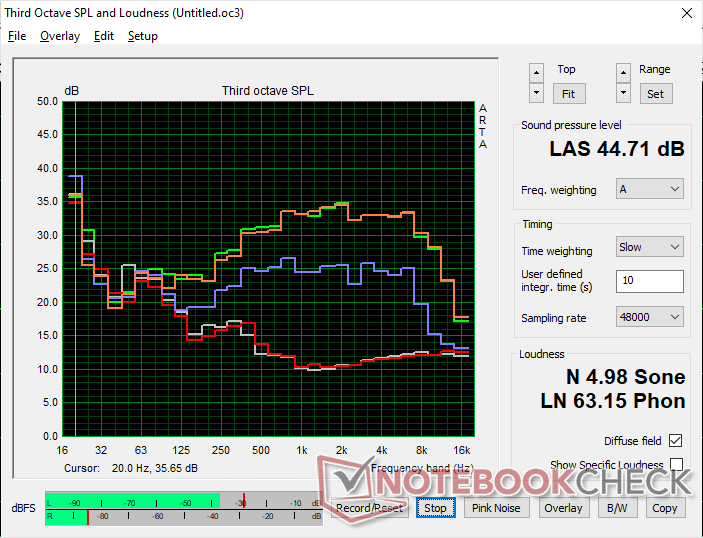
Speakers
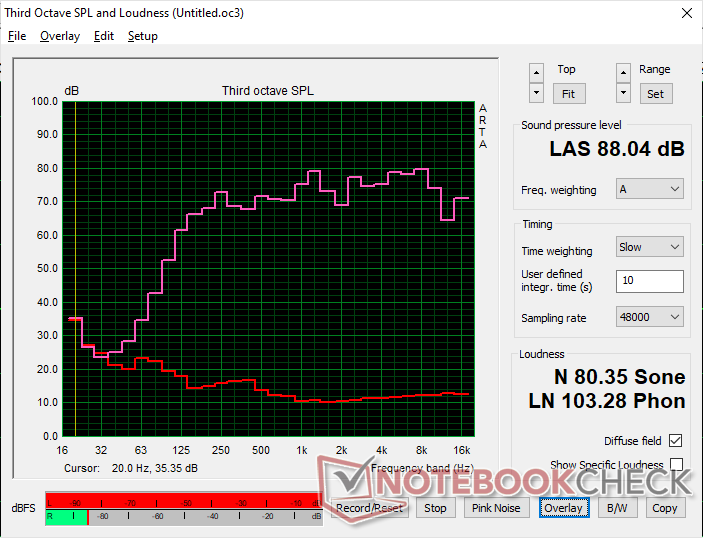
Dell Latitude 9450 2-in-1 audio analysis
(+) | speakers can play relatively loud (88 dB)
Bass 100 - 315 Hz
(±) | reduced bass - on average 8% lower than median
(±) | linearity of bass is average (9.5% delta to prev. frequency)
Mids 400 - 2000 Hz
(+) | balanced mids - only 3% away from median
(+) | mids are linear (5% delta to prev. frequency)
Highs 2 - 16 kHz
(+) | balanced highs - only 3.9% away from median
(+) | highs are linear (5.3% delta to prev. frequency)
Overall 100 - 16.000 Hz
(+) | overall sound is linear (8.7% difference to median)
Compared to same class
» 3% of all tested devices in this class were better, 1% similar, 96% worse
» The best had a delta of 6%, average was 21%, worst was 57%
Compared to all devices tested
» 2% of all tested devices were better, 0% similar, 98% worse
» The best had a delta of 4%, average was 25%, worst was 134%
Apple MacBook Pro 16 2021 M1 Pro audio analysis
(+) | speakers can play relatively loud (84.7 dB)
Bass 100 - 315 Hz
(+) | good bass - only 3.8% away from median
(+) | bass is linear (5.2% delta to prev. frequency)
Mids 400 - 2000 Hz
(+) | balanced mids - only 1.3% away from median
(+) | mids are linear (2.1% delta to prev. frequency)
Highs 2 - 16 kHz
(+) | balanced highs - only 1.9% away from median
(+) | highs are linear (2.7% delta to prev. frequency)
Overall 100 - 16.000 Hz
(+) | overall sound is linear (4.6% difference to median)
Compared to same class
» 0% of all tested devices in this class were better, 0% similar, 100% worse
» The best had a delta of 5%, average was 18%, worst was 45%
Compared to all devices tested
» 0% of all tested devices were better, 0% similar, 100% worse
» The best had a delta of 4%, average was 25%, worst was 134%
Energy Management
Power Consumption
Running Witcher 3 consumes just 36 W on average compared to 52 W on the Latitude 9440 2-in-1 with older Iris Xe 96 EUs graphics. Thus, not only is our newer model slightly faster, but it also consumes less power for much higher performance-per-watt. This key advantage is likely responsible for the longer battery life as explained in the next section below.
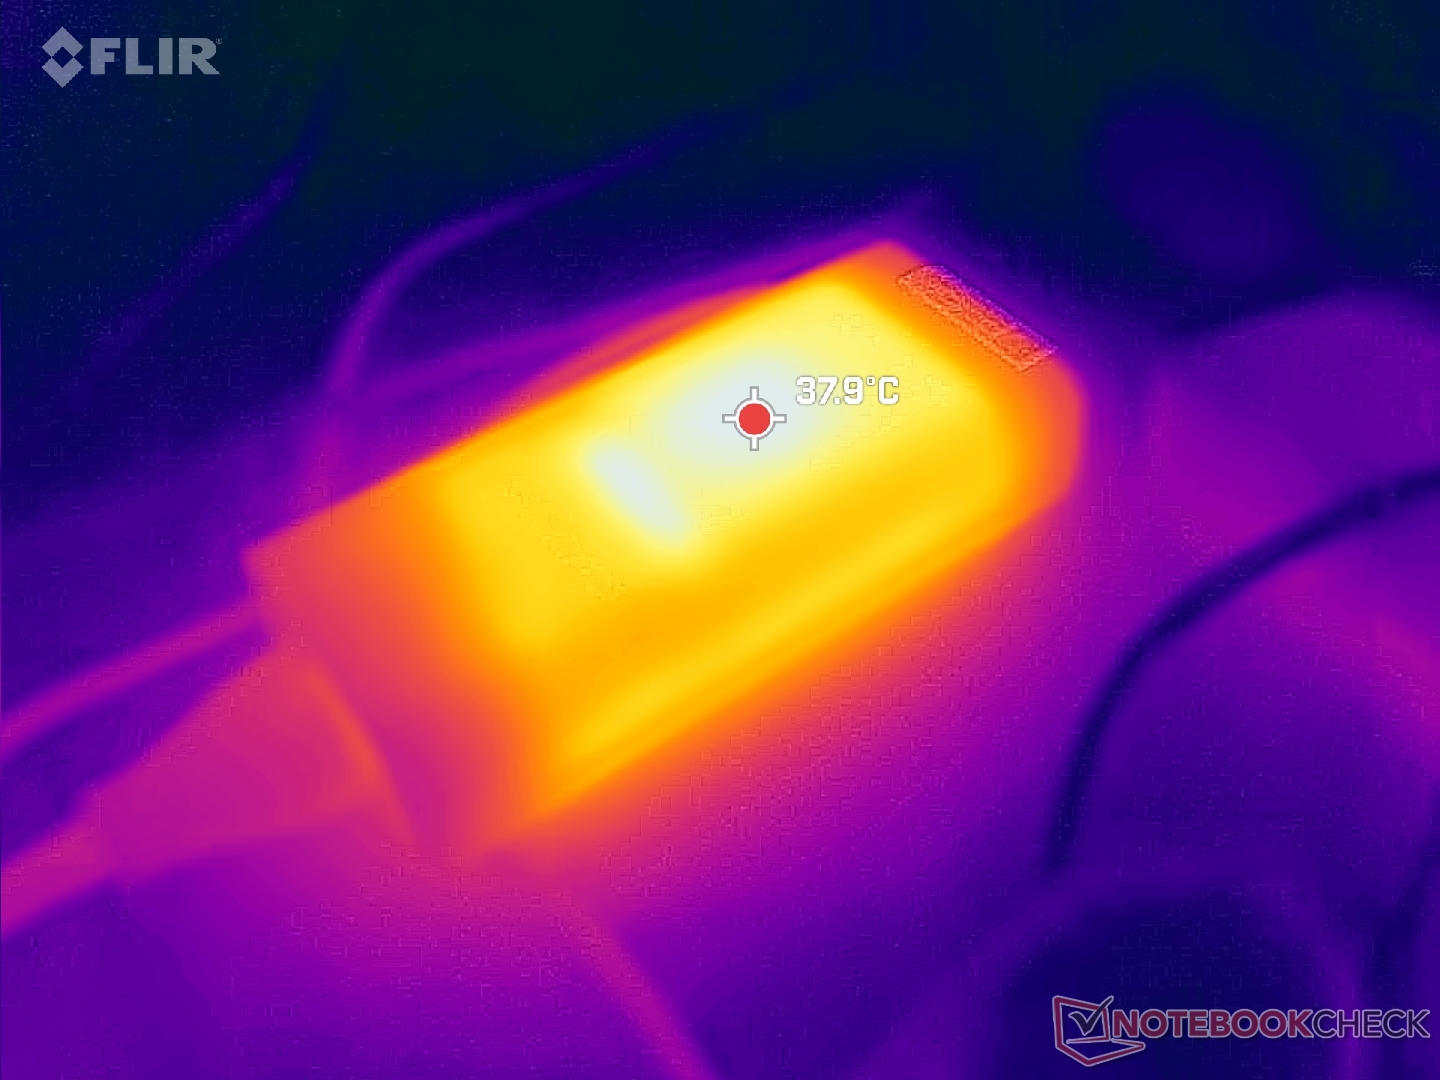
The same 65 W USB-C AC adapter ships with both the Latitude 9450 2-in-1 and Latitude 9440 2-in-1.
(Editor's note: This section will be updated when repairs on our Metrahit Energy multimeter are completed later this month. We apologize for the inconvenience.)
| Dell Latitude 9450 2-in-1 Ultra 7 165U, Graphics 4-Core, , IPS, 2560x1600, 14.00 | Dell Latitude 9440 2-in-1 i7-1365U, Iris Xe G7 96EUs, Samsung PM9B1 1024GB MZAL41T0HBLB, IPS, 2560x1600, 14.00 | HP EliteBook 1040 G10 818N7EA i5-1335U, Iris Xe G7 80EUs, Samsung MZ9L4512HBLU-00BMV, IPS, 1920x1200, 14.00 | Asus Expertbook B5 Flip B5402F, i7-1360P i7-1360P, Iris Xe G7 96EUs, Micron 2400 MTFDKBA1T0QFM, IPS, 1920x1080, 14.00 | Lenovo Yoga 9 2-in-1 14IMH9 Ultra 7 155H, Arc 8-Cores, Samsung PM9C1a MZAL81T0HDLB, OLED, 2880x1800, 14.00 | MSI Summit E14 Flip Evo A12MT i7-1260P, Iris Xe G7 96EUs, Samsung PM9A1 MZVL21T0HCLR, IPS, 2880x1800, 14.00 | |
|---|---|---|---|---|---|---|
| Power Consumption | ||||||
| Idle Minimum * | 4.2 | 2.8 | 9.6 | 5.4 | ||
| Idle Average * | 6.9 | 6.1 | 10.3 | 9.5 | ||
| Idle Maximum * | 7.8 | 6.3 | 8.6 | 12.4 | ||
| Load Average * | 46 | 48.9 | 58.028 | 54.7 | ||
| Witcher 3 ultra * | 51.9 | 38.2 | 39.6 | 52 | ||
| Load Maximum * | 68.2 | 65.9 | 65.28 | 63.4 |
* ... smaller is better
Power Consumption Witcher 3 / Stresstest
Power Consumption external Monitor
Battery Life
Battery life has improved by relatively wide margins which appears to be a theme with Meteor Lake laptops. WLAN runtime is about 13.5 hours to be over 4 hours longer than what we recorded on the older Latitude 9440 2-in-1.
| Dell Latitude 9450 2-in-1 Ultra 7 165U, Graphics 4-Core, 60 Wh | Dell Latitude 9440 2-in-1 i7-1365U, Iris Xe G7 96EUs, 60 Wh | HP EliteBook 1040 G10 818N7EA i5-1335U, Iris Xe G7 80EUs, 51 Wh | Asus Expertbook B5 Flip B5402F, i7-1360P i7-1360P, Iris Xe G7 96EUs, 63 Wh | Lenovo Yoga 9 2-in-1 14IMH9 Ultra 7 155H, Arc 8-Cores, 75 Wh | MSI Summit E14 Flip Evo A12MT i7-1260P, Iris Xe G7 96EUs, 72 Wh | |
|---|---|---|---|---|---|---|
| Battery Runtime | -24% | -19% | 16% | -32% | -19% | |
| Reader / Idle | 1300 | 1423 9% | 855 -34% | 1324 2% | ||
| WiFi v1.3 | 815 | 555 -32% | 587 -28% | 641 -21% | 600 -26% | 494 -39% |
| Load | 143 | 73 -49% | 130 -9% | 218 52% | 93 -35% | 114 -20% |
| H.264 | 764 |
Pros
Cons
Verdict — Just A Minor Update All Things Considered
The 2024 Latitude 9450 2-in-1 offers little over the 2023 Latitude 9440 2-in-1. The most significant changes are the modestly faster CPU and GPU and longer battery life which may appease certain power users or travelers. Otherwise, there isn't anything very exciting to encourage users to purchase it over the 2023 version. A new display option, for example, would have been nice to see alongside the CPU upgrade.
The Latitude 9450 2-in-1 offers an essentially identical user experience as the Latitude 9440 2-in-1. If your daily tasks don't benefit from local AI acceleration, then save yourself some money and just purchase the Latitude 9440 2-in-1 instead.
Of course, it's impossible to talk about laptops these days without mentioning AI. The Latitude 9450 2-in-1 indeed features an integrated NPU to better distinguish it from previous generation models. As of this writing, however, the vast majority of programs do not yet make use of the NPU. Buying the Latitude 9450 2-in-1 today will mean investing in the NPU and its future applications within Windows. If local AI acceleration and Microsoft Co-Pilot don't tickle your fancy, then the Latitude 9440 2-in-1 can provide essentially the same experience for less.
Price and Availability
Dell is now shipping the Latitude 9450 2-in-1 starting at $2320 for the base COre Ultra 5 125U configuration up to just over $3000 if configured with the Core Ultra 7 165H.
Dell Latitude 9450 2-in-1
-
04/16/2024 v7
Allen Ngo
More articles related to this device
Dell Latitude 9450 2-in-1 (Latitude Series)Related Articles


Transparency
The present review sample was made available to the author as a loan by the manufacturer or a shop for the purposes of review. The lender had no influence on this review, nor did the manufacturer receive a copy of this review before publication. There was no obligation to publish this review.
Pricecompare
