 Deutsch
 English
 Español
 Français
 Italiano
 Nederlands
 Polski
 Português
 Русский
 Türkçe
 Svenska
 Chinese
 Magyar
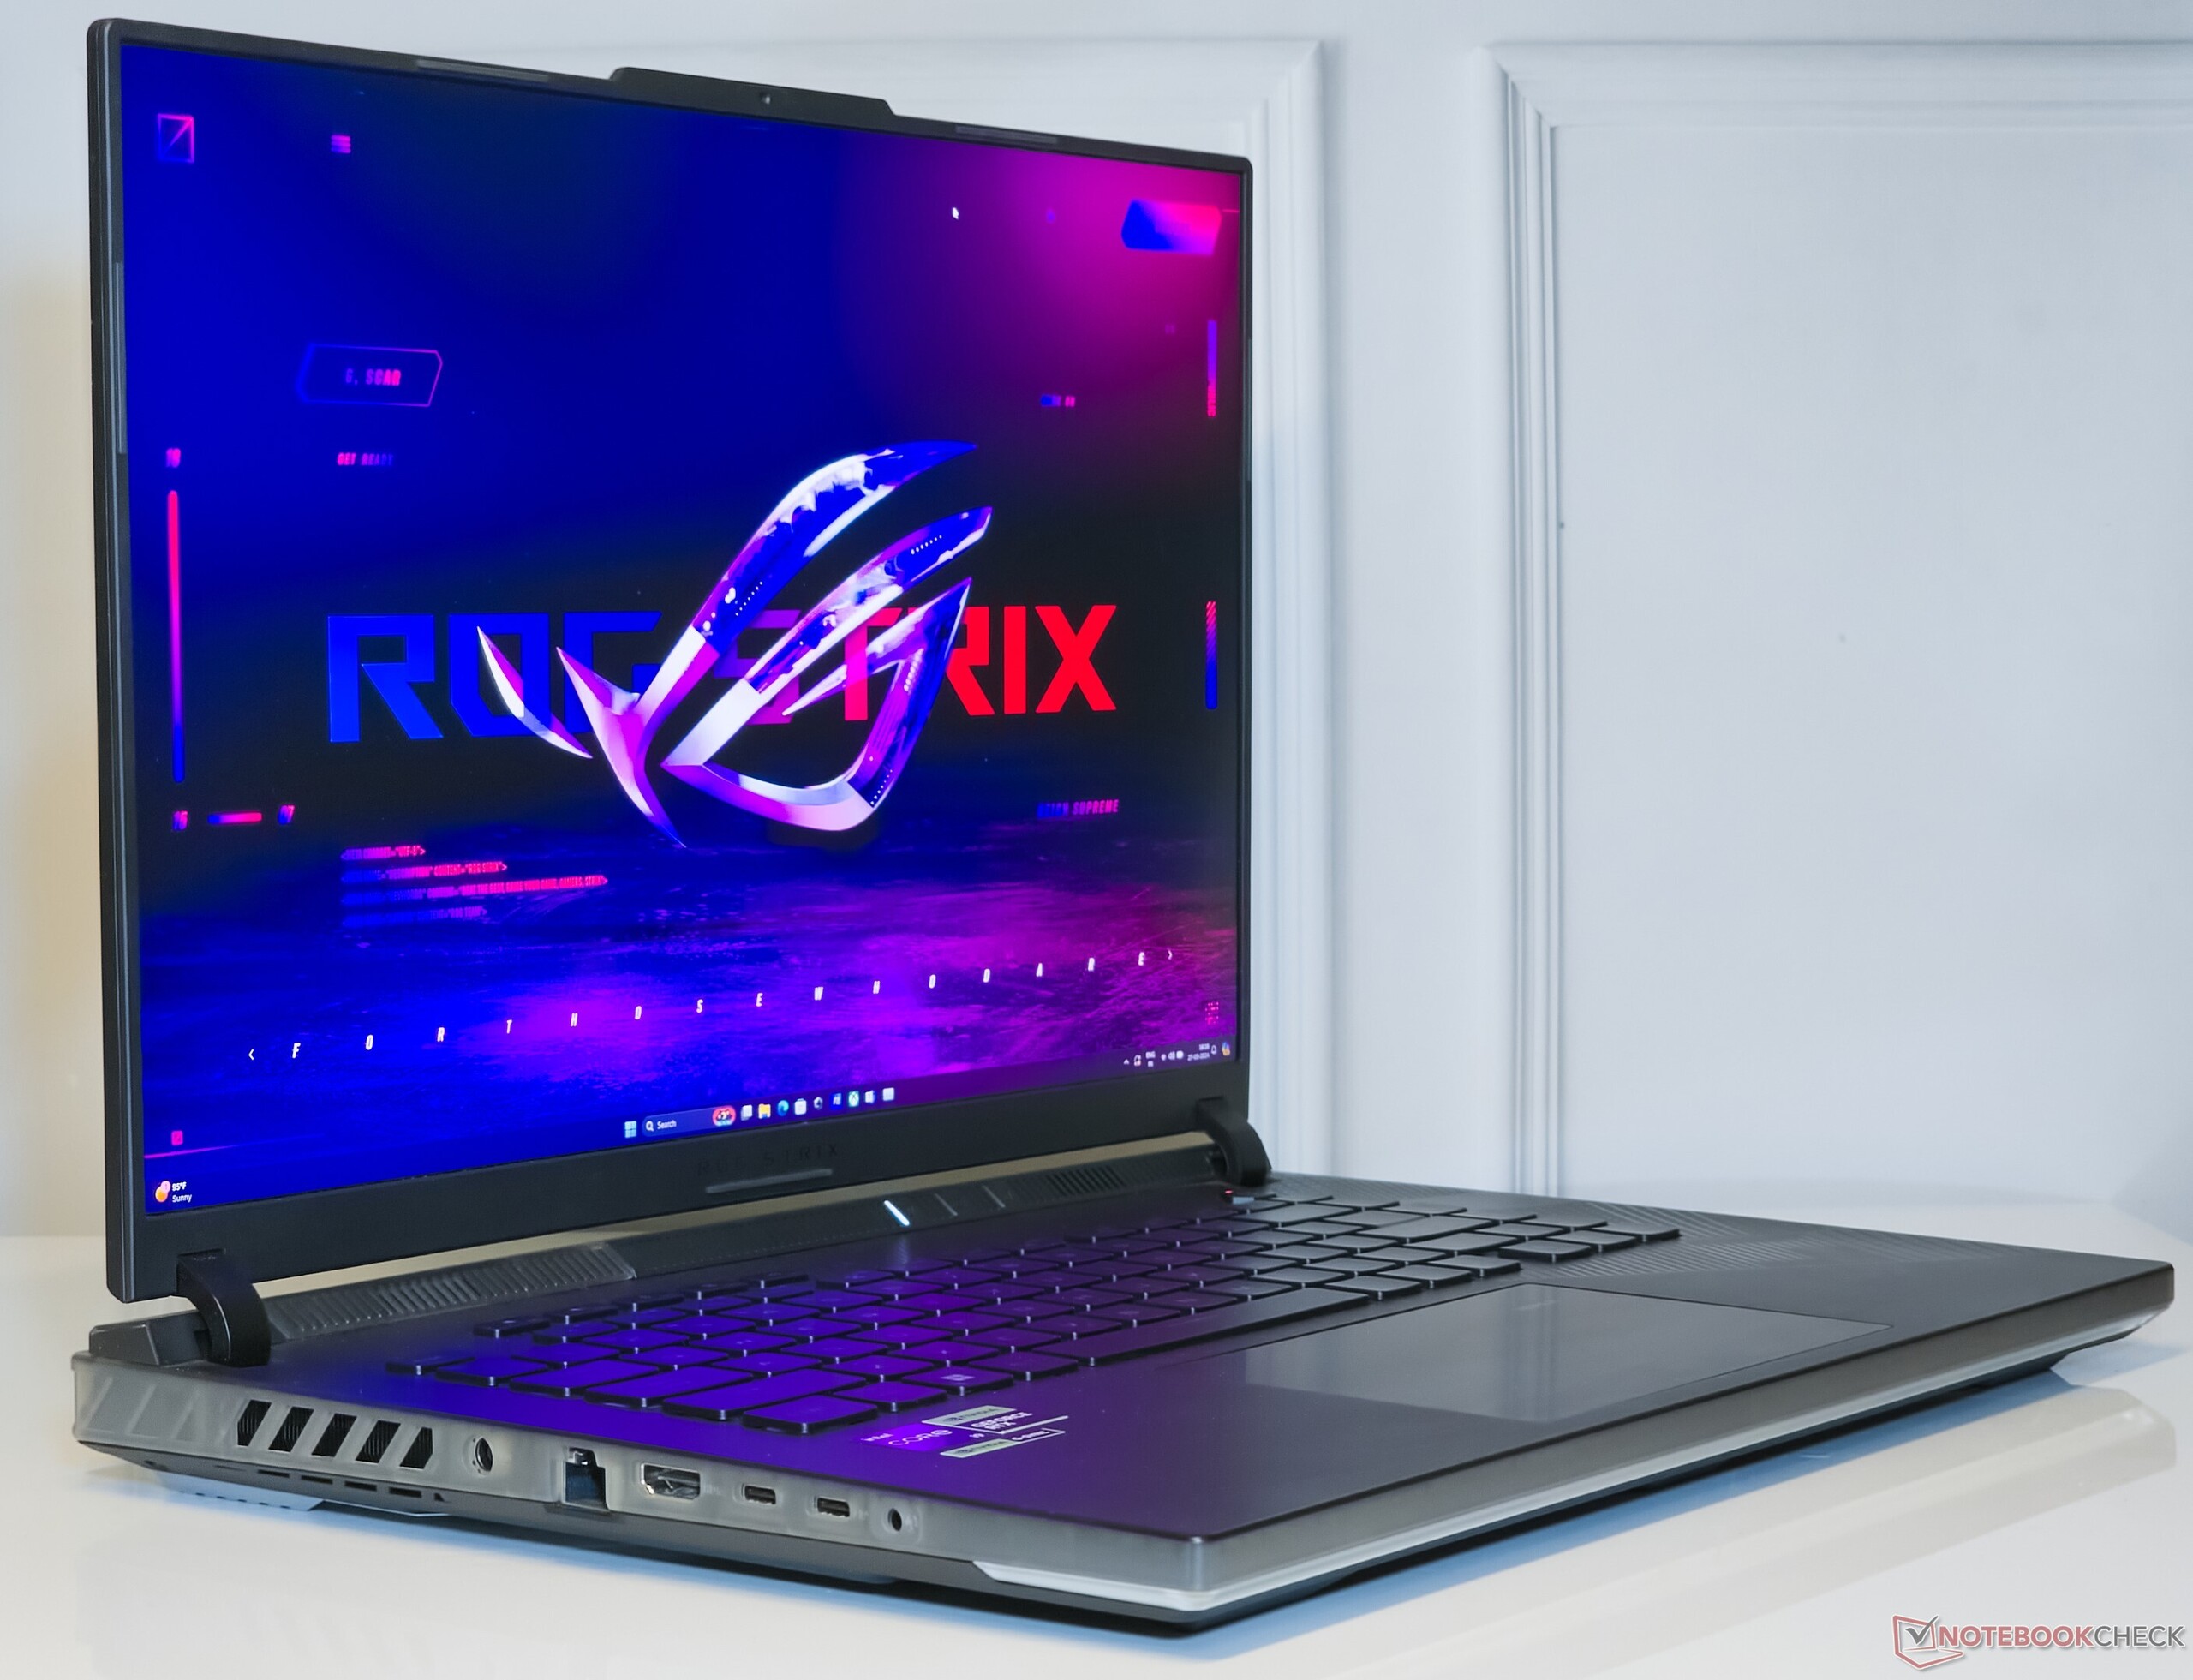
Asus ROG Strix Scar 16 (2024) Laptop Review: Fiery performance and mini LED brilliance with a price to match
 in review")
Asus has upgraded its entire laptop lineup at CES 2024. Among the 2024 gaming variants, we've reviewed the ROG Zephyrus G14, ROG Zephyrus G16, and ROG Strix Scar 18 so far. Today, we take a look at the new ROG Strix Scar 16.
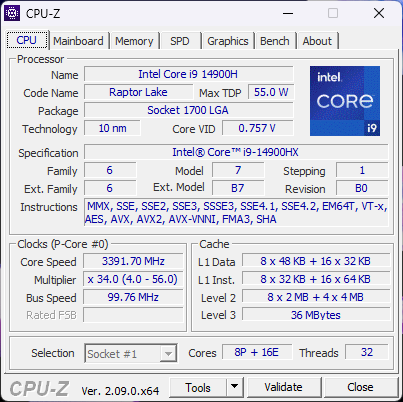
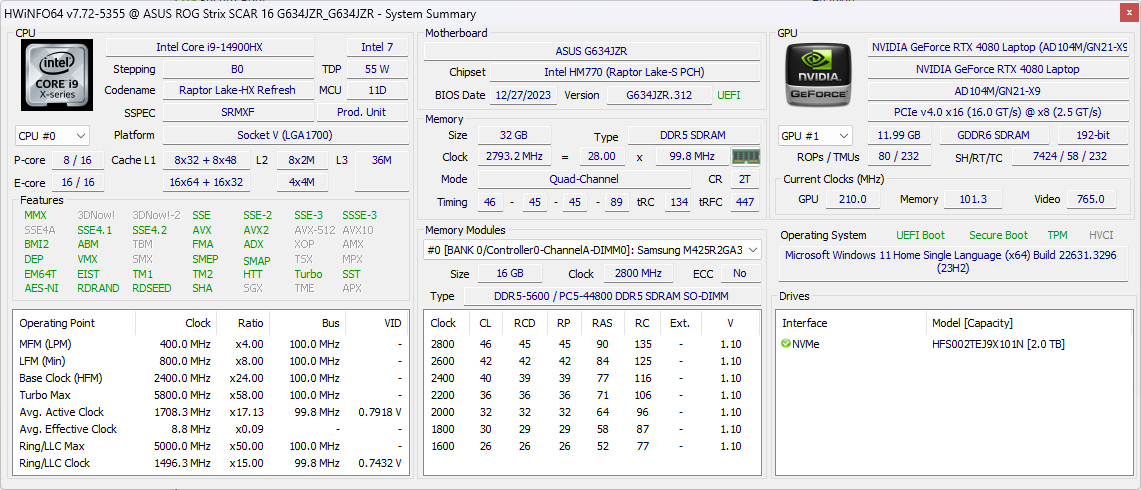
The ROG Strix Scar 16 is aimed at the upper echelon gaming crowd and has the necessary hardware to boot. Our test device is based on the Intel Core i9-14900HX Raptor Lake-HX processor complemented by a 175 W Nvidia GeForce RTX 4080 Laptop GPU.
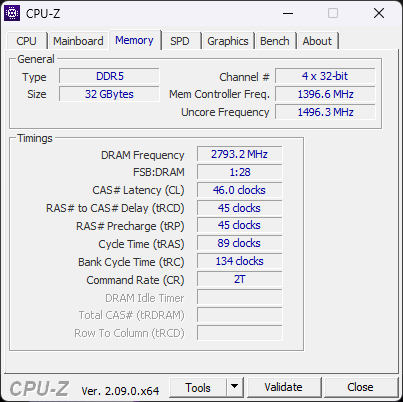
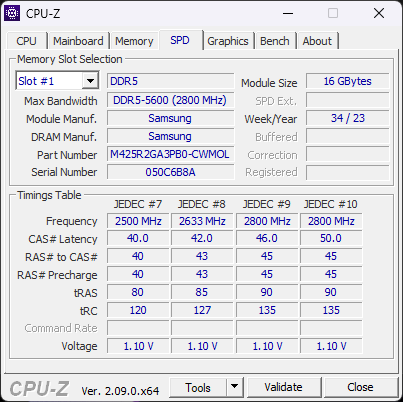
Other droolworthy specs include 32 GB DDR5-5600 RAM, a 2 TB NVMe SSD, and a QHD+ 240 Hz mini-LED G-Sync display that together have no qualms in putting a ₹2,89,990 (~US$3,473) hole in your wallet.
Potential competitors in comparison
Rating | Date | Model | Weight | Height | Size | Resolution | Best Price |
|---|---|---|---|---|---|---|---|
| 87.6 % | 04/2024 | Asus ROG Strix Scar 16 G634JZR i9-14900HX, NVIDIA GeForce RTX 4080 Laptop GPU | 2.7 kg | 30.4 mm | 16.00" | 2560x1600 | |
| 87.2 % | 08/2023 | Asus ROG Strix Scar 17 G733PYV-LL053X R9 7945HX3D, NVIDIA GeForce RTX 4090 Laptop GPU | 2.9 kg | 28.3 mm | 17.30" | 2560x1440 | |
| 88.4 % | 03/2023 | Asus ROG Strix G16 G614JZ i9-13980HX, NVIDIA GeForce RTX 4080 Laptop GPU | 2.4 kg | 30.4 mm | 16.00" | 2560x1600 | |
| 89.5 % | 03/2024 | Lenovo Legion Pro 7 16IRX9H i9-14900HX, NVIDIA GeForce RTX 4080 Laptop GPU | 2.7 kg | 21.95 mm | 16.00" | 2560x1600 | |
| 86.7 % | 02/2024 | HP Omen 16 (2024) i9-14900HX, NVIDIA GeForce RTX 4080 Laptop GPU | 2.4 kg | 23.5 mm | 16.10" | 2560x1440 | |
| 88 % | 02/2024 | MSI Vector 16 HX A14V i9-14900HX, NVIDIA GeForce RTX 4080 Laptop GPU | 2.7 kg | 28.55 mm | 16.00" | 2560x1600 | |
| 90.2 % | 03/2024 | Alienware m16 R2 Ultra 7 155H, NVIDIA GeForce RTX 4070 Laptop GPU | 2.5 kg | 23.5 mm | 16.00" | 2560x1600 |
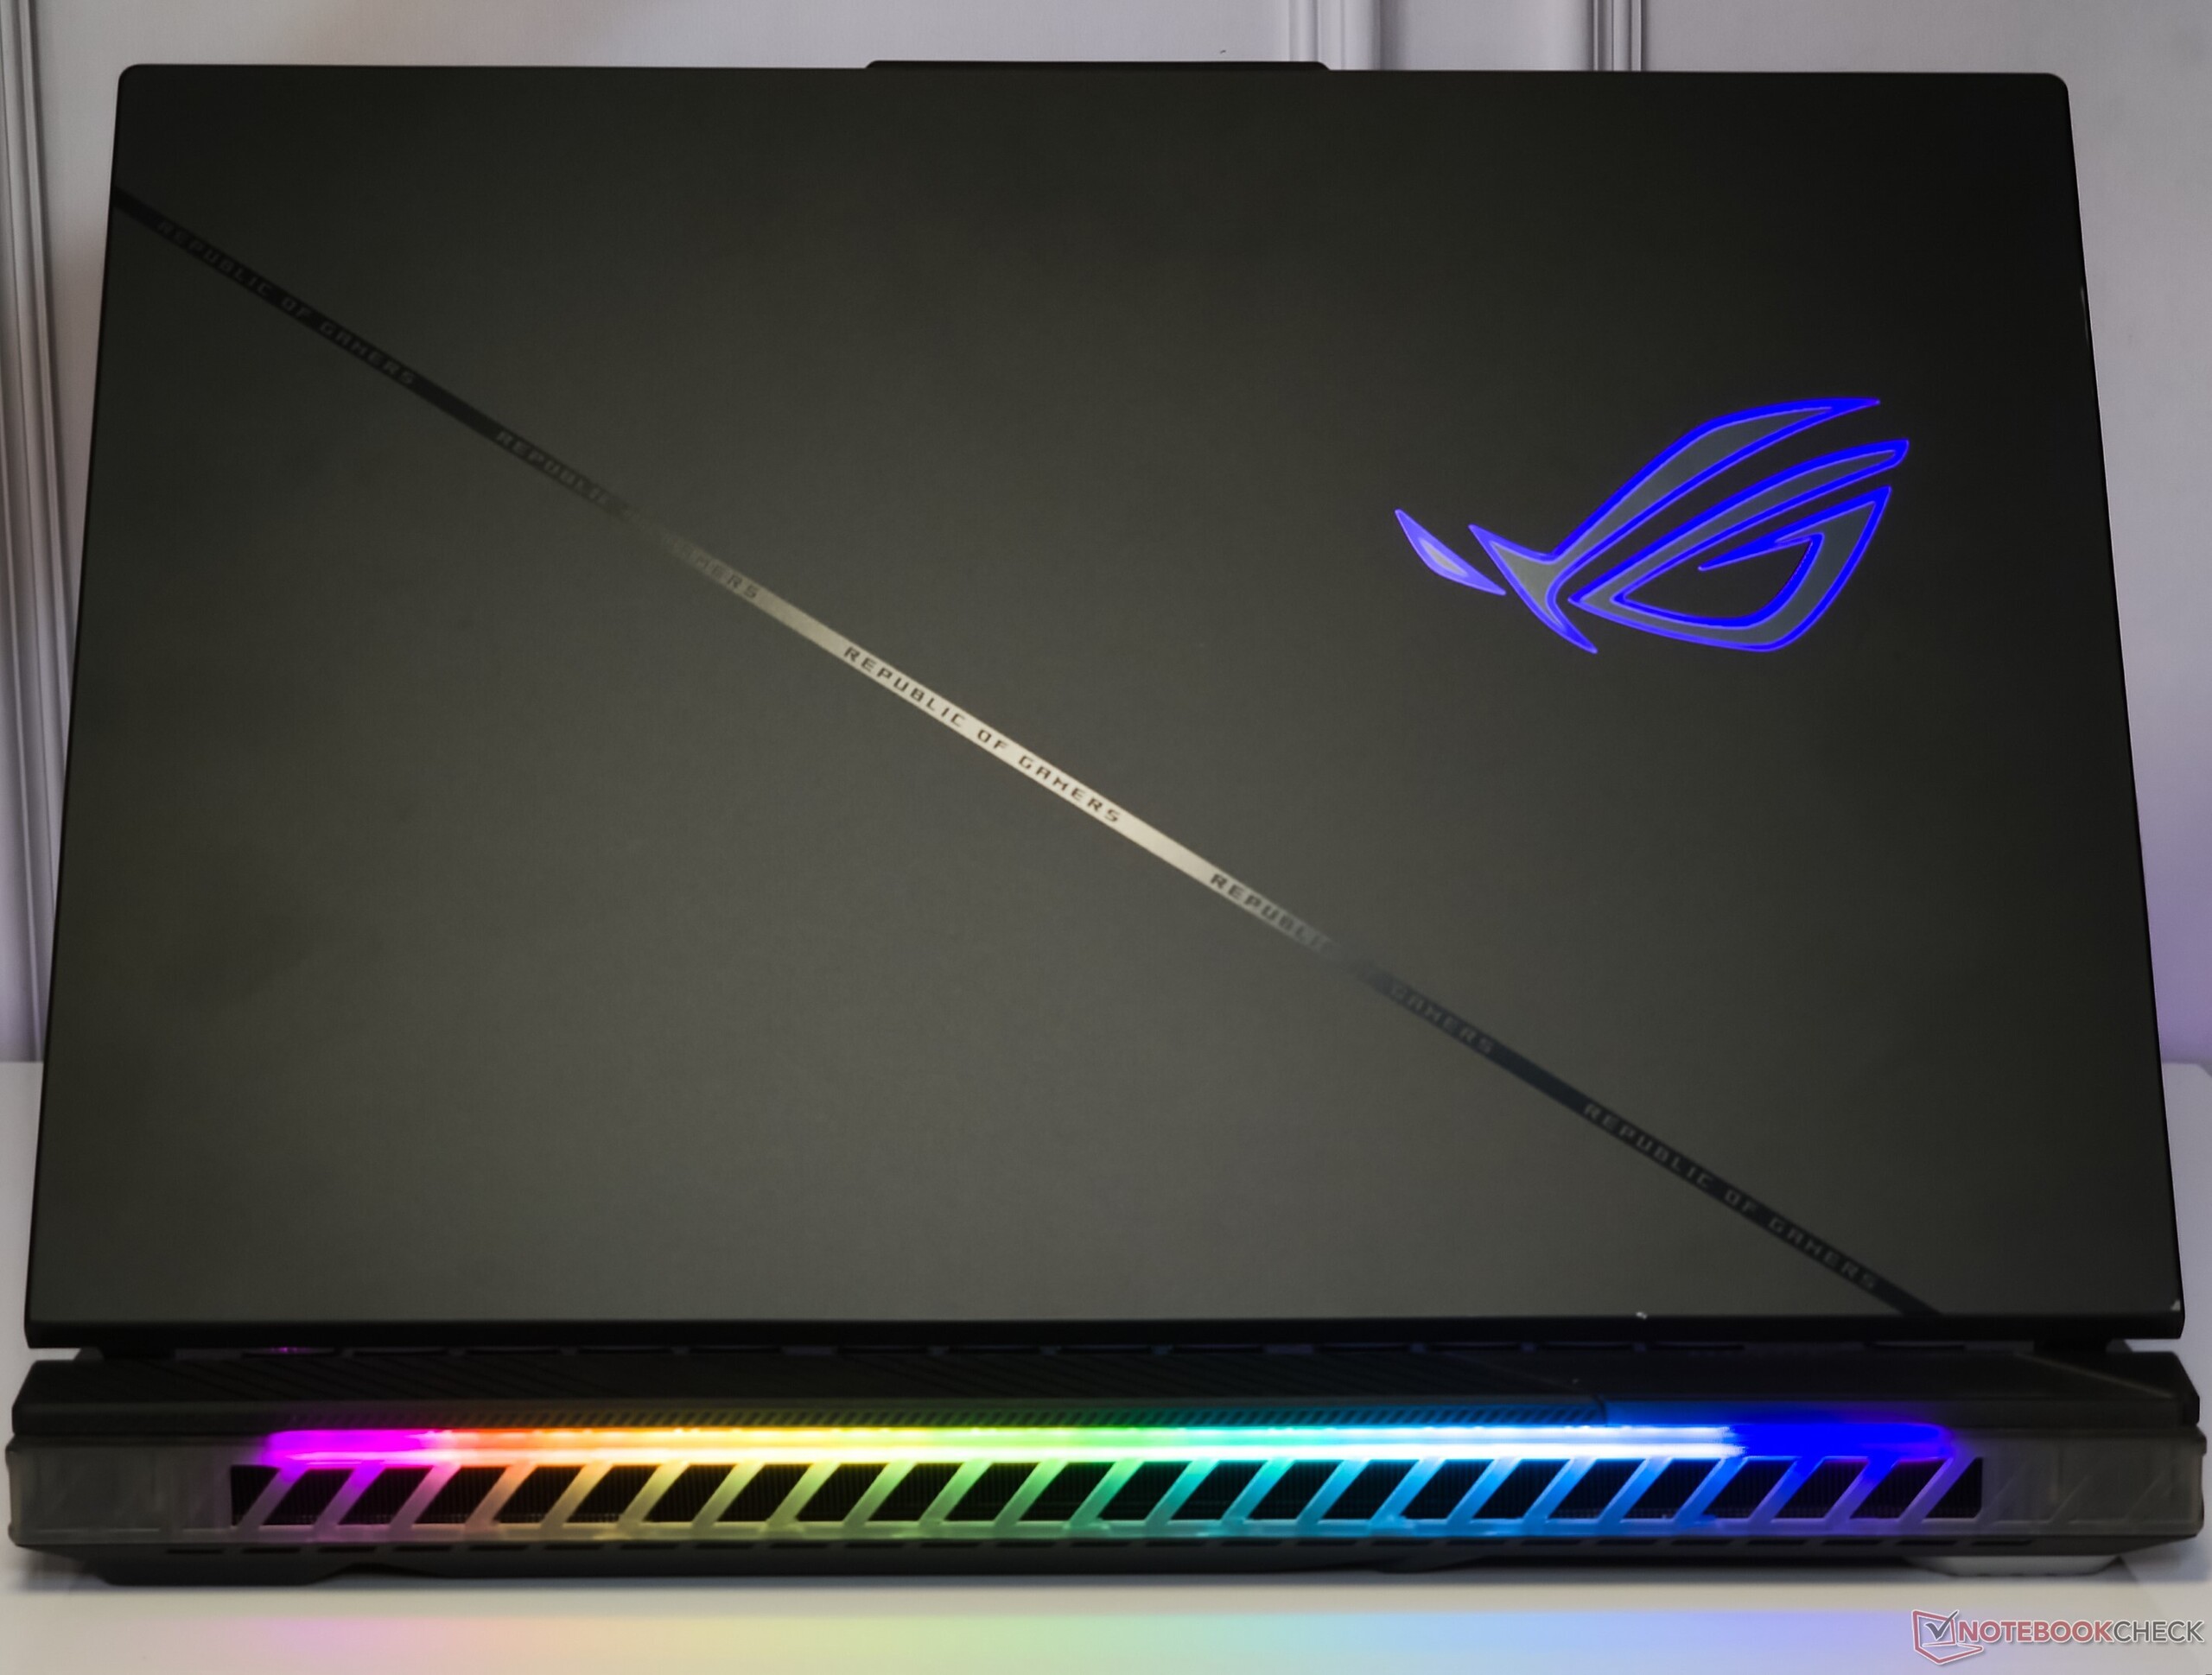
Chassis: Primarily plastic with a translucent peek-a-boo
This year's ROG Strix Scar 16 sports a familiar design language as we have seen before with the 2022 Scar 15 but is now 350 g heavier, tipping the scales at 2.65 kg.
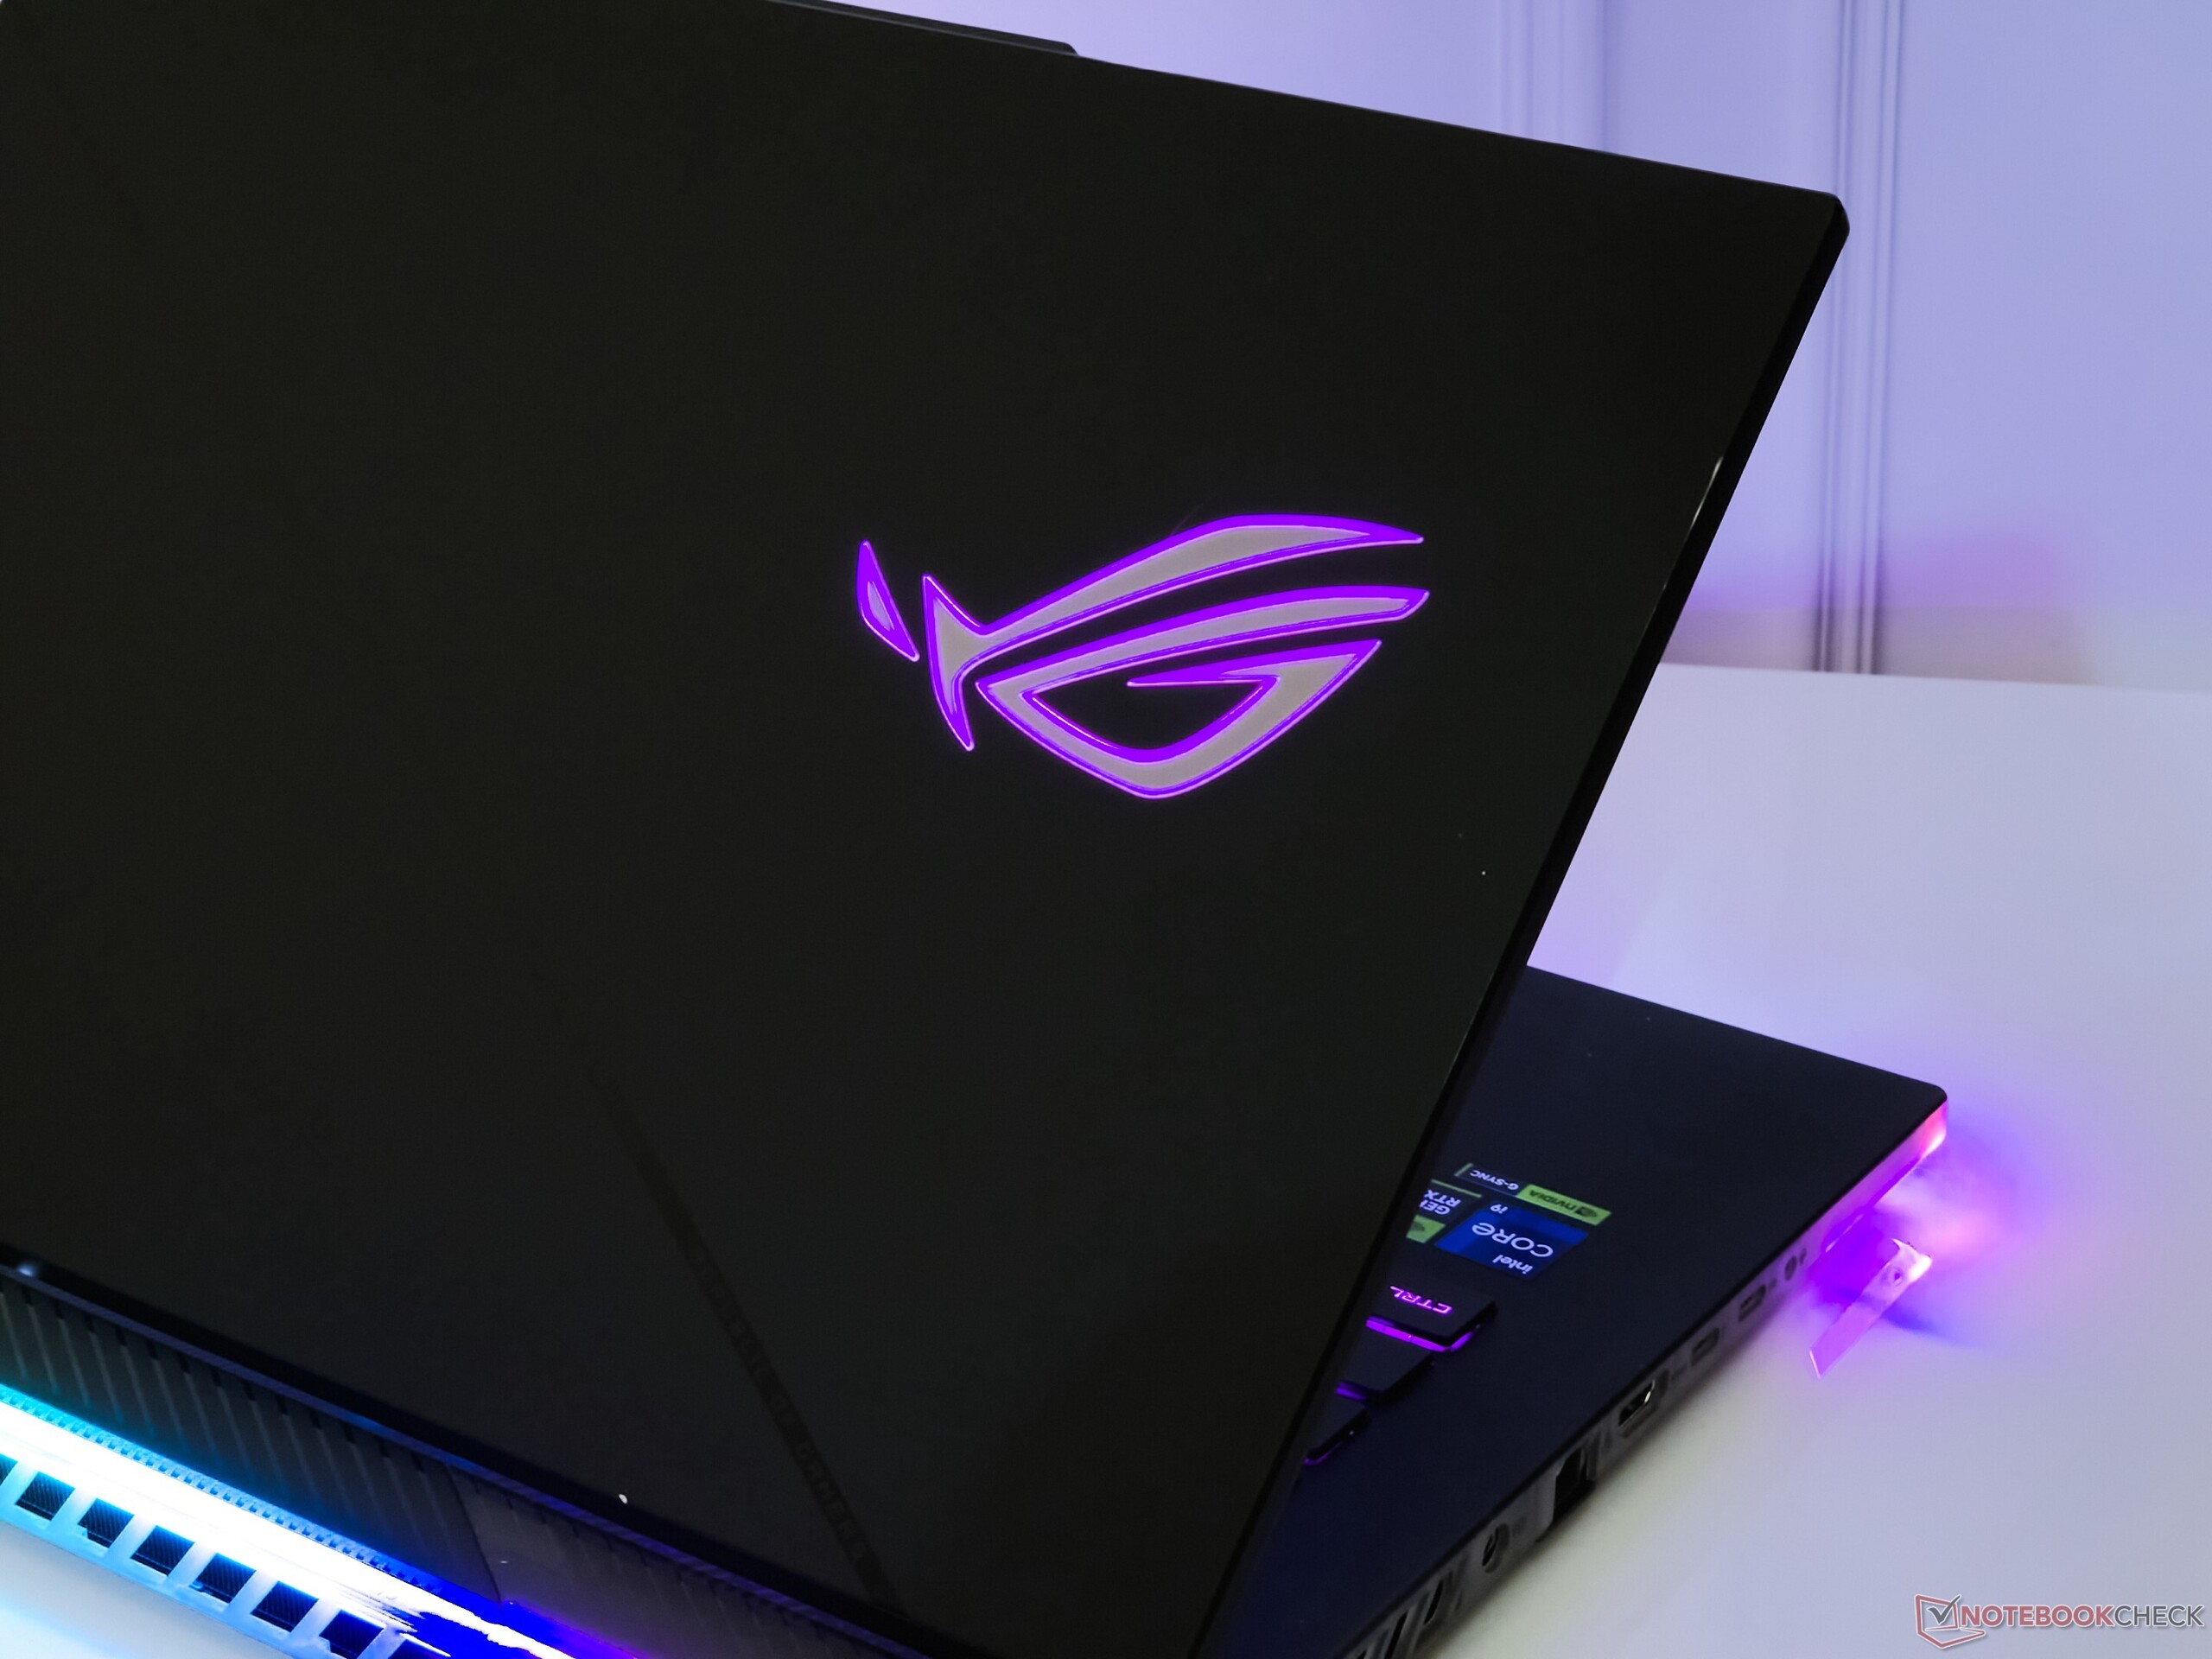
The chassis doesn't flex despite being a plastic construction. The aluminum lid with a matte finish seemed quite sturdy as well with stable hinges.
The lid can be opened with a single finger without the laptop sliding on the desk, which is further prevented by the rubberized base.
Keen watchers of the Scar series will notice that the keyboard deck no longer sports the white diagonal stripe with the ROG logo.
The upper portion of the keyboard deck remains translucent as before, offering a sneak peek into the internals underneath. However, Asus has done little to make the deck fingerprint and grease resistant.
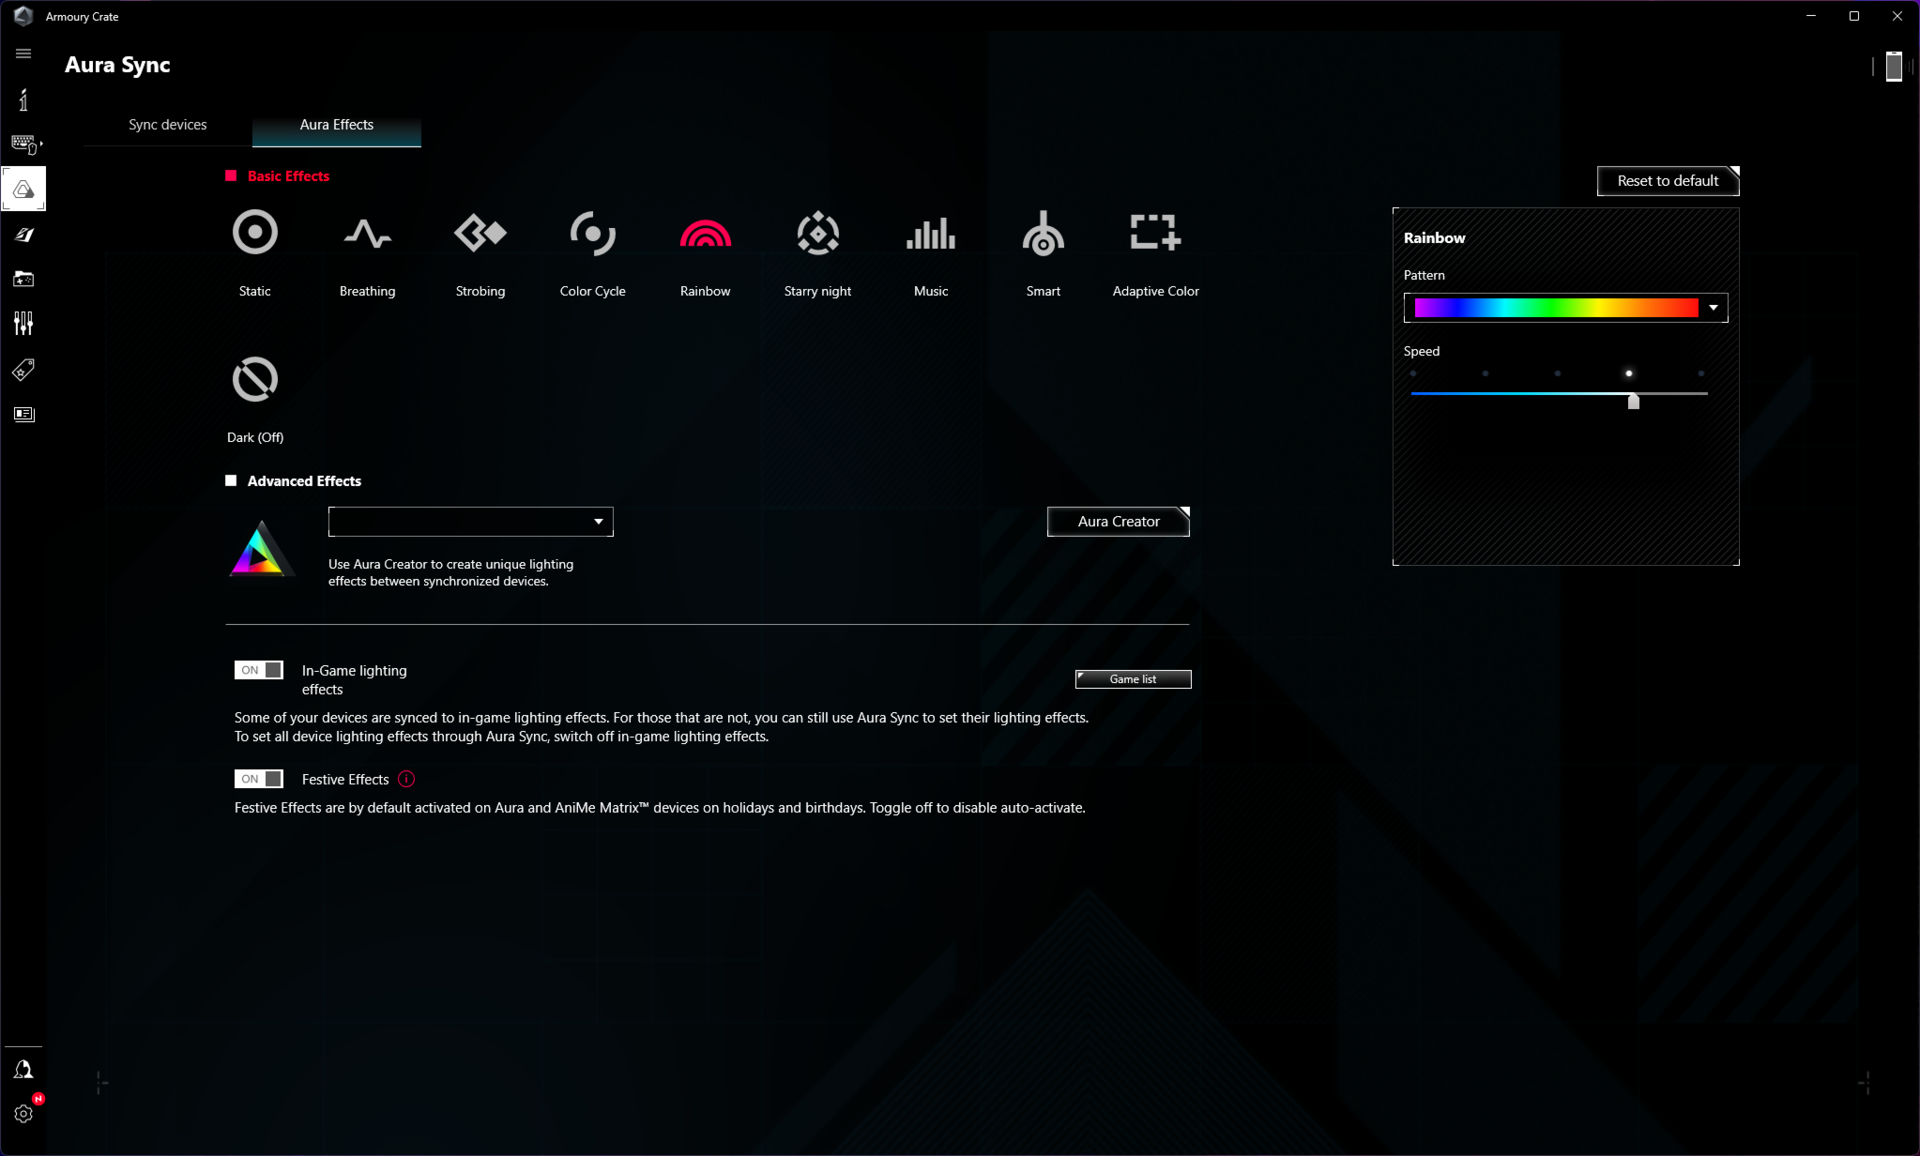
The Scar 16's keyboard, base, the rear, and the ROG logo bask in RGB goodness that can be controlled and customized via Armory Crate. However, there's no apparent way to individually light up these areas — it's either all RGB or none.
True to the Scar's ethos, Asus allows you to custom design and 3D print ROG Armor caps for a touch of personalization.
Connectivity: Mediocre Wi-Fi 5 and 100 W USB power
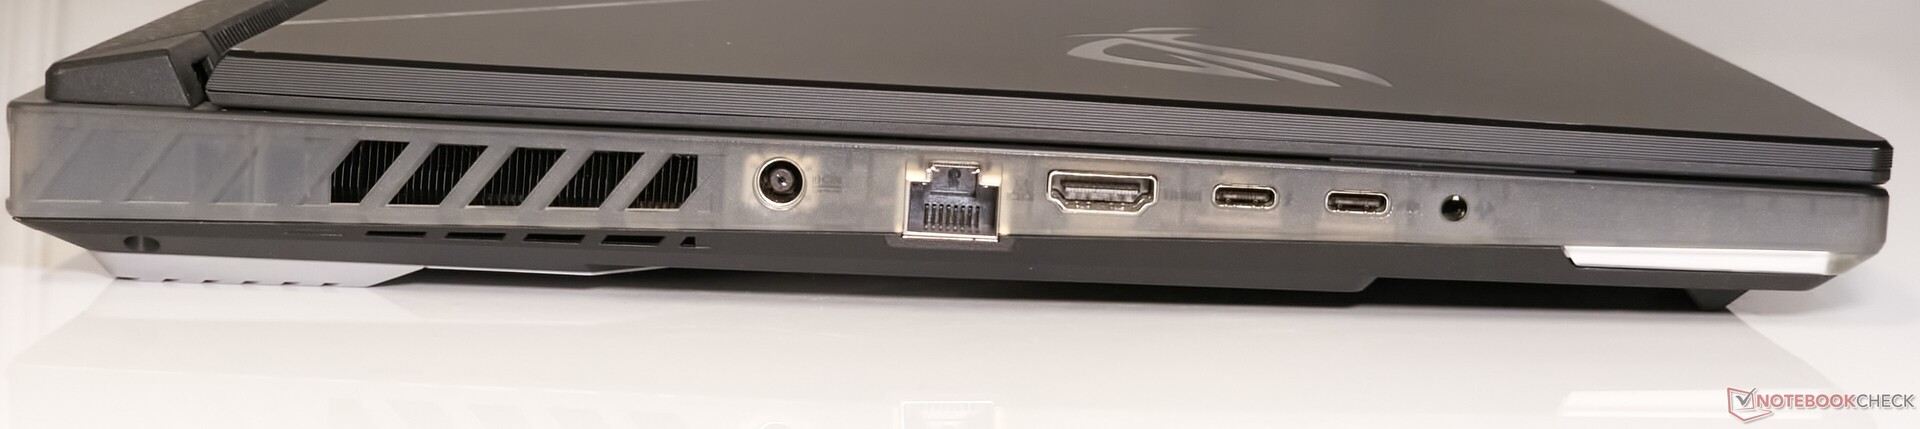
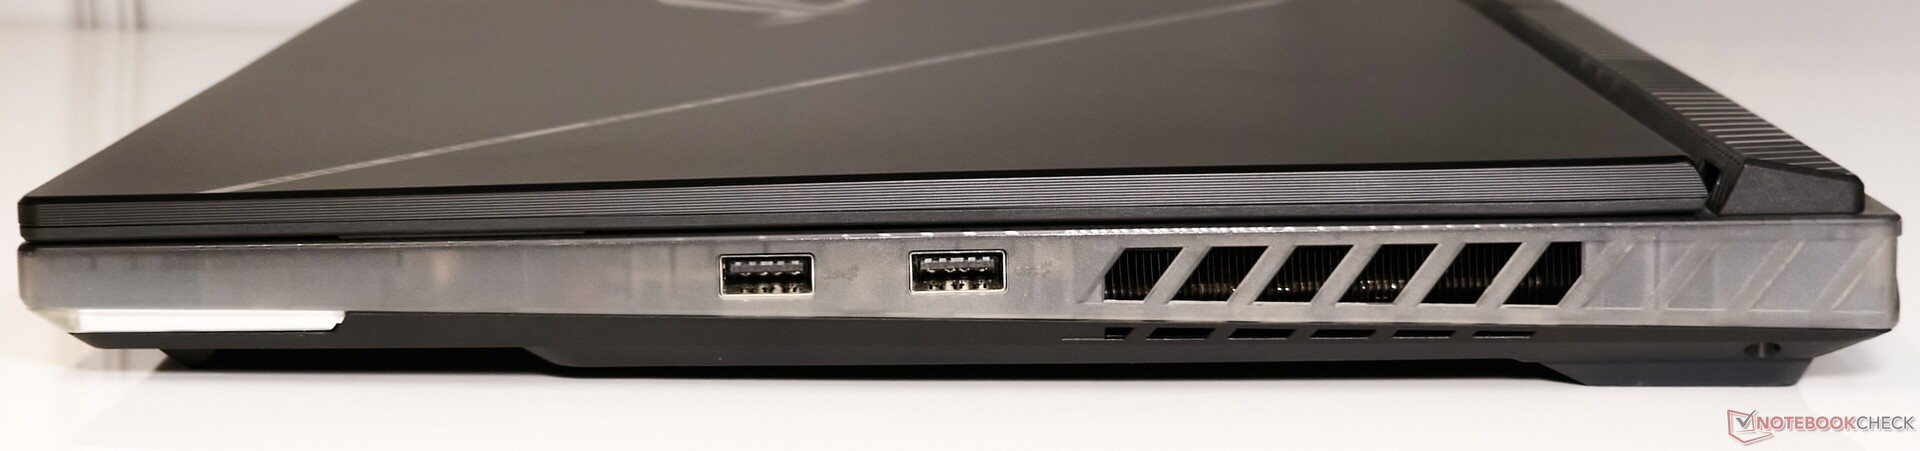
The ROG Strix Scar 16 uses the same port layout and functionality as last year's iteration. No longer does Asus offer the ROG Keystone, which has long been a defining feature of the Scar series, its dubious utility notwithstanding.
Port distribution is uneven. With the exception of two USB 3.2 Gen2 Type-A ports on the right side, all additional ports are located on the left. However, the ports are comfortably spaced and pose no hindrances in connecting multiple peripherals.
There are two USB Type-C ports, one of which is Thunderbolt 4. The Thunderbolt 4 port allows DisplayPort 1.4-out but no charging. The USB 3.2 Gen2 Type-C port, on the other hand, not only offers DisplayPort-out but also 100 W power delivery.
The rear is fully reserved for accommodating the cooling apparatus and as such is devoid of any ports.
Communication
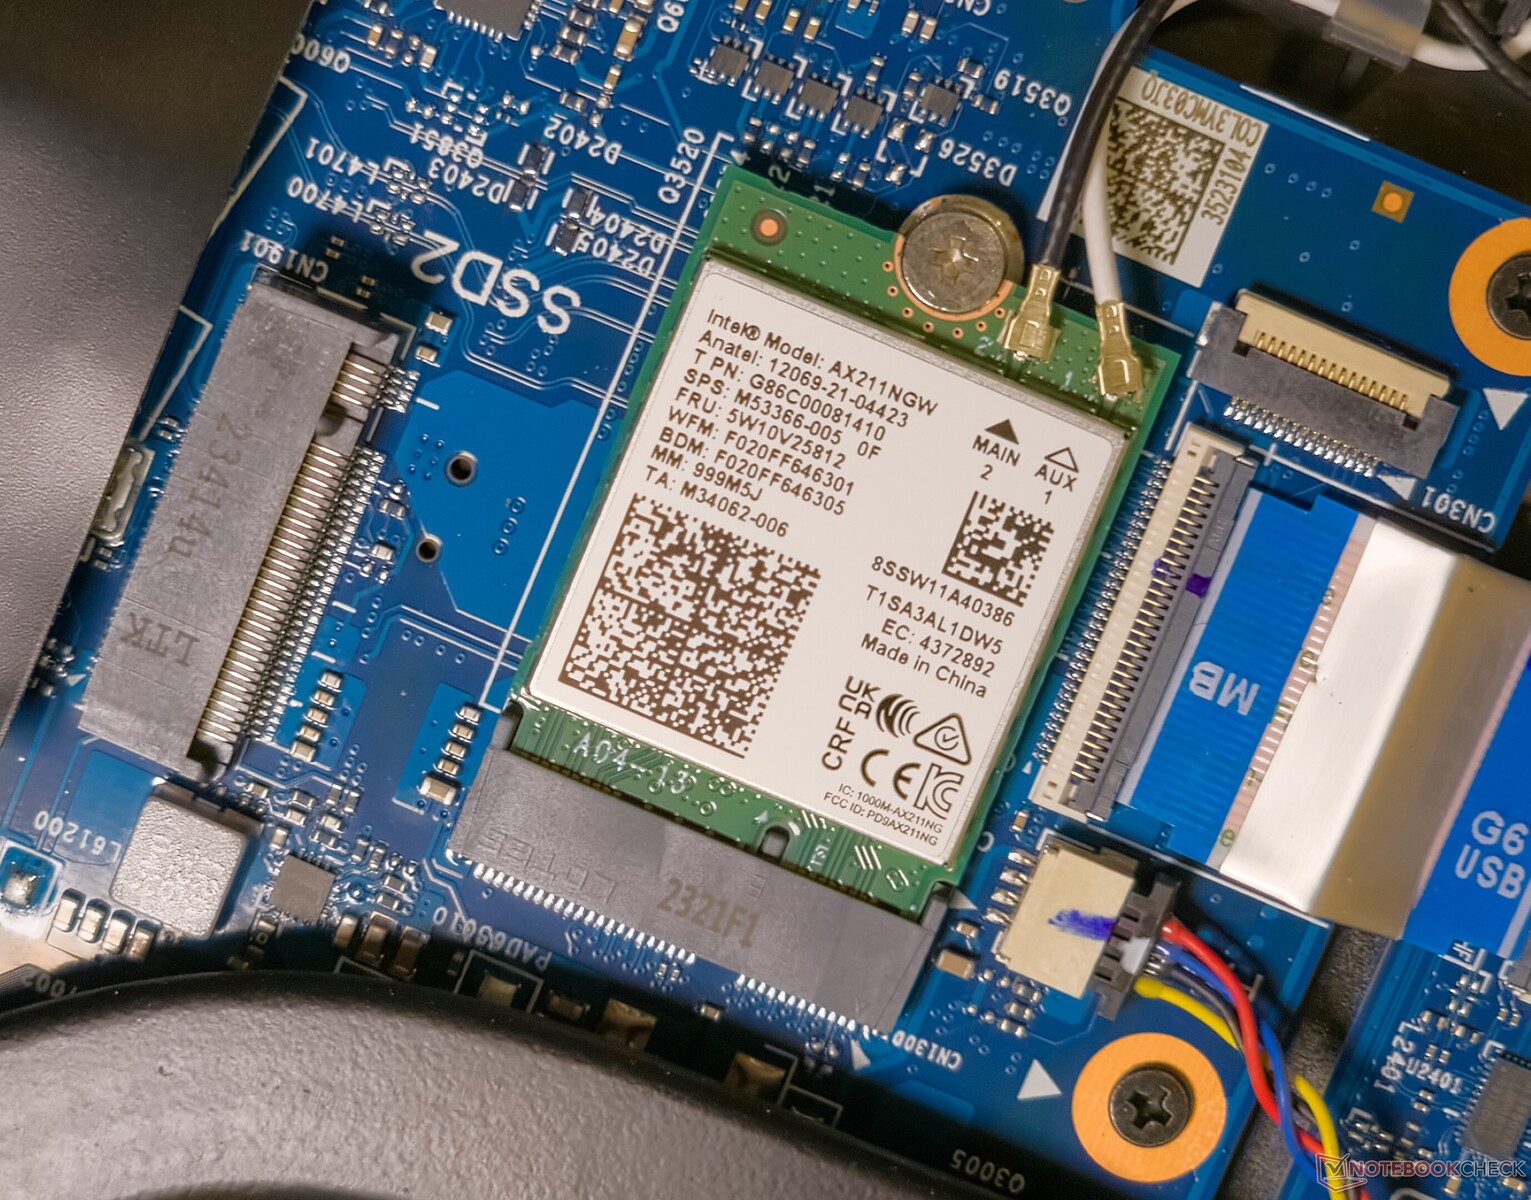
Laptops in 2024 are slowly latching on to the Wi-Fi 7 trend, although support for the standard is only slated to arrive when Windows 11 24H2 begins rolling out later this year. The Scar 16, therefore, makes do with the regular Intel Wi-Fi AX211 chip.
Testing the Scar 16 with our reference Asus ROG Rapture GT-AXE11000 router revealed a relatively lower throughput in the Wi-Fi 5 band compared to the competition. However, the performance is quite stable with no major speed drops.
Performance in Wi-Fi 6E was markedly better with transmit and receive speeds up to 1.5 Gbps and 1.74 Gbps, respectively, but we observed momentary throttling during the transmit test.
| Networking / iperf3 transmit AXE11000 | |
| Asus ROG Strix G16 G614JZ | |
| HP Omen 16 (2024) | |
| Lenovo Legion Pro 7 16IRX9H | |
| Average of class Gaming (469 - 1793, n=153, last 2 years) | |
| Average Intel Wi-Fi 6E AX211 (464 - 1861, n=189) | |
| Alienware m16 R2 | |
| MSI Vector 16 HX A14V | |
| Asus ROG Strix Scar 16 G634JZR | |
| Networking / iperf3 receive AXE11000 | |
| HP Omen 16 (2024) | |
| Lenovo Legion Pro 7 16IRX9H | |
| Asus ROG Strix G16 G614JZ | |
| Average of class Gaming (685 - 1890, n=159, last 2 years) | |
| Average Intel Wi-Fi 6E AX211 (582 - 1890, n=189) | |
| MSI Vector 16 HX A14V | |
| Alienware m16 R2 | |
| Asus ROG Strix Scar 16 G634JZR | |
| Networking / iperf3 transmit AXE11000 6GHz | |
| Asus ROG Strix Scar 16 G634JZR | |
| Average of class Gaming (648 - 1878, n=78, last 2 years) | |
| MSI Vector 16 HX A14V | |
| Alienware m16 R2 | |
| Average Intel Wi-Fi 6E AX211 (632 - 1851, n=174) | |
| Networking / iperf3 receive AXE11000 6GHz | |
| Asus ROG Strix Scar 16 G634JZR | |
| Average of class Gaming (853 - 1857, n=80, last 2 years) | |
| Average Intel Wi-Fi 6E AX211 (883 - 1857, n=173) | |
| Alienware m16 R2 | |
| MSI Vector 16 HX A14V | |
Webcam
Unlike the Scar 15 that included an external ROG Eye 1080p webcam as an inbox accessory, the Scar 16 makes do with a conventional integrated 720p sensor.
The image quality isn't exceptional by any measure but gets you by the occasional video call or two. We observe large color deviations in blue shades, and the overall sharpness doesn't seem adequate.


Security
The Scar 16 lacks any form of biometric authentication. A TPM 2.0 module is present to meet Windows 11's requirements.
Accessories and Warranty
A customizable Armor Cap is included in the box. There are no other accessories apart from this.
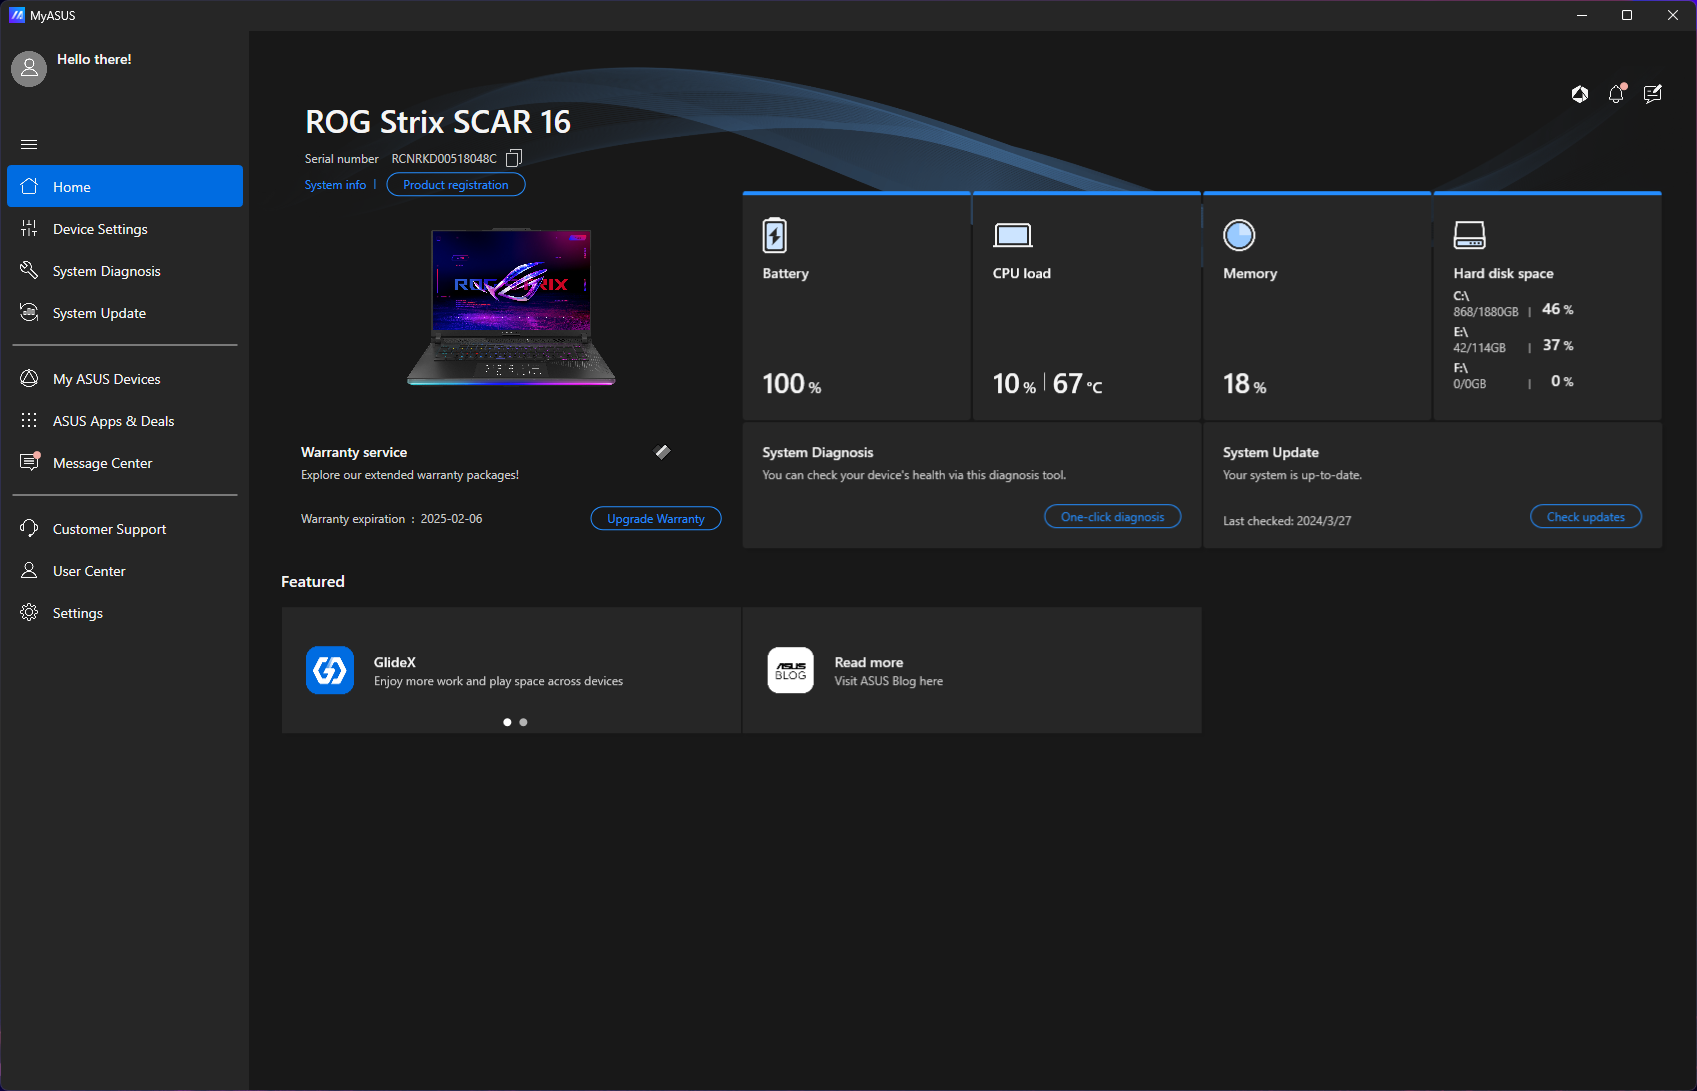
Asus offers a standard one-year warranty for the Scar 16 in India. Warranty extensions can be purchased via the pre-installed MyAsus app within 180 days of purchase.
Buyers can also choose from several warranty options ranging from ₹999 (U$12) for a one-year extension to ₹4,999 (US$60) that includes a two-year extension and three years of accidental damage protection.
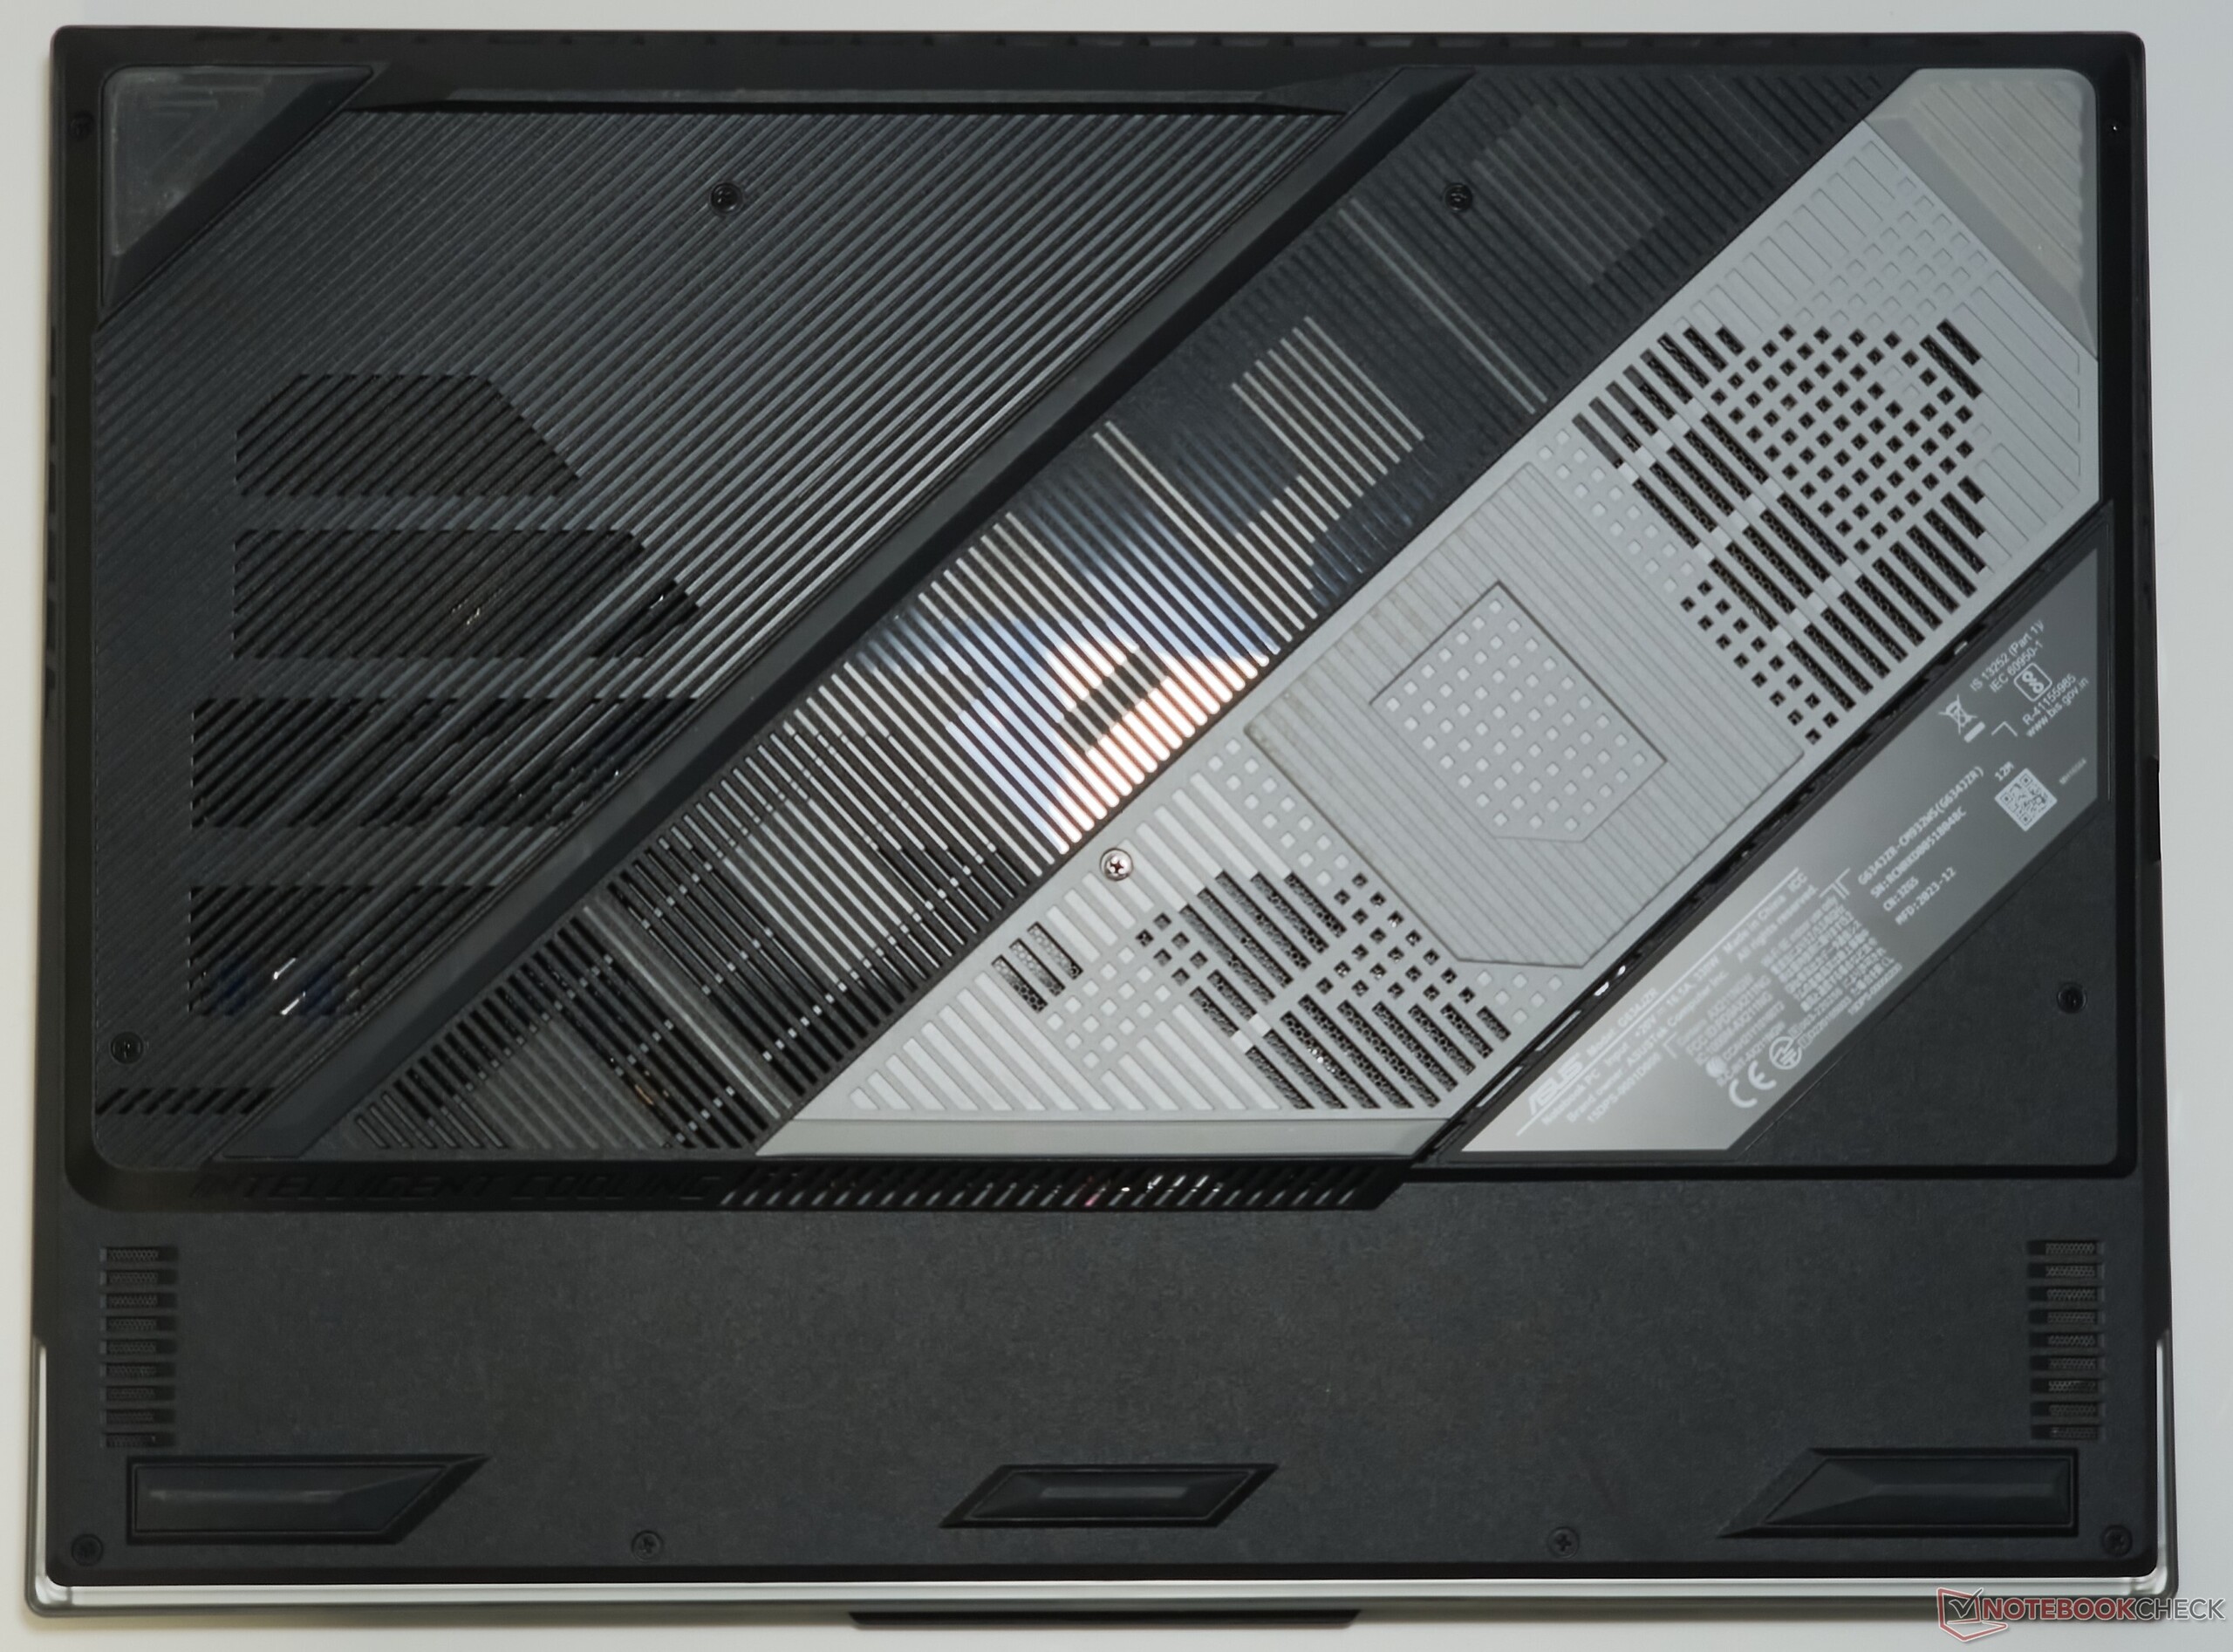
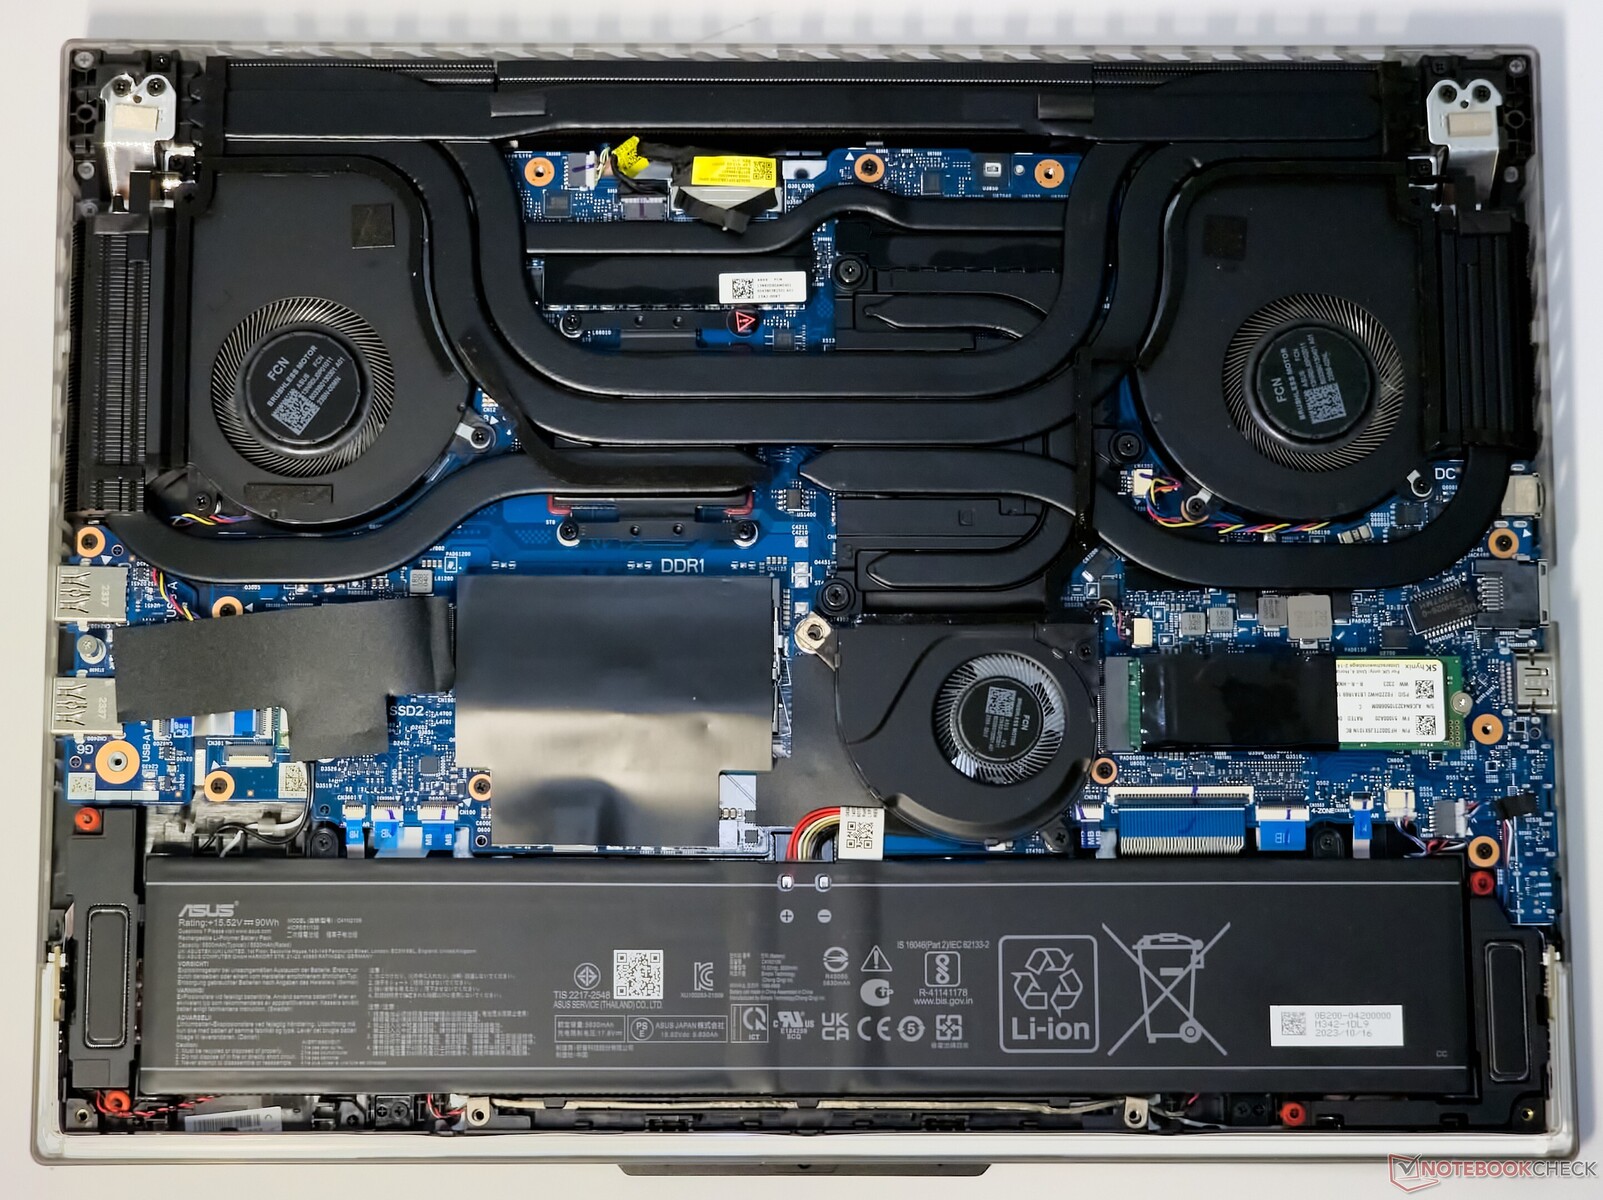
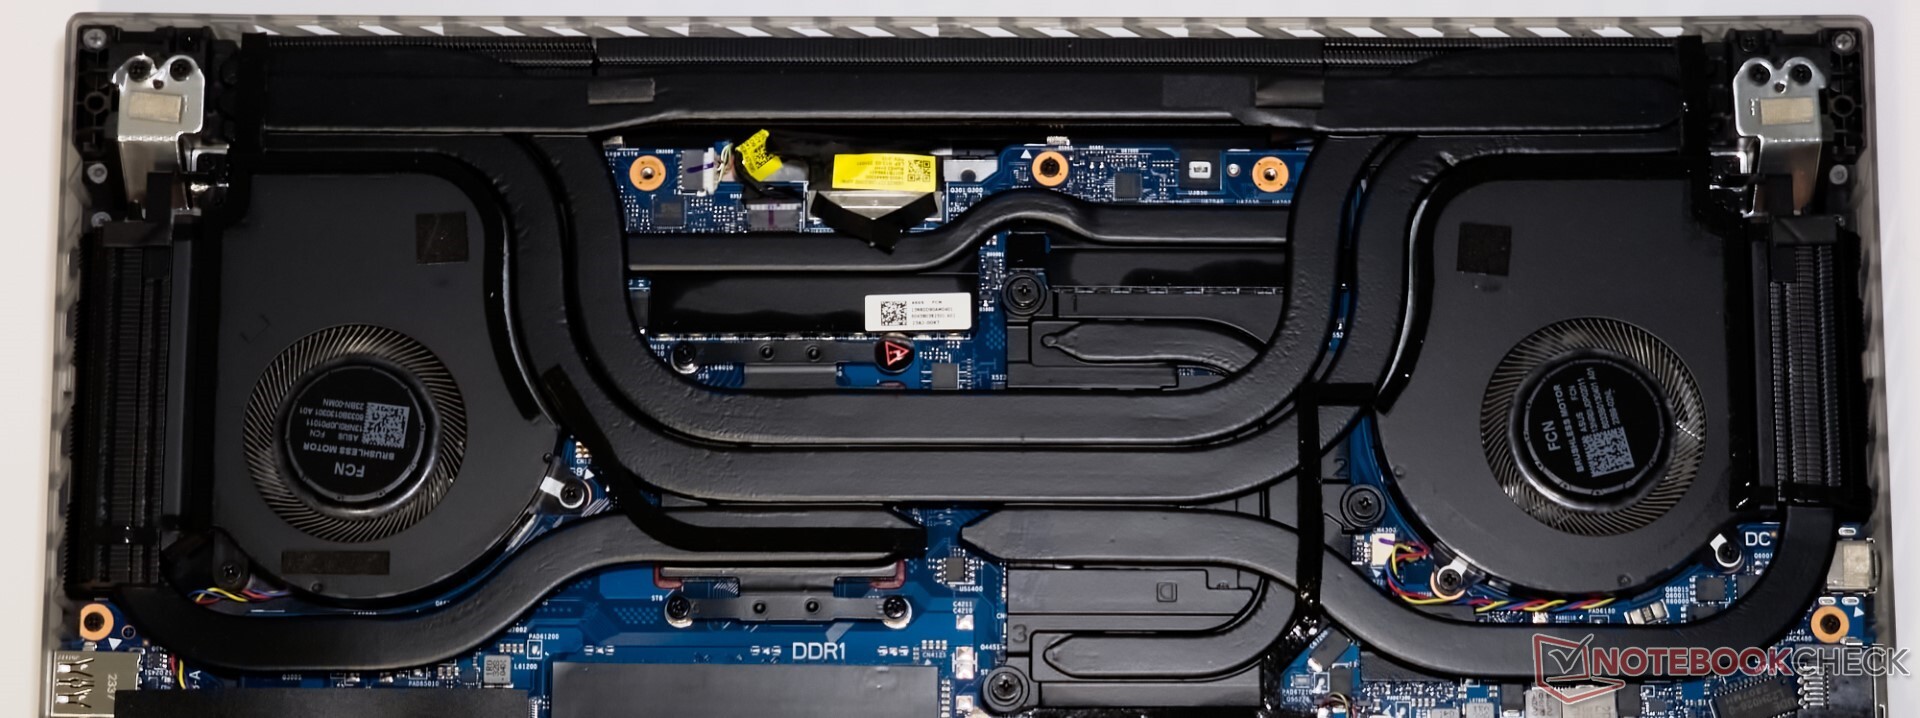
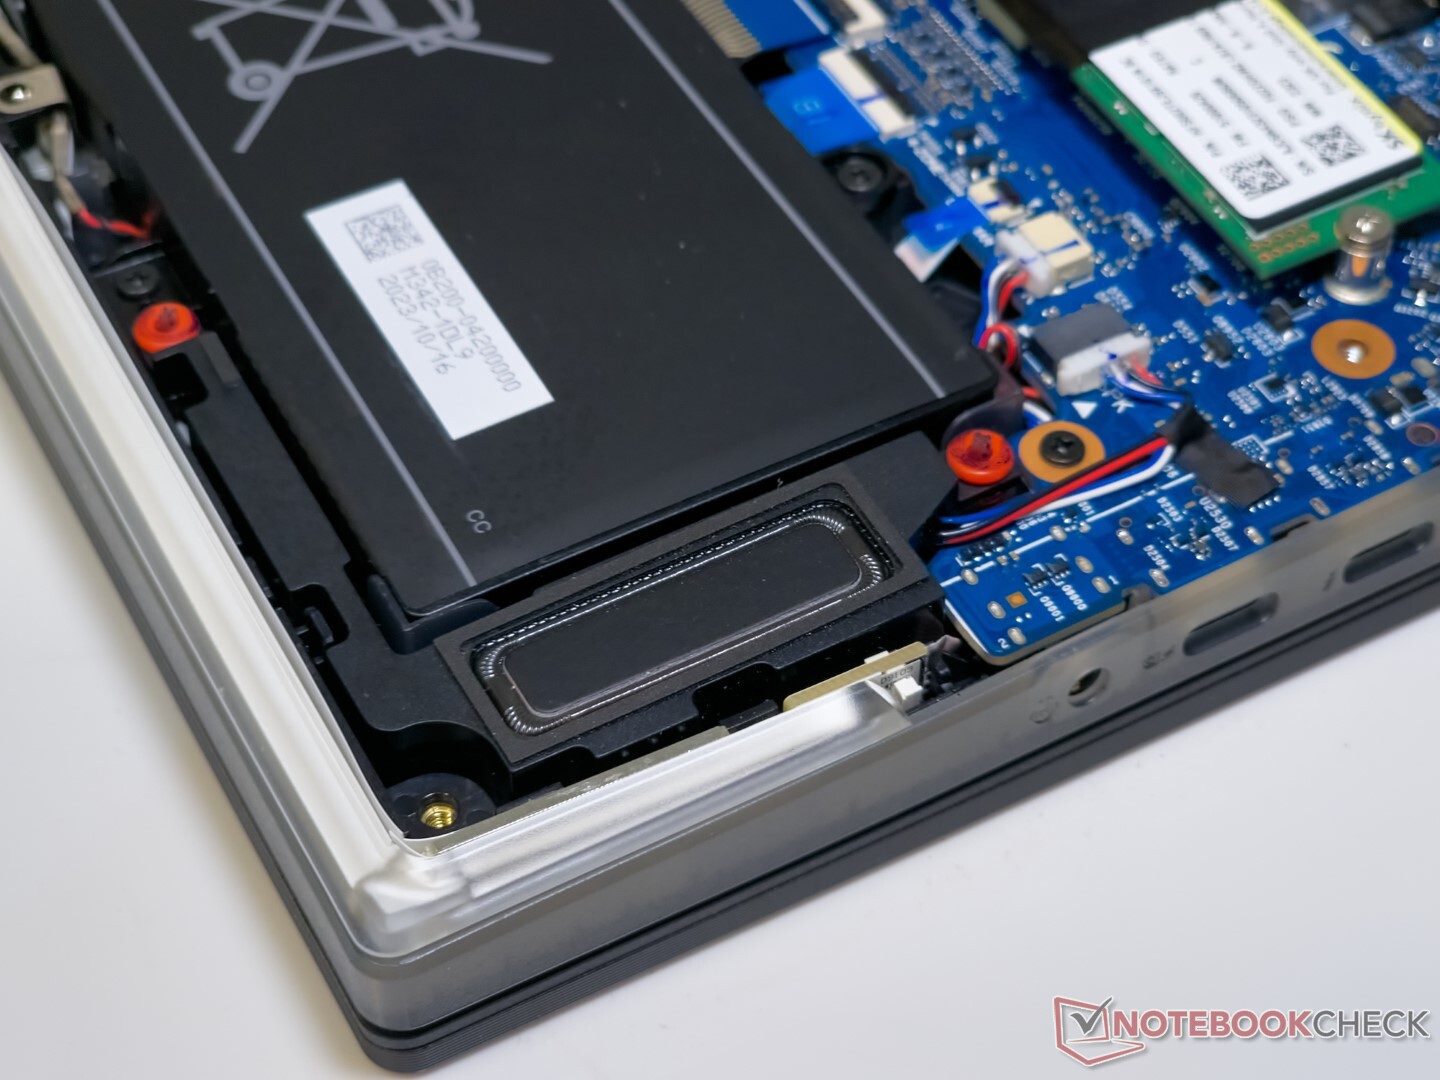
Maintenance
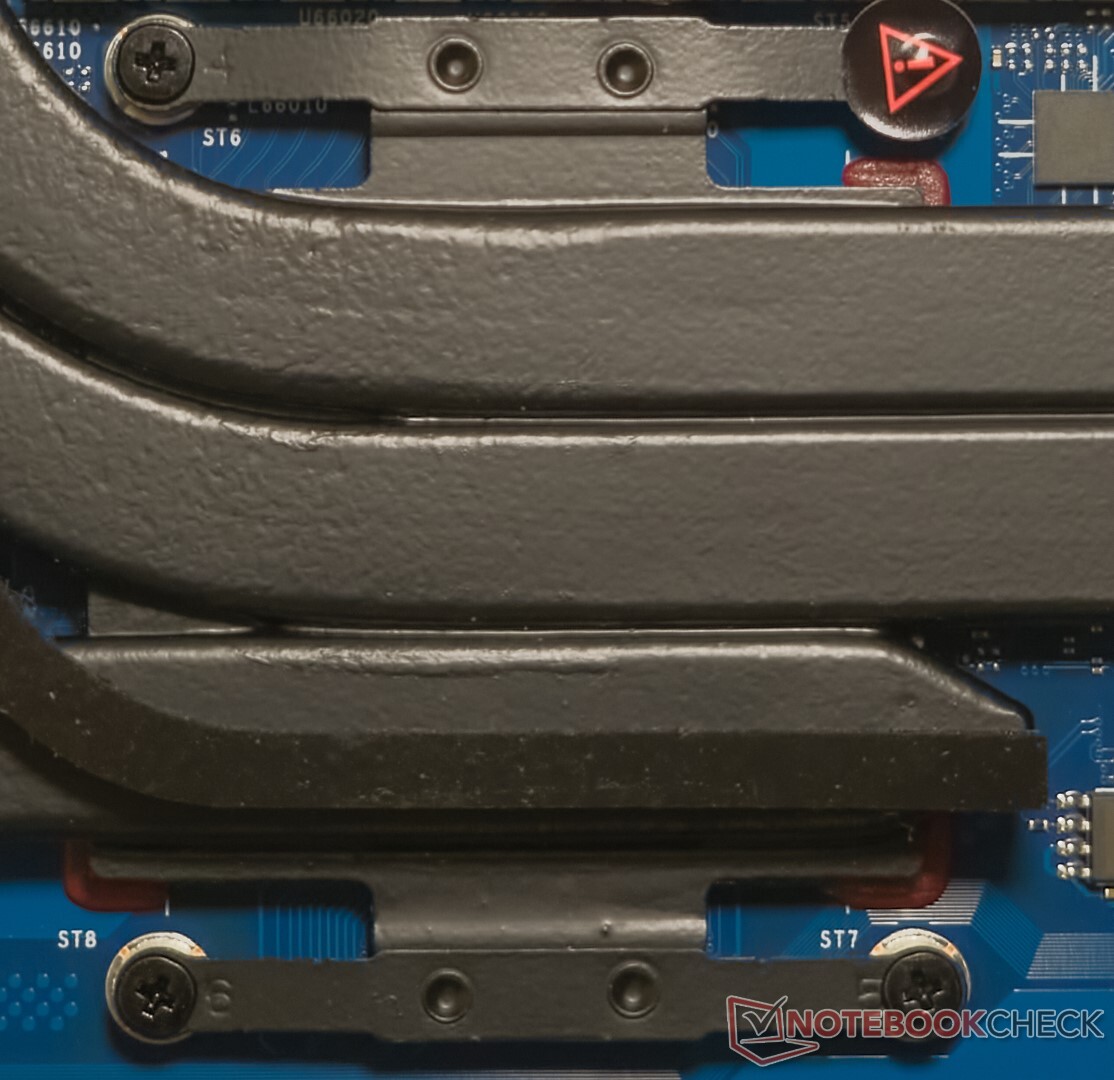
Removing the 11 PH0 screws and prying open the back panel exposes the Scar 16's busy internal layout. An optical sensor on the motherboard acts as a safety feature, preventing the laptop from powering up or shutting it down if it's already on when the bottom panel is removed. To boot again, the bottom panel needs to be put back and the laptop should be connected to the power adapter.
The RGB LED strip is no longer part of the back panel, so goodbye to worries of fragile ribbon cables snapping while prying open the cover.
The RAM, SSD, and WLAN card can be swapped out for upgrades if necessary. The battery can be unscrewed and replaced as well.
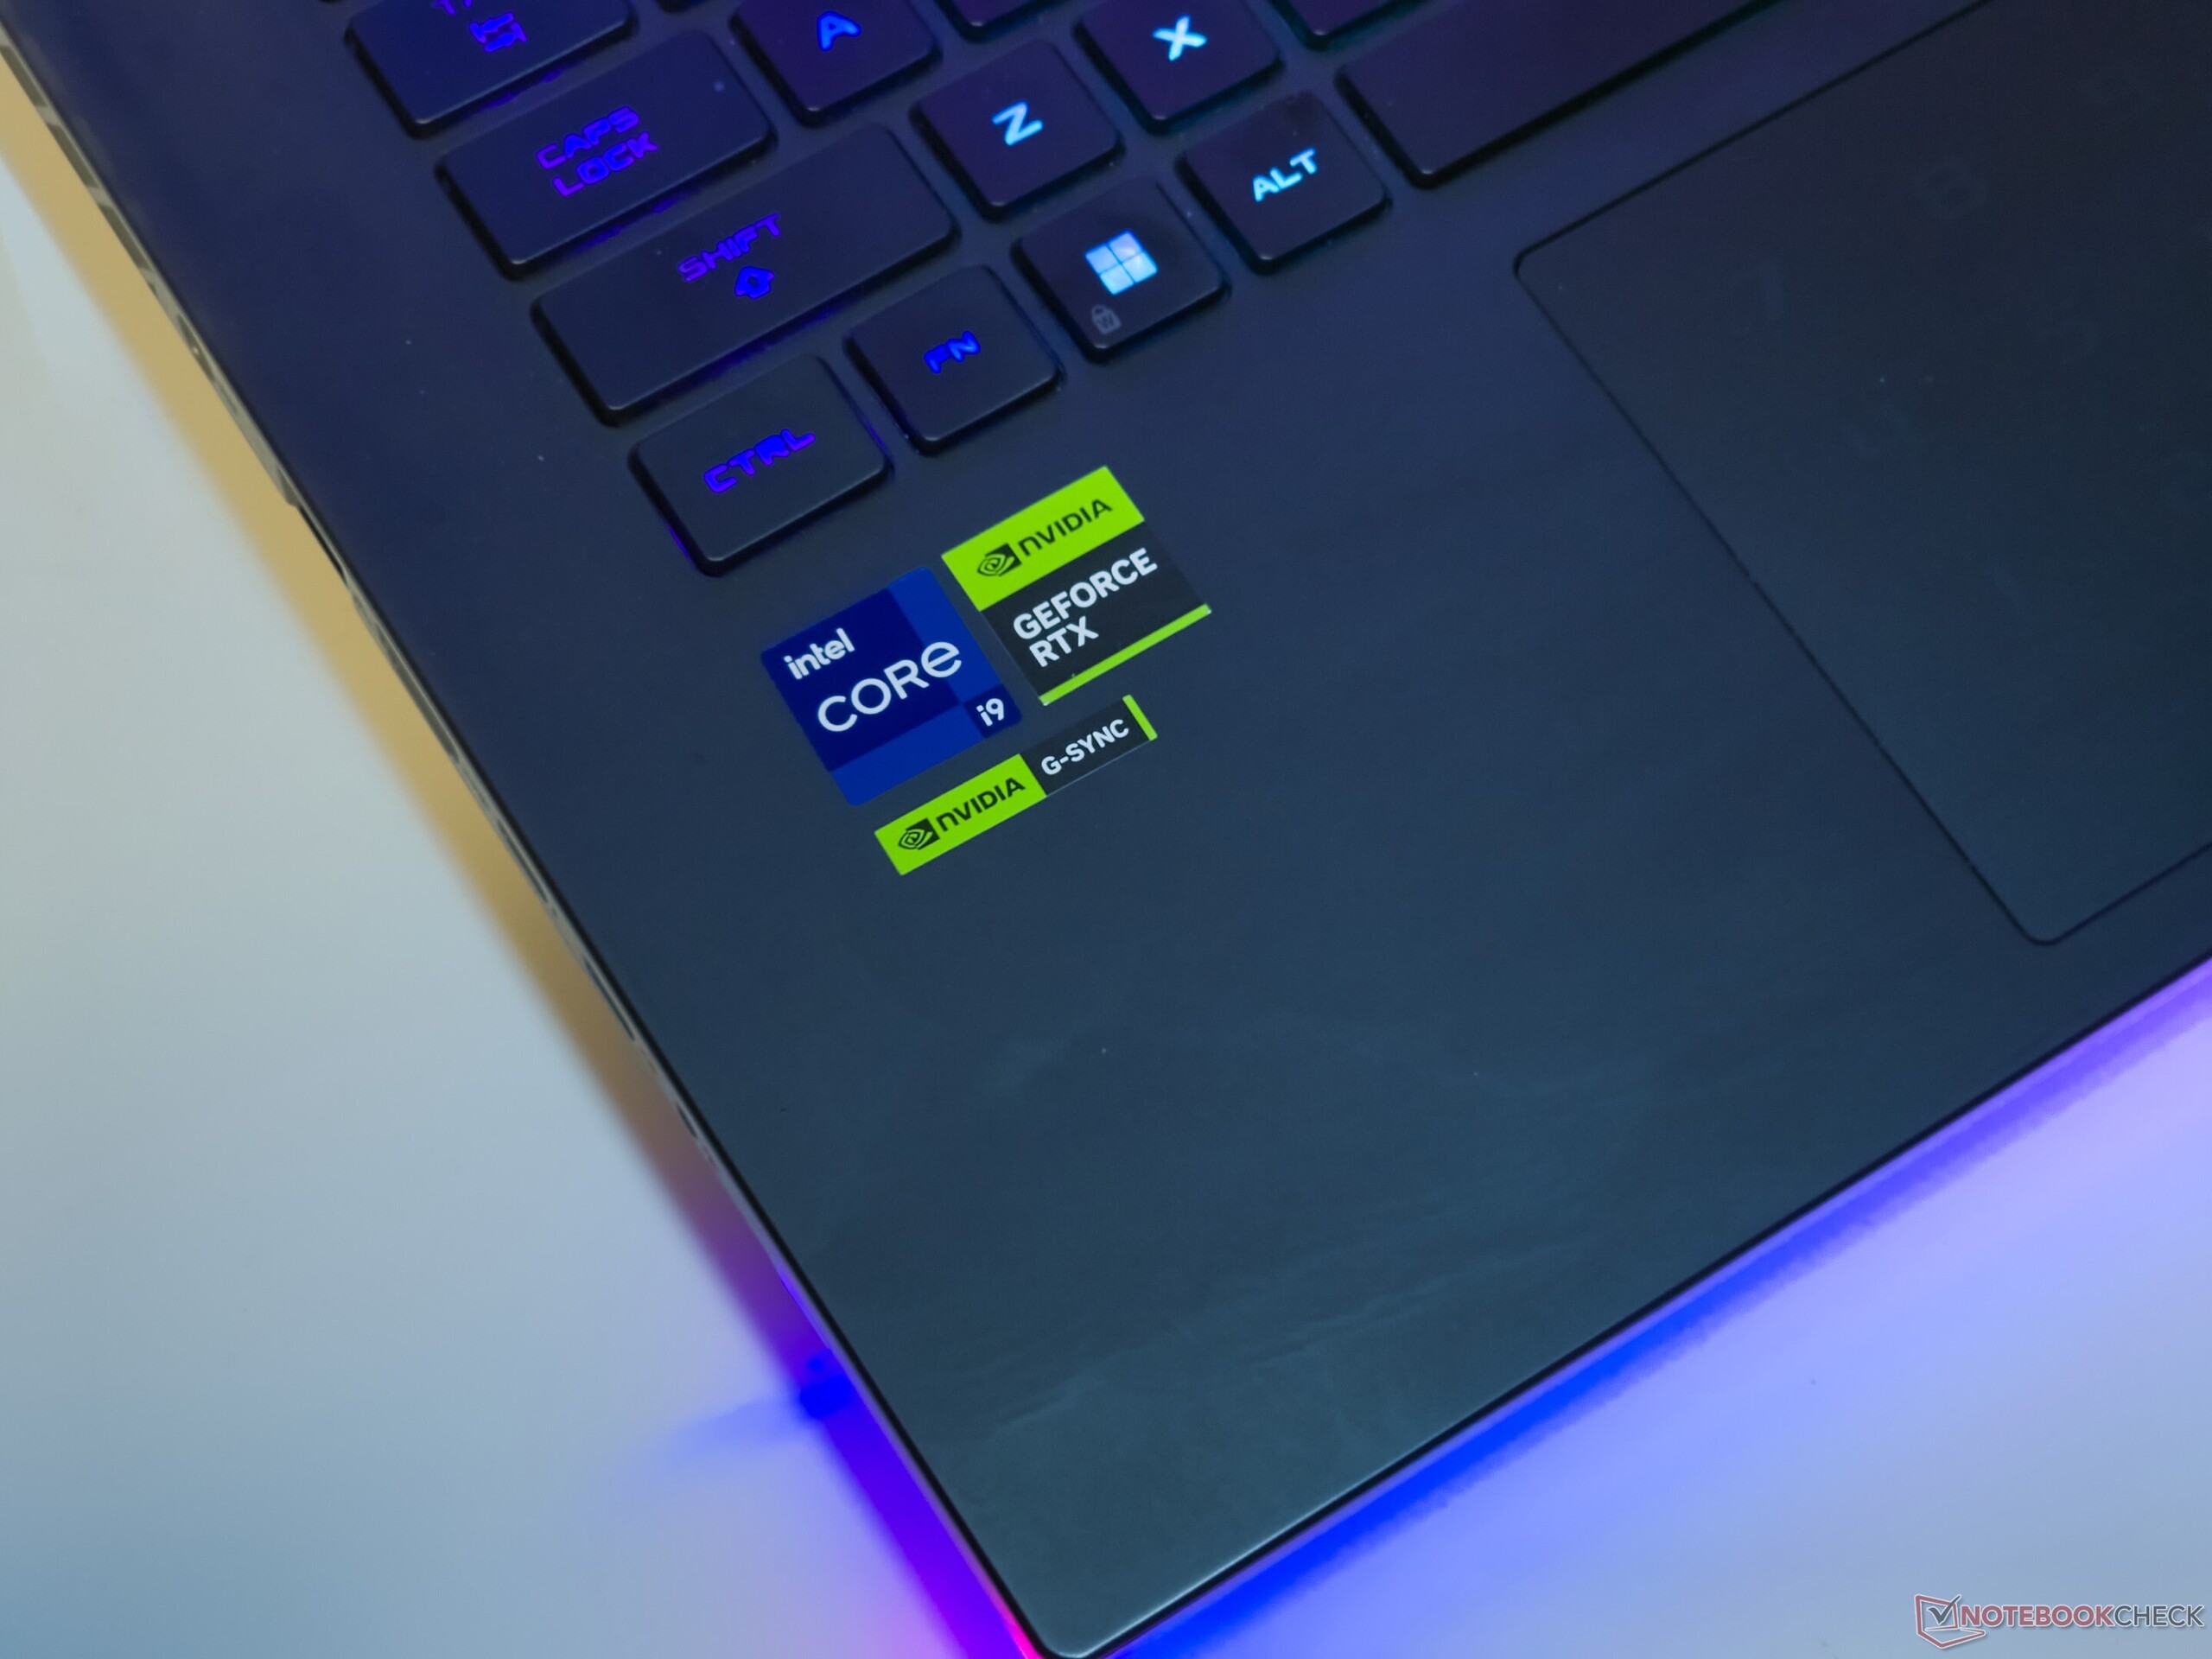
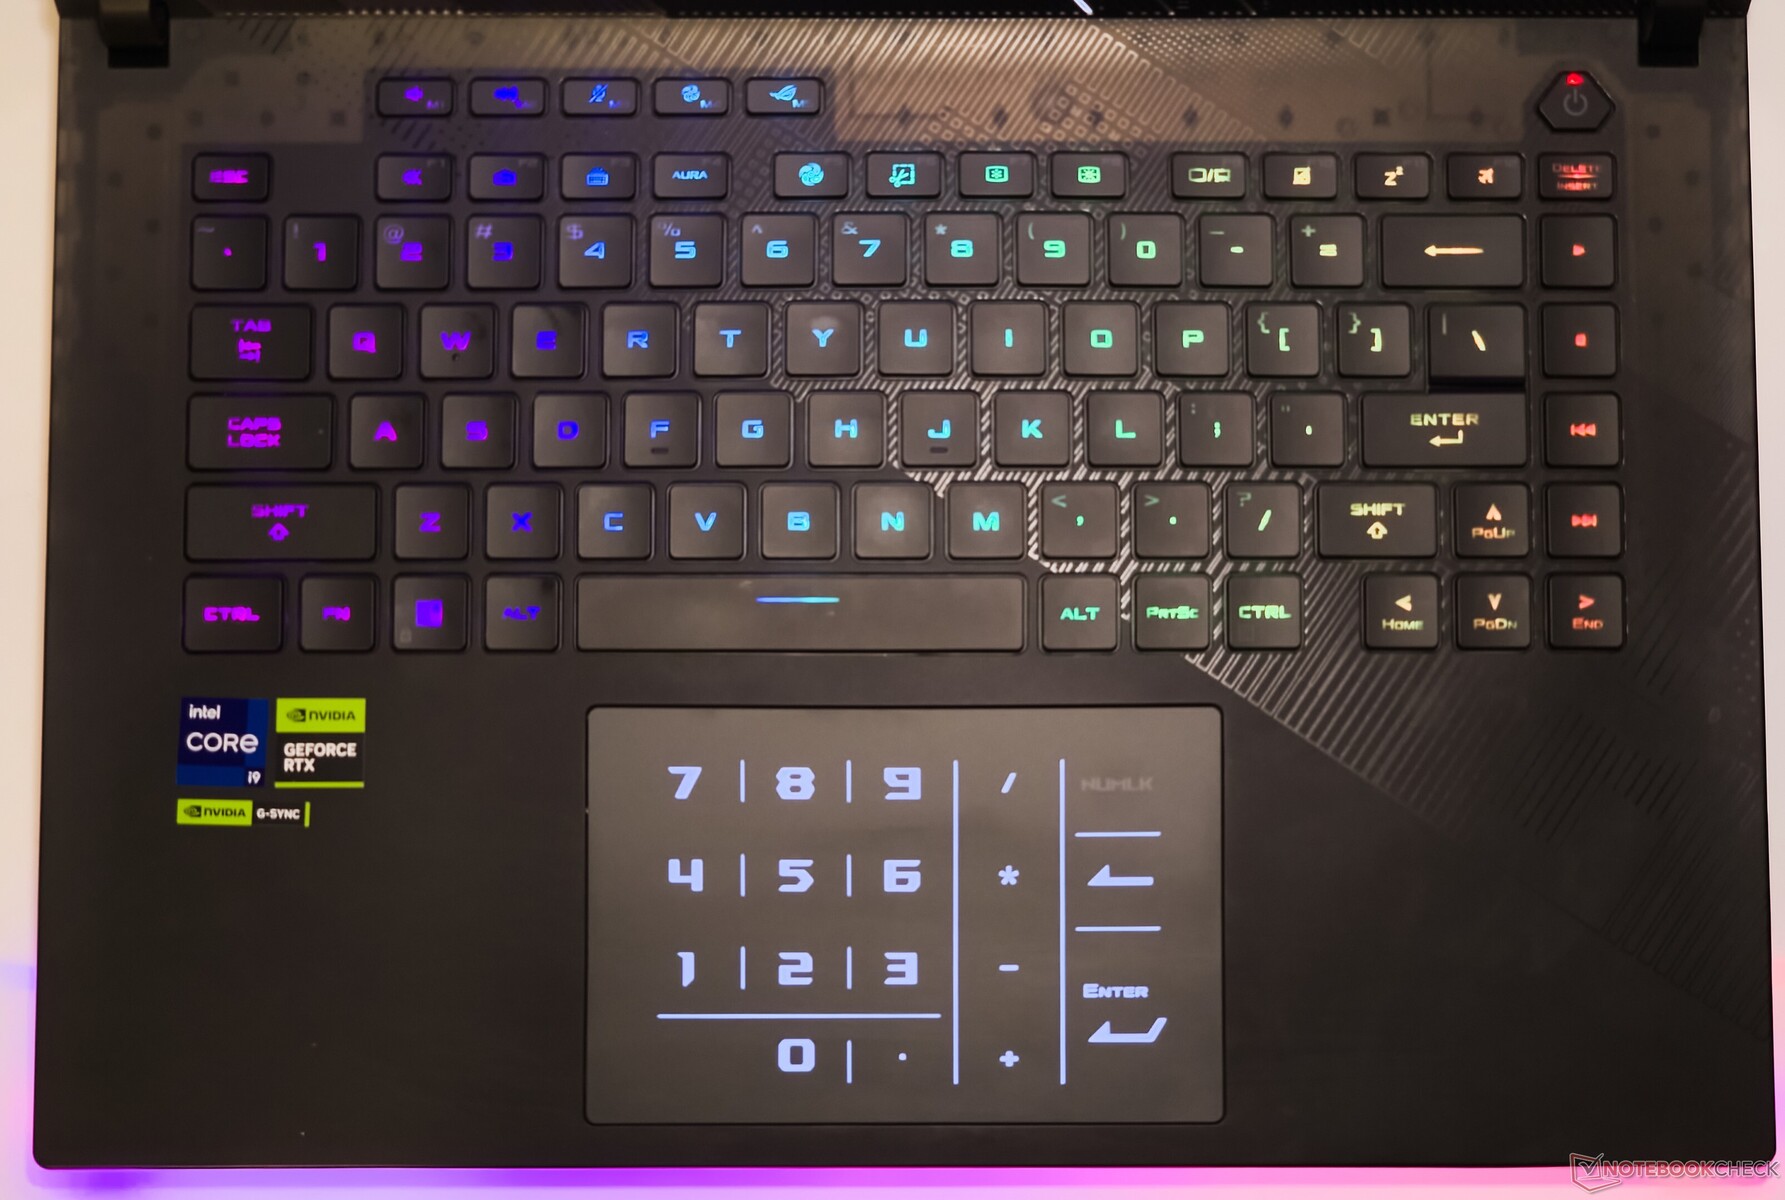
Input Devices: Handy virtual numpad but F1-F12 remains unlit
Keyboard
The Scar 16's keyboard offers a good typing experience overall, but the feedback could have been crisper. Those coming from a non-Asus ROG notebook may take some time to adjust to the short right Shift key and vertical arrangement of media keys towards the right.
As is standard for ROG laptops, the top row allows programming macro functions via Armory Crate. It is commendable that Asus provides full-size arrow keys. There are dedicated keys to switch between RGB lighting presets and performance profiles.
Per-key RGB can be customized via Armory Crate. However, the F1-F12 letters continue to remain in the dark.
Touchpad
The 8.5 cm x 13 cm touchpad offers a smooth gliding experience with support for Windows Precision gestures. The touchpad offers good tactility and clicks are responsive at the corners.
A soft Num lock toggle on the top right of the touchpad throws up a virtual numpad for those number crunching needs. It can get accidentally triggered while swiping but doesn't generally come in the way of normal use.
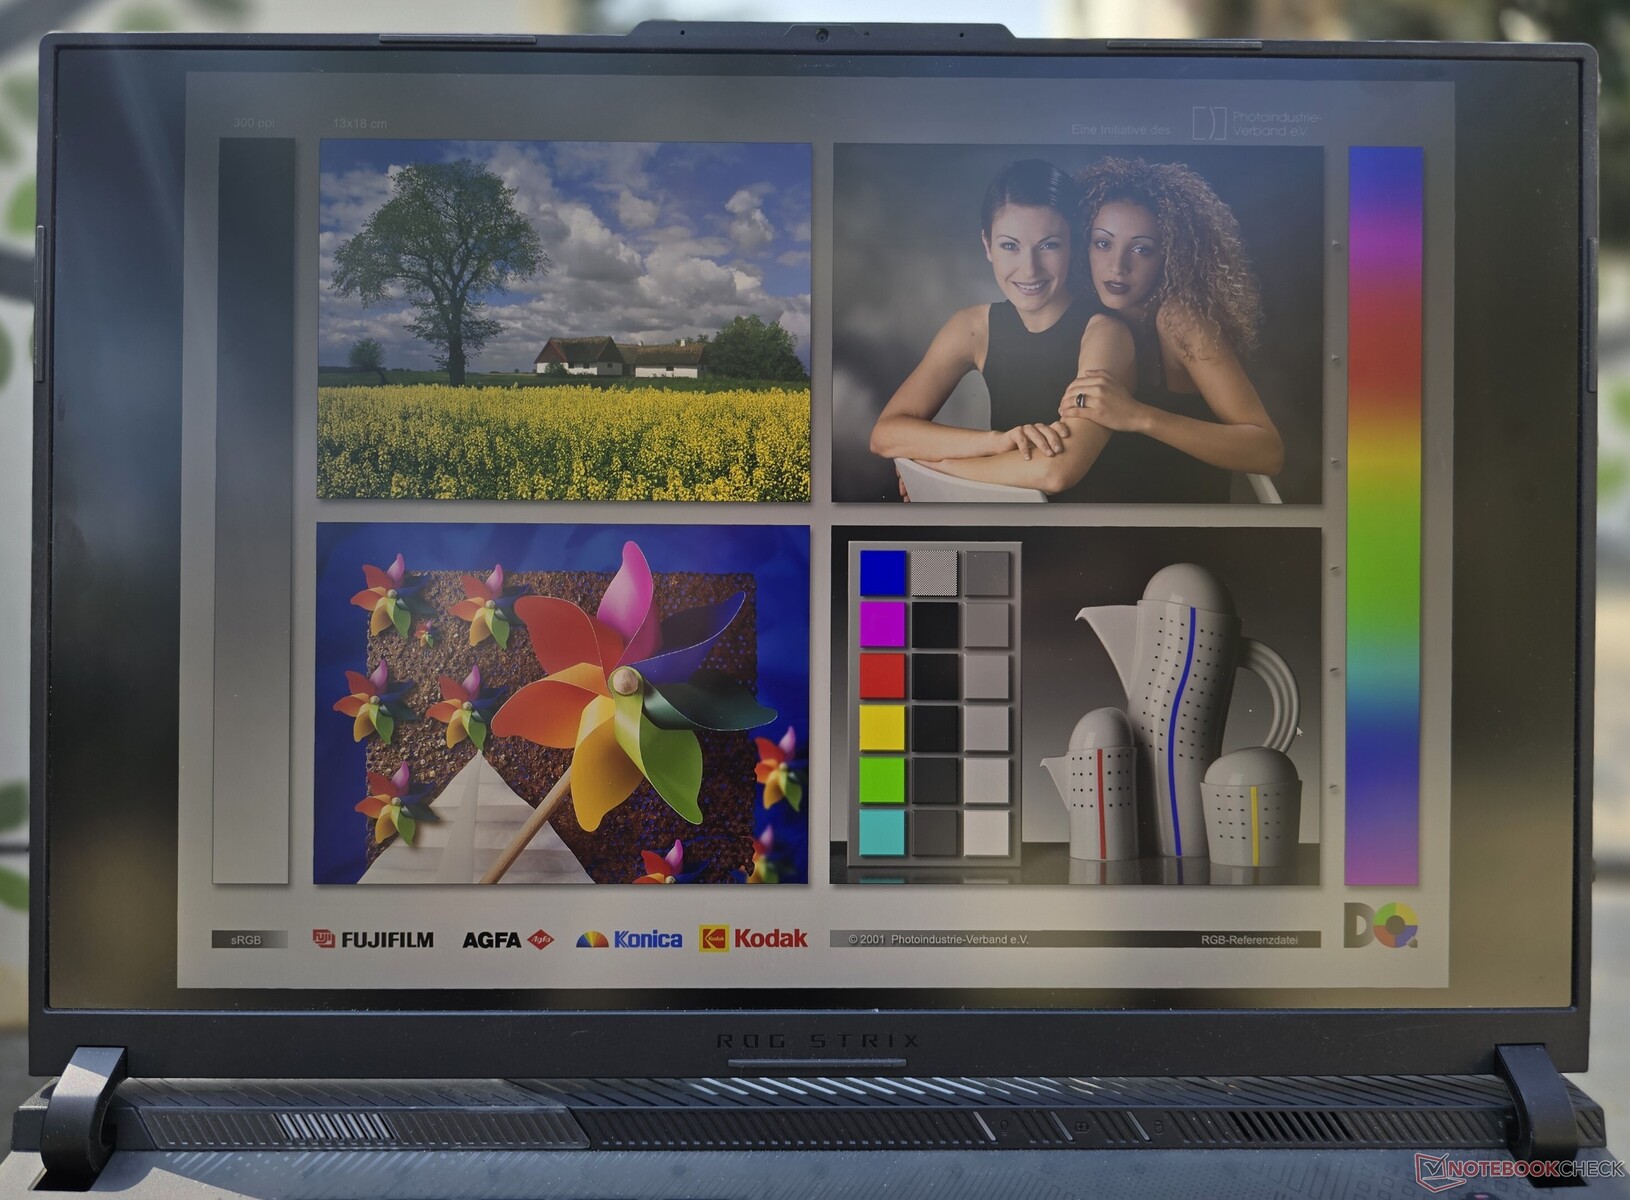
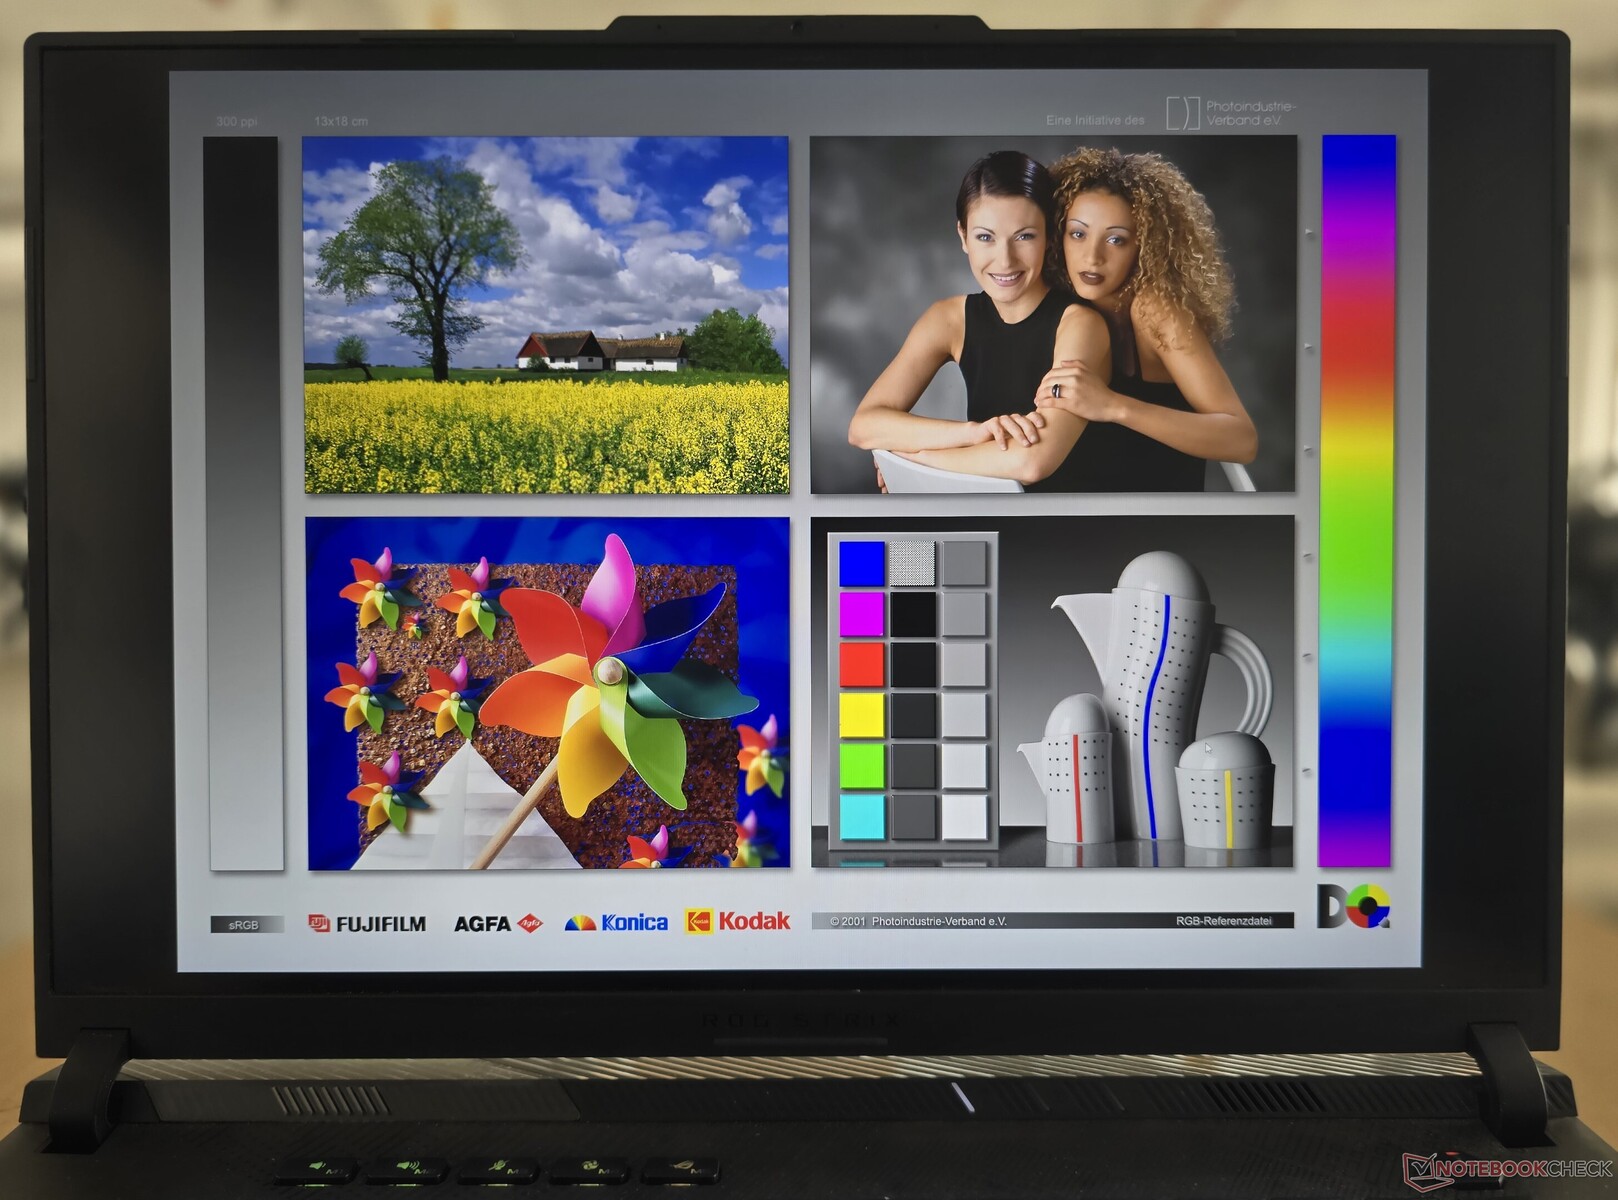
Display: 240 Hz QHD+ G-Sync HDR panel with high PWM
The ROG Strix Scar 16 comes equipped with a 2560 x 1600 16:10 mini LED "Nebula HDR" panel that Asus specifies to have 2,048 dimming zones. The 240 Hz display supports HDR10, Dolby Vision, Nvidia G-Sync, and is also Pantone-validated.
Armory Crate allows toggling between single-zone and multi-zone backlighting. The former is the default operating mode and allows for a more even illumination for color-accurate workflows.
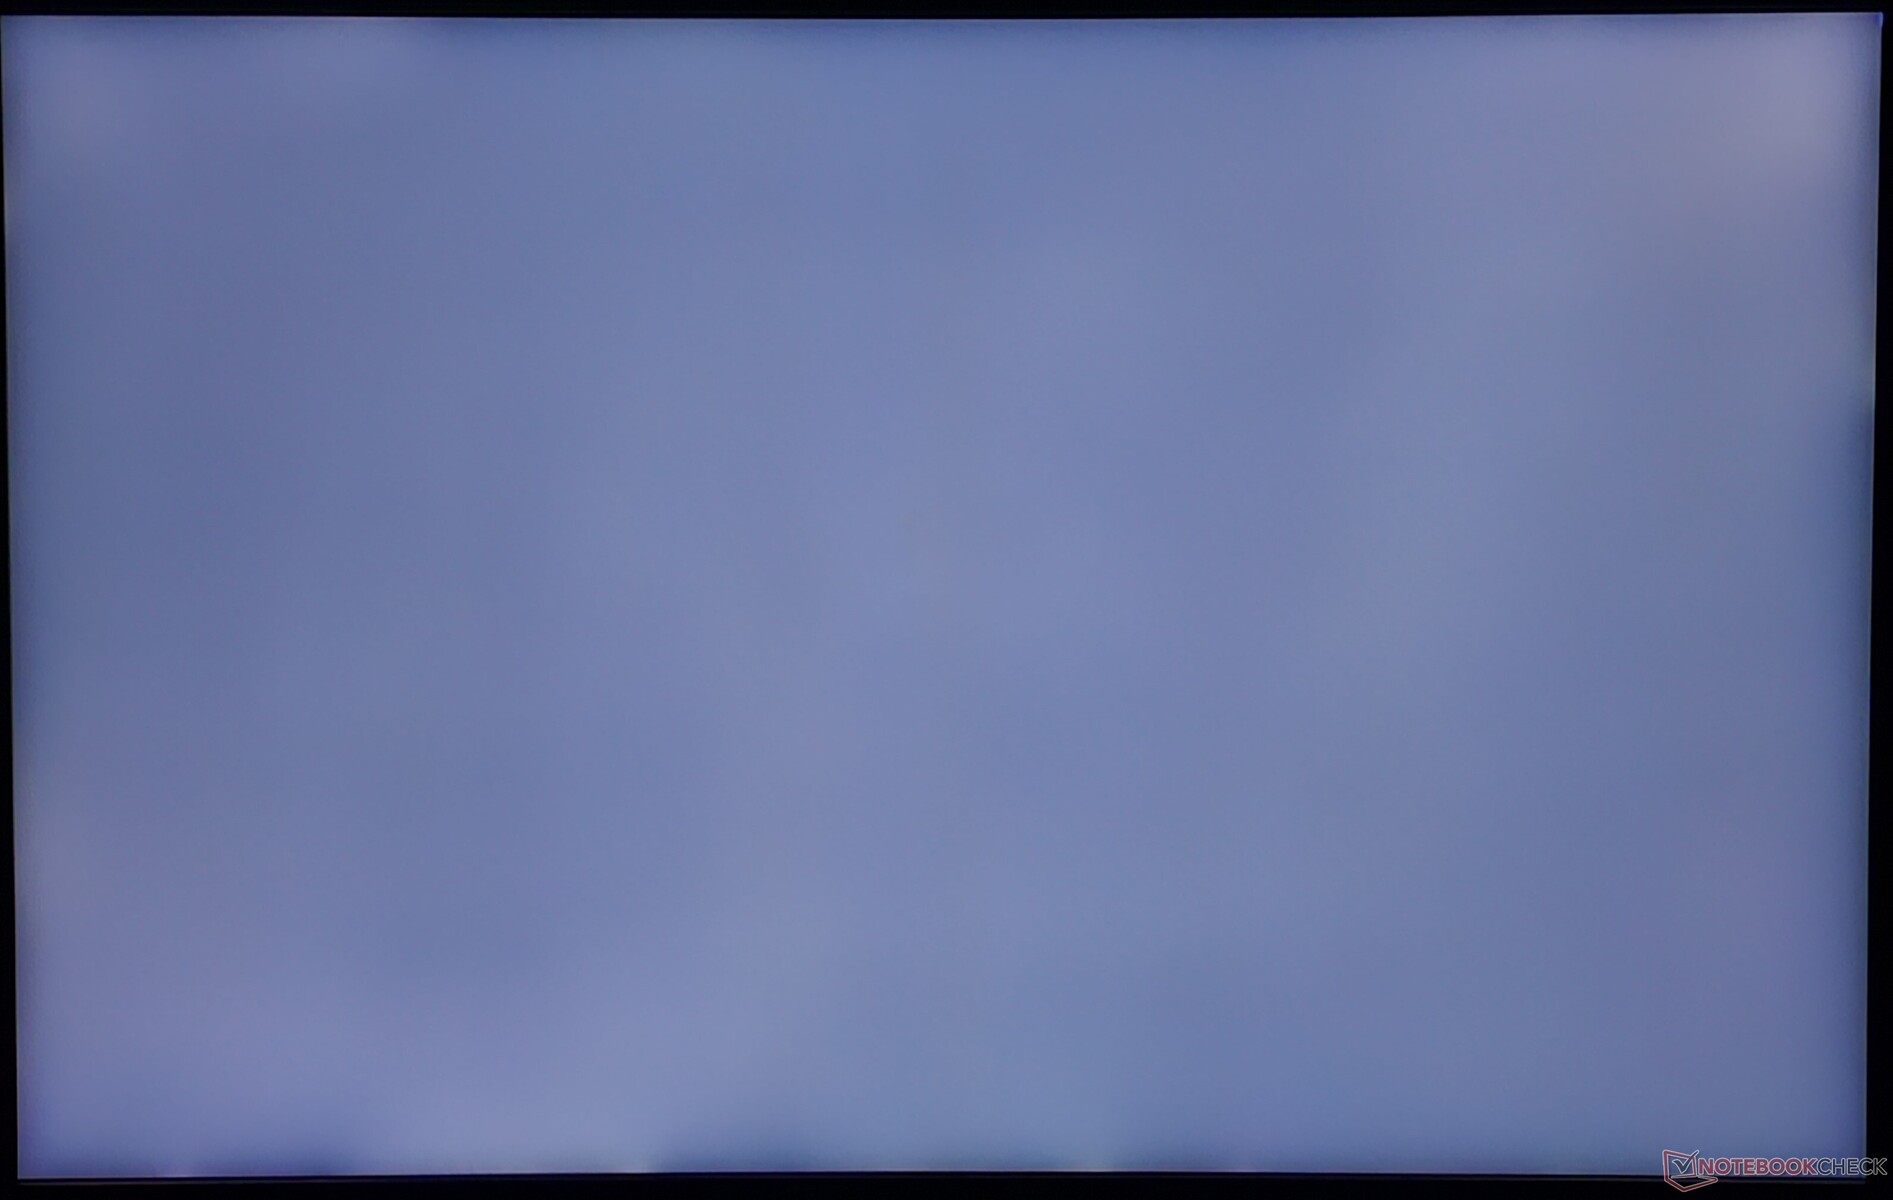
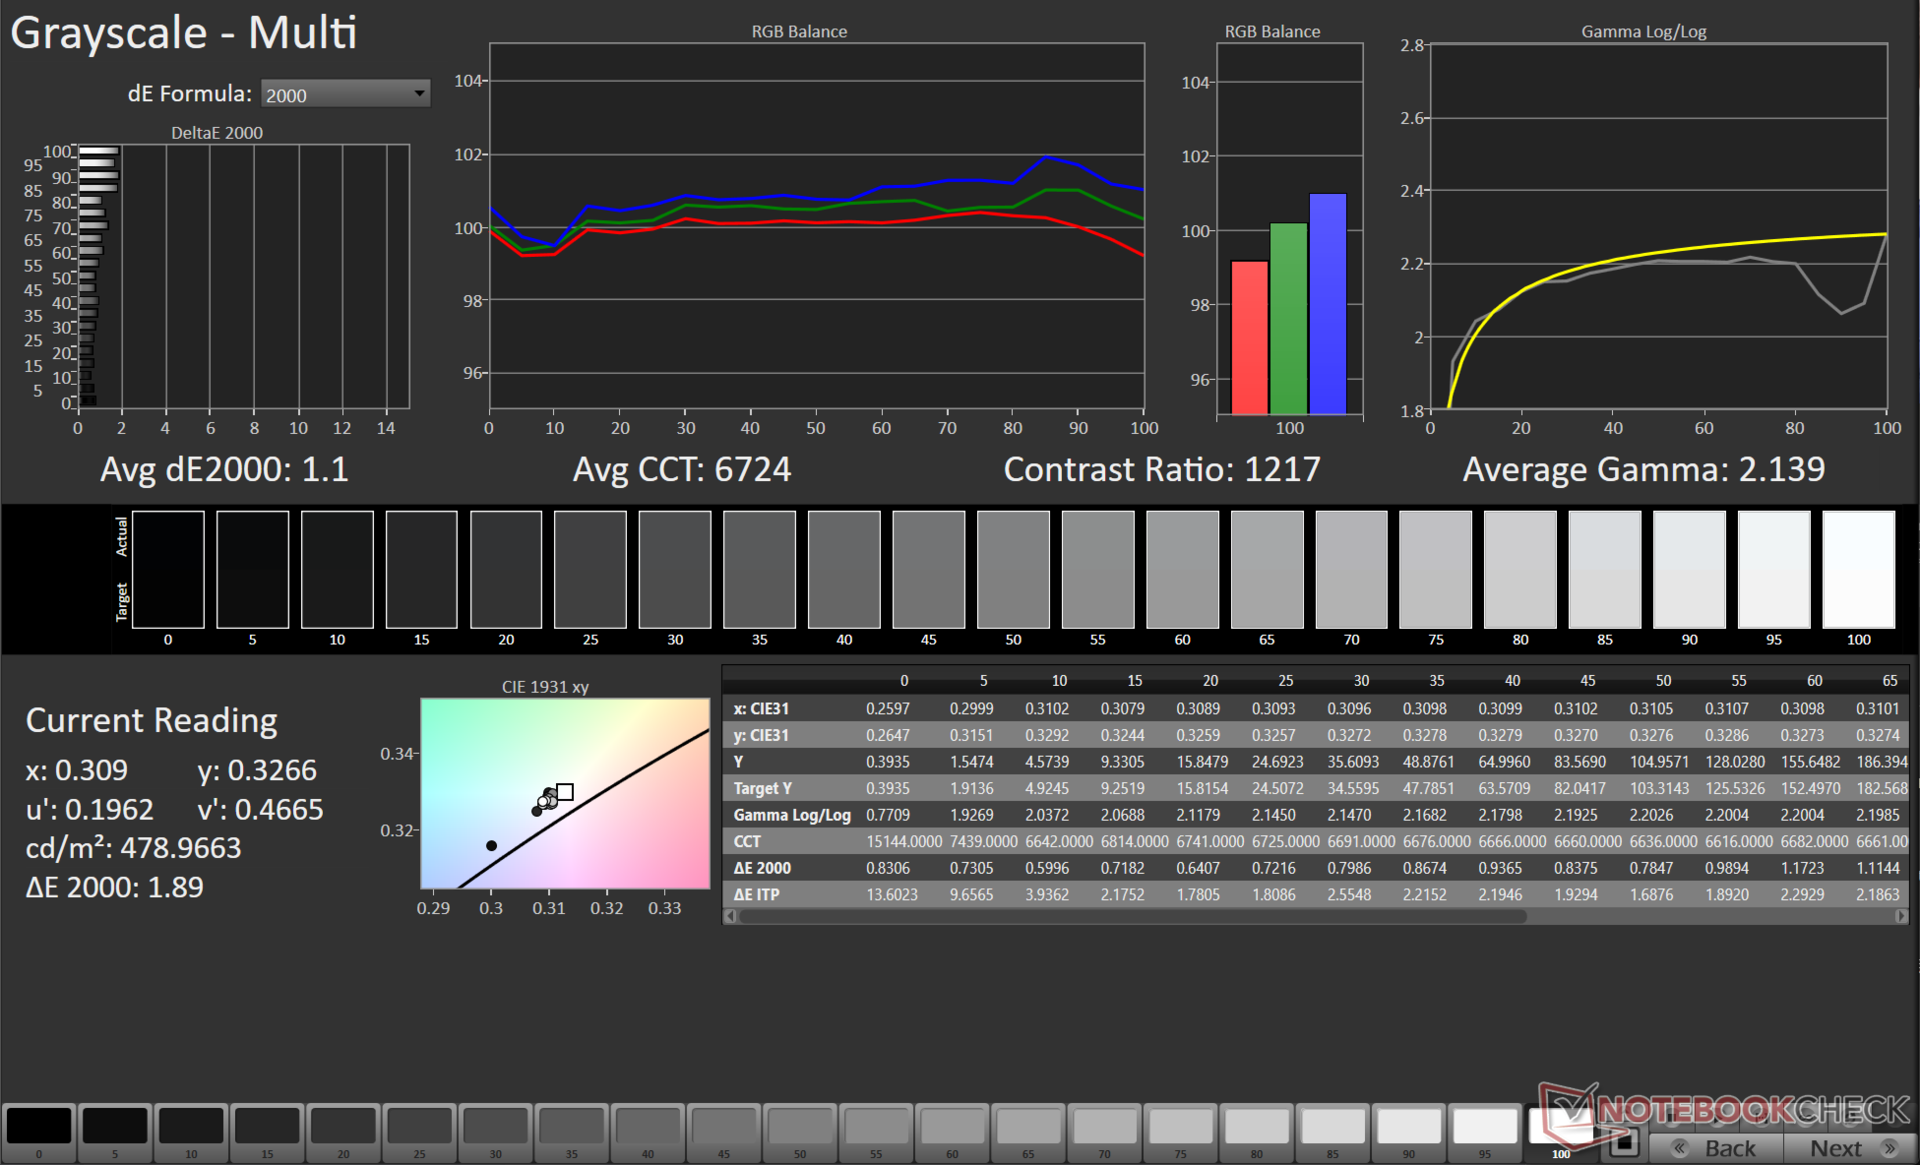
In this mode, the Scar 16's display showed a good 94% brightness distribution in our SDR measurements, with a peak brightness of 503 nits. We measured a 1,225:1 contrast ratio, which is good, but you will want to toggle the multi-zone switch if you need even deeper blacks.
Refer to our ROG Scar 18 (2024) review that sports a similar Nebula HDR mini LED panel for the kind of values that can be expected with multi-zone backlighting.
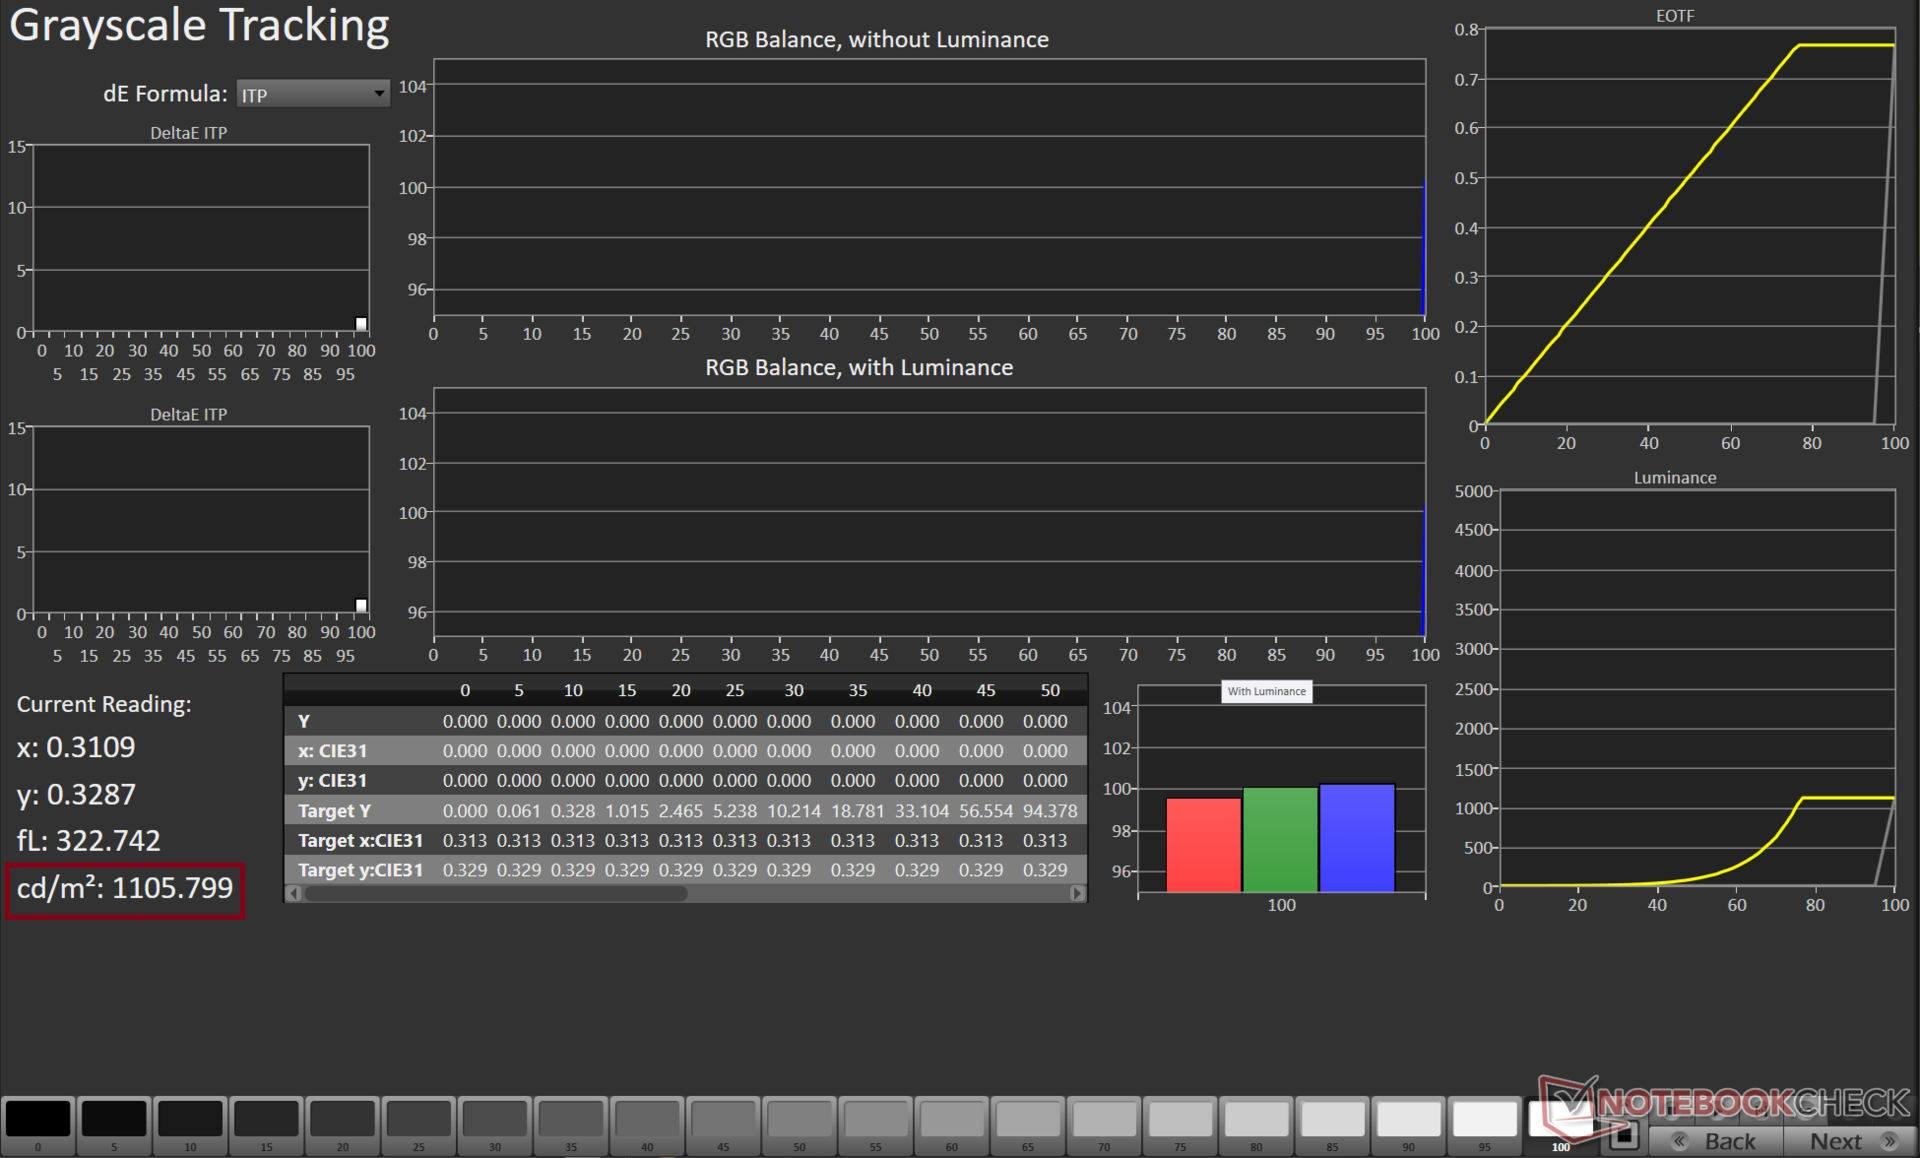
Asus advertises 1,100 nits of HDR peak brightness, and we found this claim held true when measured at a 49% window size.
Backlight bleeding is only minimally seen along the bottom frame of the display.

| |||||||||||||||||||||||||
Brightness Distribution: 94 %
Center on Battery: 291 cd/m²
Contrast: 1225:1 (Black: 0.4 cd/m²)
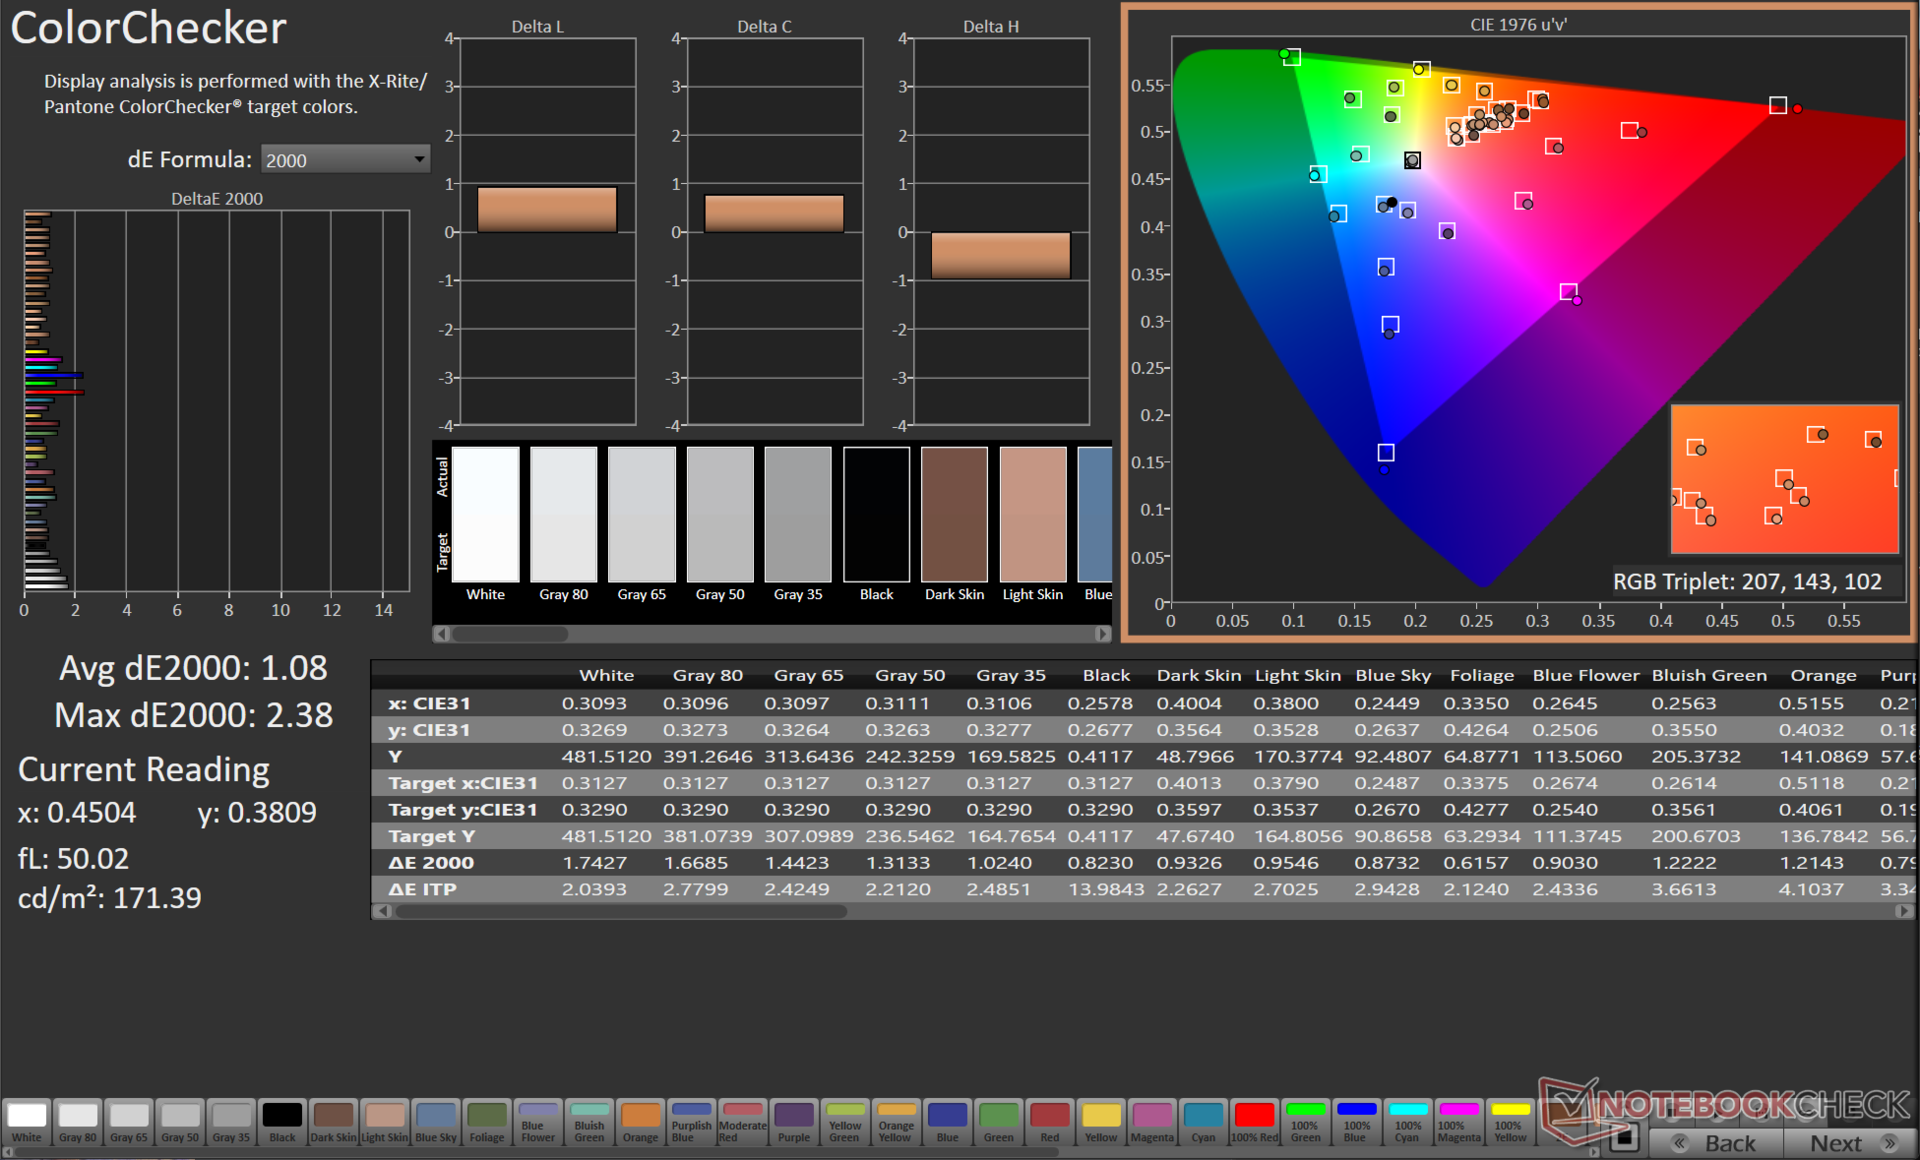
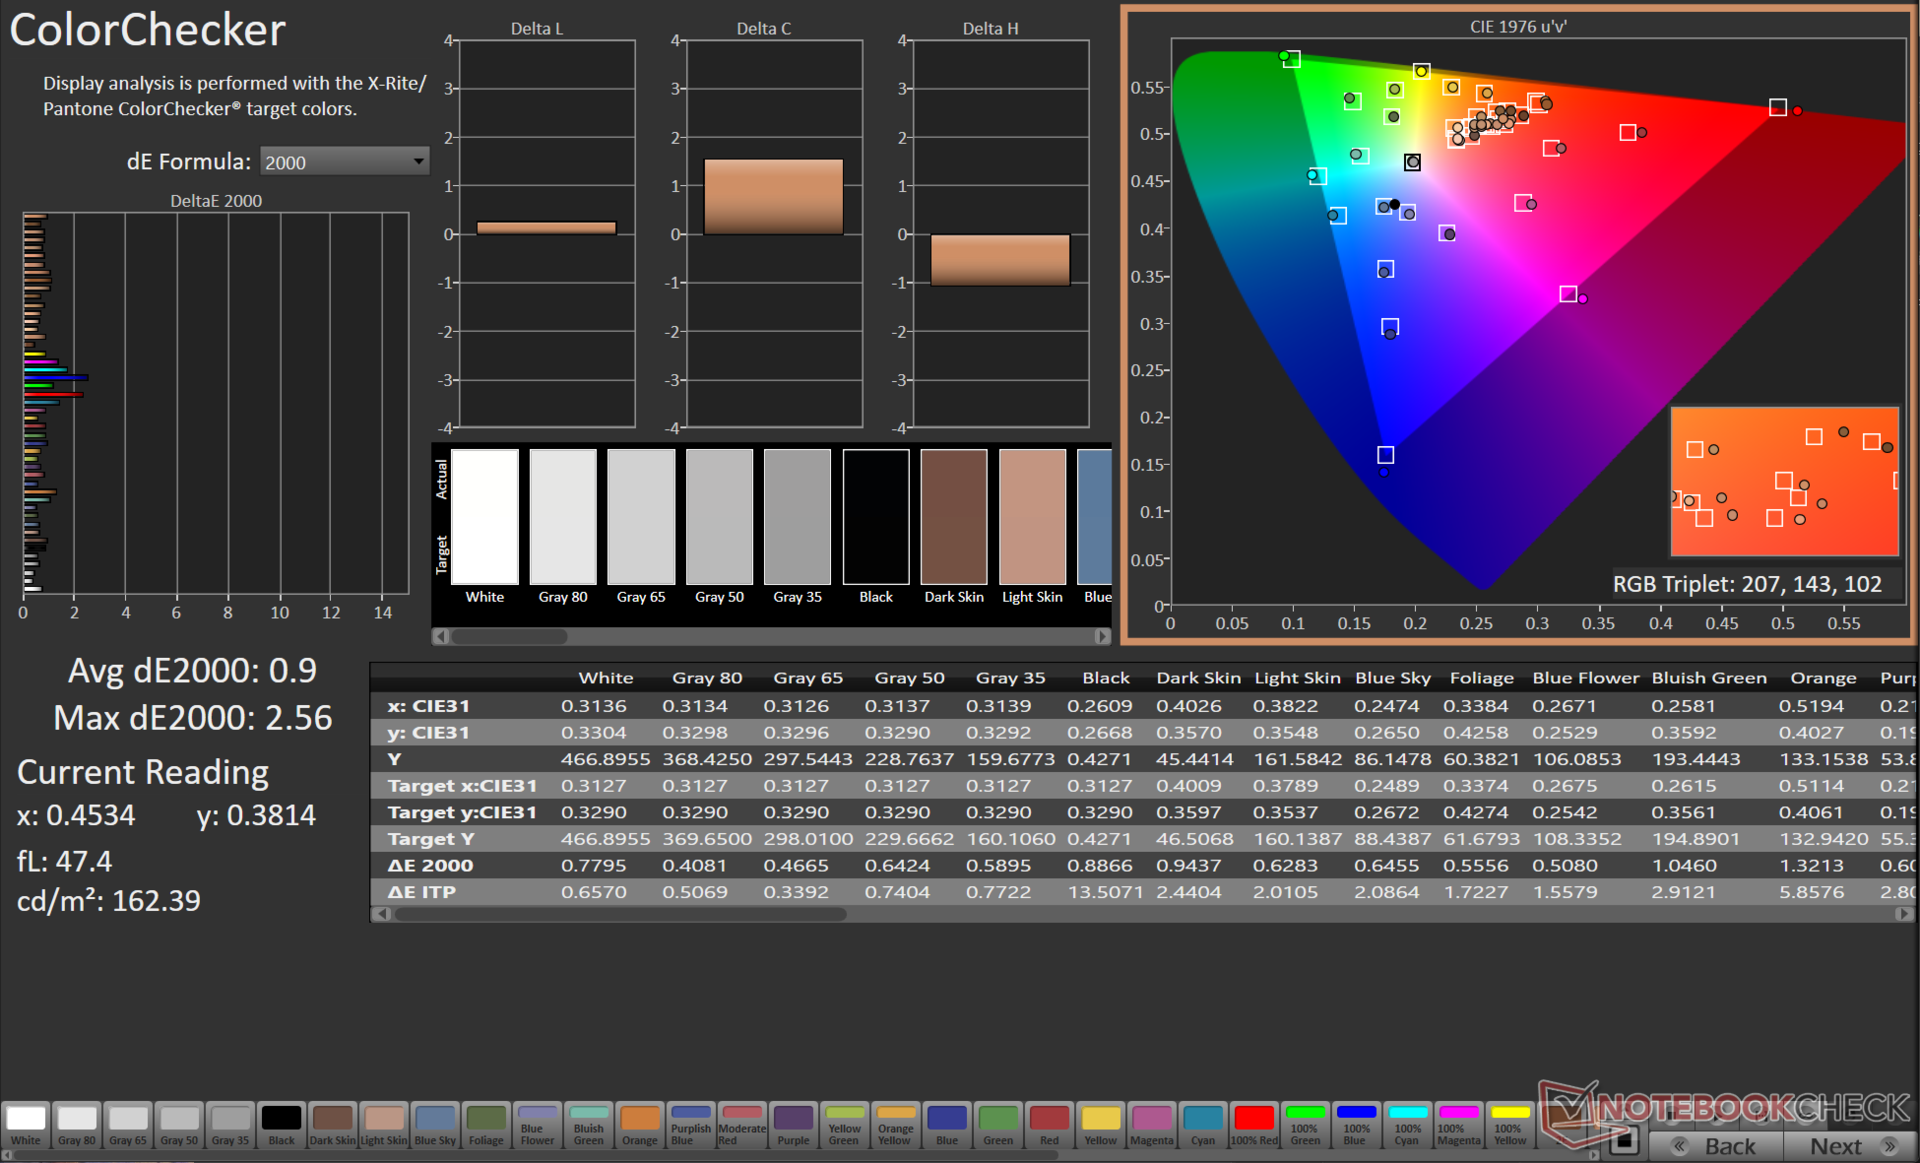
ΔE Color 1.08 | 0.5-29.43 Ø5, calibrated: 0.9
ΔE Greyscale 1.1 | 0.57-98 Ø5.3
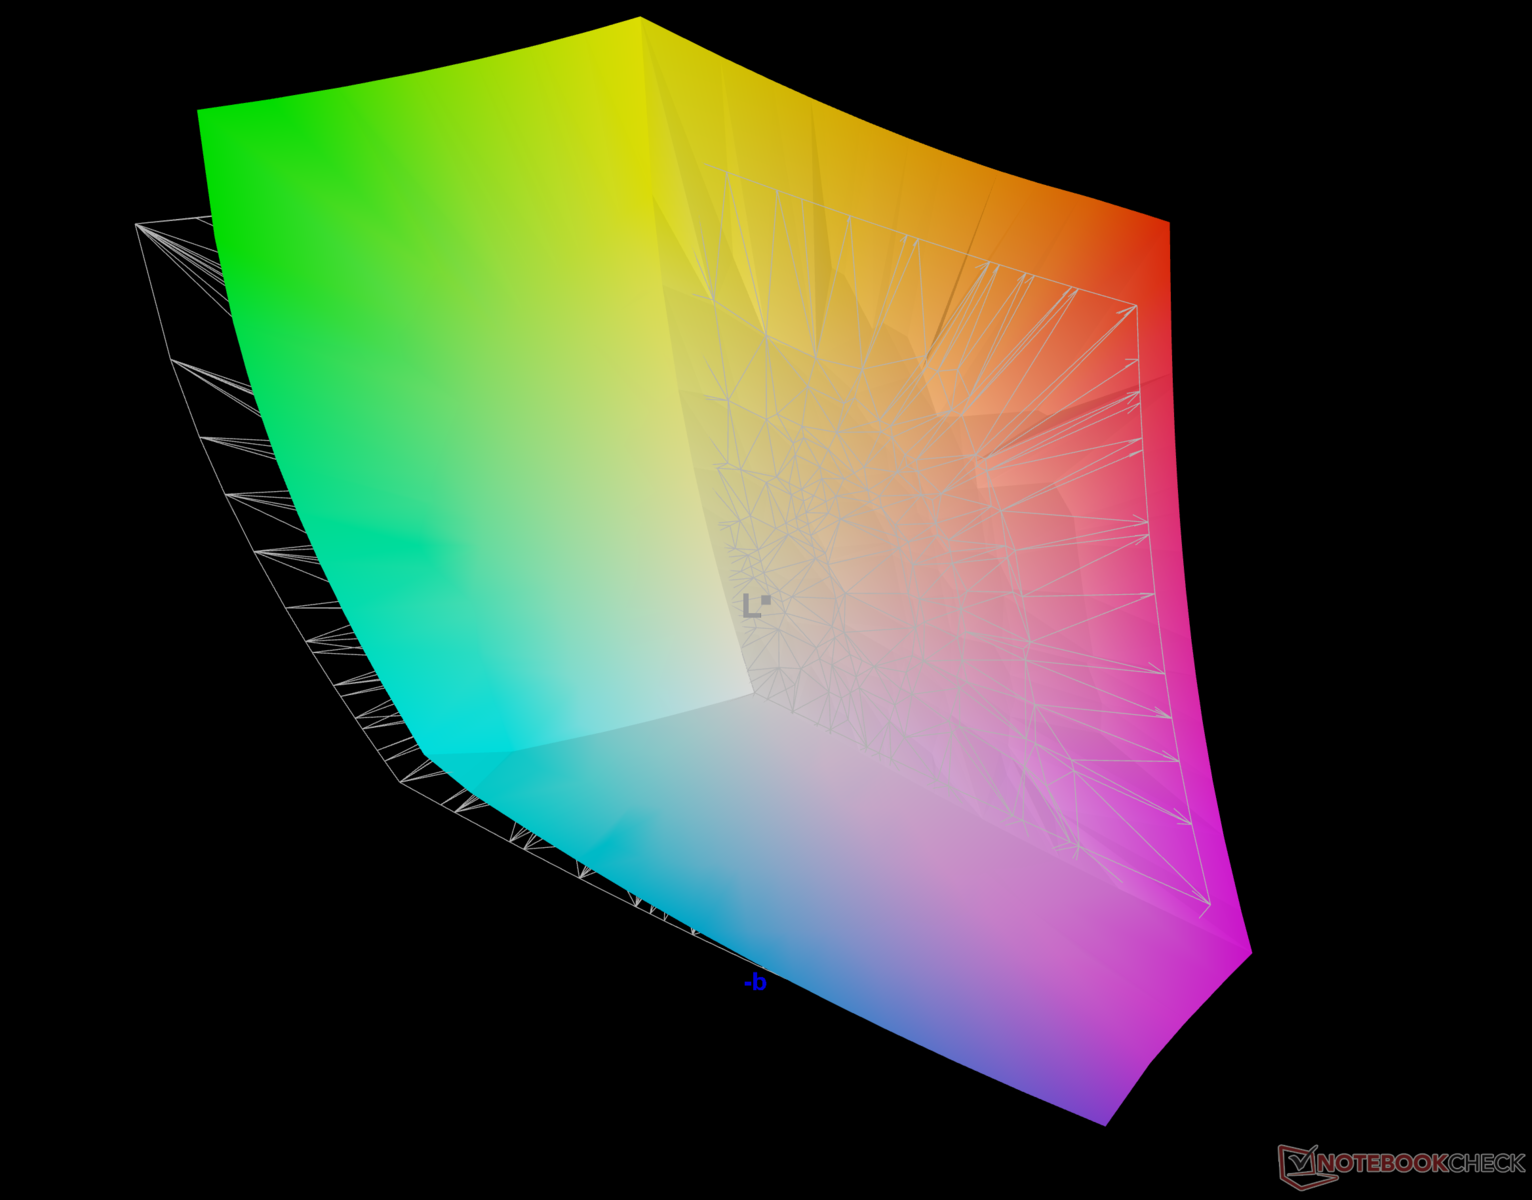
90.8% AdobeRGB 1998 (Argyll 2.2.0 3D)
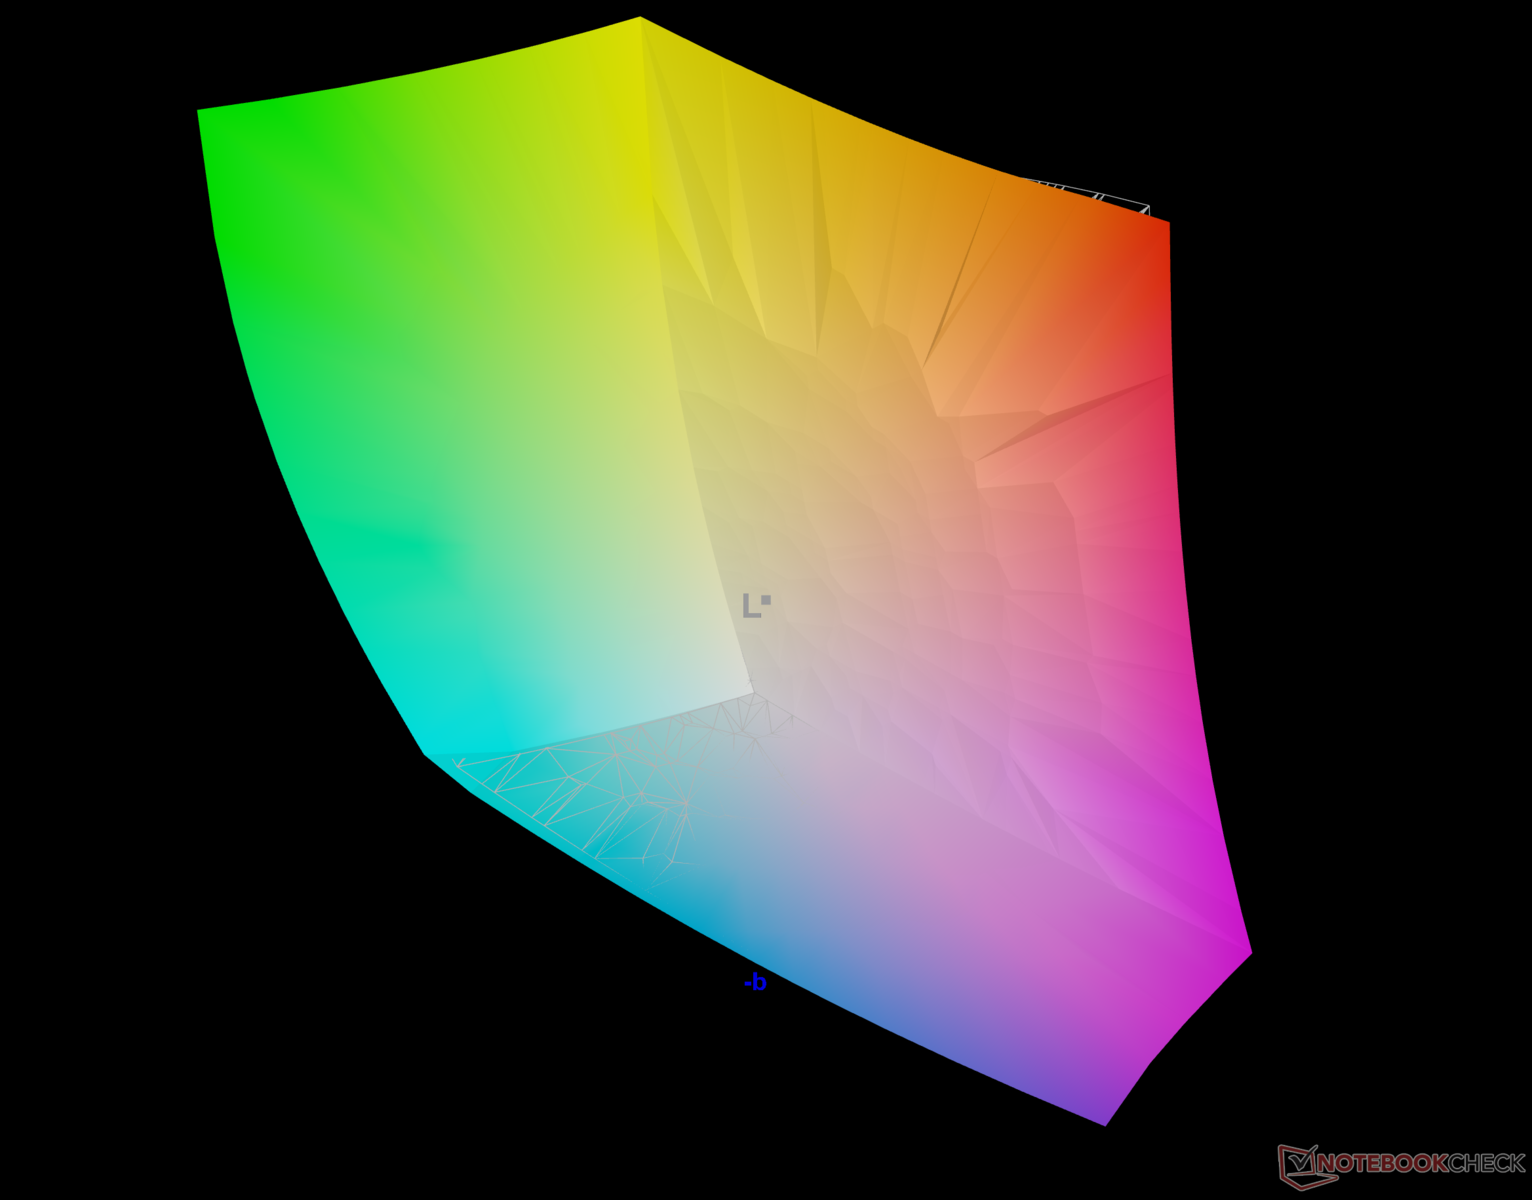
100% sRGB (Argyll 2.2.0 3D)
99.8% Display P3 (Argyll 2.2.0 3D)
Gamma: 2.13
| Asus ROG Strix Scar 16 G634JZR BOE NE160QDM-NM7, Mini LED, 2560x1600, 16.00 | Asus ROG Strix G16 G614JZ TL160ADMP03-0, IPS, 2560x1600, 16.00 | Lenovo Legion Pro 7 16IRX9H BOE CQ NE16QDM-NZB, IPS, 2560x1600, 16.00 | HP Omen 16 (2024) BOE BOE0B7D, IPS, 2560x1440, 16.10 | MSI Vector 16 HX A14V Chi Mei N160GME-GTB, IPS, 2560x1600, 16.00 | Alienware m16 R2 BOE NE16NYH, IPS, 2560x1600, 16.00 | |
|---|---|---|---|---|---|---|
| Display | -3% | -2% | -18% | -3% | -17% | |
| Display P3 Coverage | 99.8 | 97 -3% | 98.5 -1% | 68.6 -31% | 95.4 -4% | 71 -29% |
| sRGB Coverage | 100 | 99.9 0% | 99.9 0% | 98.6 -1% | 99.7 0% | 100 0% |
| AdobeRGB 1998 Coverage | 90.8 | 84.9 -6% | 86.7 -5% | 70.6 -22% | 85.4 -6% | 71.4 -21% |
| Response Times | 18% | -54% | -86% | -12% | 1% | |
| Response Time Grey 50% / Grey 80% * | 5 ? | 5.1 ? -2% | 12.6 ? -152% | 14.1 ? -182% | 5.7 ? -14% | 5.7 ? -14% |
| Response Time Black / White * | 10.4 ? | 6.6 ? 37% | 5.8 ? 44% | 9.3 ? 11% | 11.4 ? -10% | 8.7 ? 16% |
| PWM Frequency | 2040 ? | |||||
| Screen | -34% | -1% | -46% | -70% | -27% | |
| Brightness middle | 490 | 470 -4% | 487 -1% | 292 -40% | 557.2 14% | 345.8 -29% |
| Brightness | 487 | 459 -6% | 460 -6% | 291 -40% | 506 4% | 337 -31% |
| Brightness Distribution | 94 | 93 -1% | 88 -6% | 85 -10% | 83 -12% | 87 -7% |
| Black Level * | 0.4 | 0.42 -5% | 0.42 -5% | 0.24 40% | 0.41 -3% | 0.3 25% |
| Contrast | 1225 | 1119 -9% | 1160 -5% | 1217 -1% | 1359 11% | 1153 -6% |
| Colorchecker dE 2000 * | 1.08 | 1.86 -72% | 1.12 -4% | 2.36 -119% | 2.91 -169% | 1.99 -84% |
| Colorchecker dE 2000 max. * | 2.38 | 3.87 -63% | 2.26 5% | 4.08 -71% | 5.94 -150% | 3.52 -48% |
| Colorchecker dE 2000 calibrated * | 0.9 | 0.93 -3% | 0.54 40% | 0.93 -3% | 1.63 -81% | 0.62 31% |
| Greyscale dE 2000 * | 1.1 | 2.7 -145% | 1.4 -27% | 3 -173% | 3.8 -245% | 2.1 -91% |
| Gamma | 2.13 103% | 2.246 98% | 2.242 98% | 2.101 105% | 2.23 99% | 2.32 95% |
| CCT | 6724 97% | 6711 97% | 6809 95% | 5976 109% | 6408 101% | 6369 102% |
| Total Average (Program / Settings) | -6% /
-20% | -19% /
-9% | -50% /
-46% | -28% /
-48% | -14% /
-21% |
* ... smaller is better
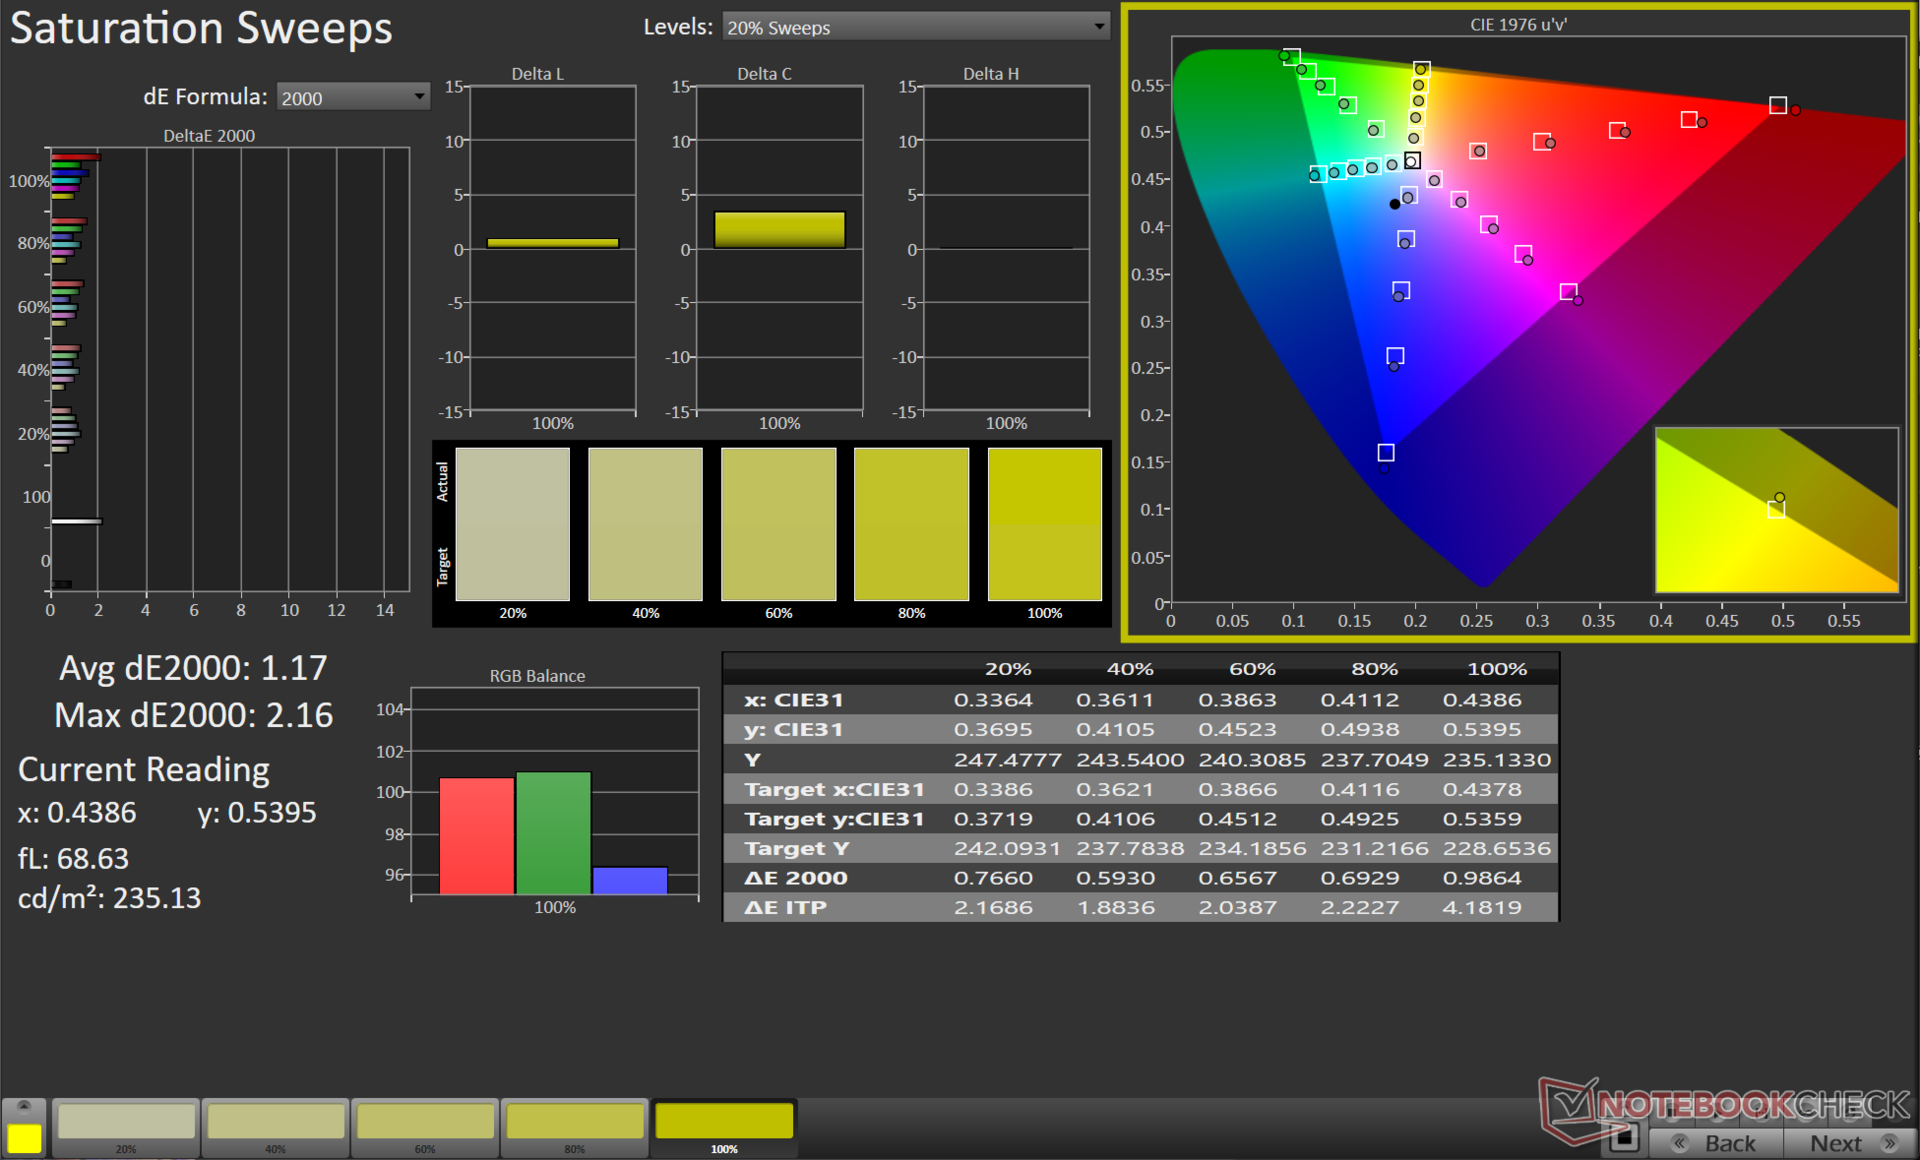
The Scar 16's display covers the sRGB and Display P3 color spaces completely. Adobe RGB coverage is also good at nearly 91%, making the Scar 16 very much amenable for both media consumption and content creation workflows.

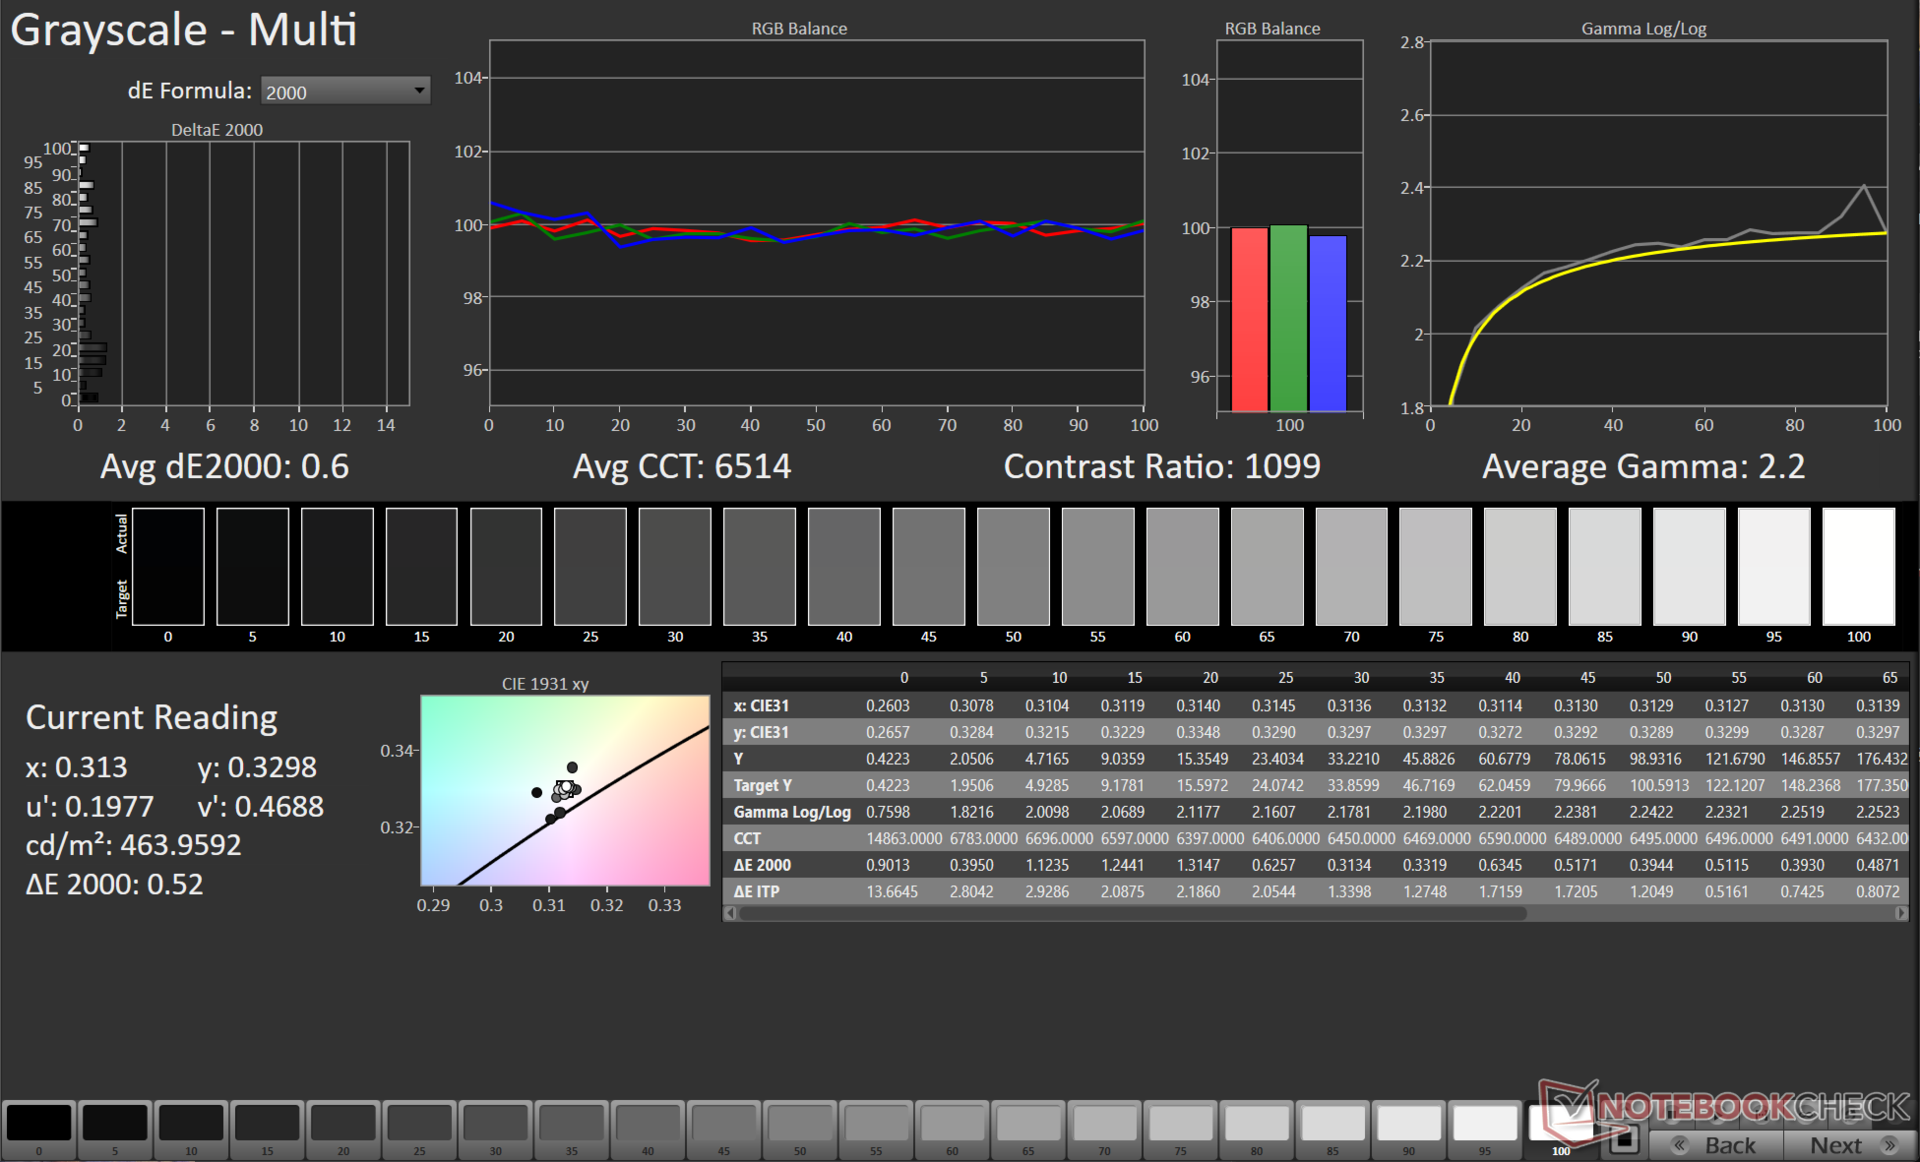
The Scar 16's display is well-calibrated out-of-the-box with average Grayscale and ColorChecker Delta E 2000 values of 1.1 and 1.08, respectively.
Our calibration routine in the Display P3 color space with the X-Rite i1Basic Pro 3 spectrophotometer and Calman Ultimate software from Portrait Displays further tightens these corresponding values to 0.6 and 0.9.

Display Response Times
| ↔ Response Time Black to White | ||
|---|---|---|
| 10.4 ms ... rise ↗ and fall ↘ combined | ↗ 3 ms rise |  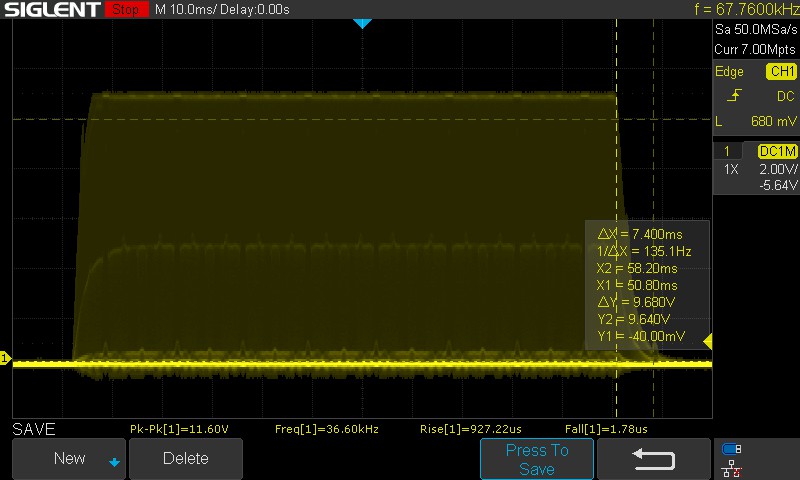 |
| ↘ 7.4 ms fall | ||
| The screen shows good response rates in our tests, but may be too slow for competitive gamers. In comparison, all tested devices range from 0.1 (minimum) to 240 (maximum) ms. » 23 % of all devices are better. This means that the measured response time is better than the average of all tested devices (21.5 ms). | ||
| ↔ Response Time 50% Grey to 80% Grey | ||
| 5 ms ... rise ↗ and fall ↘ combined | ↗ 2 ms rise | 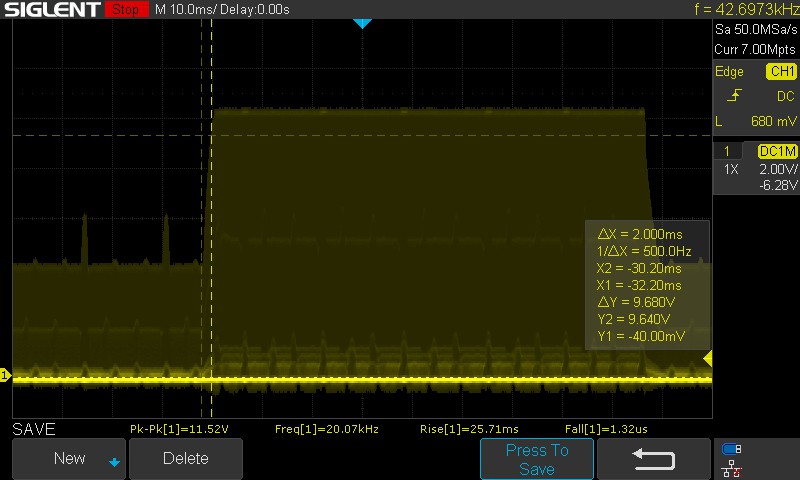 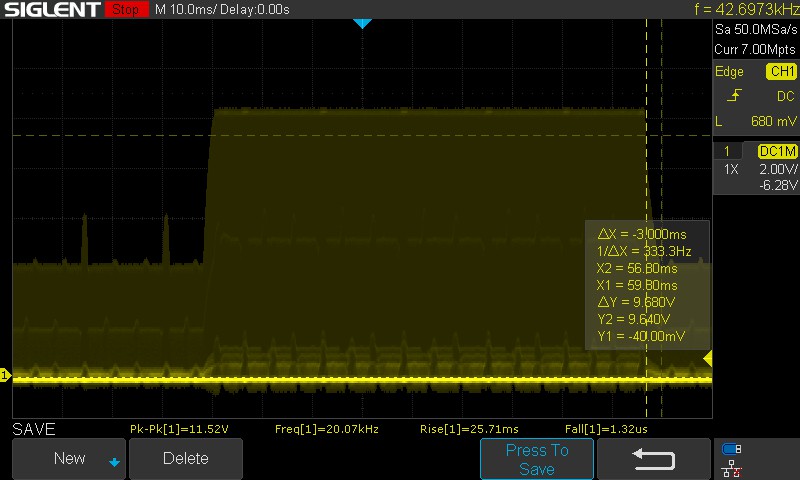 |
| ↘ 3 ms fall | ||
| The screen shows very fast response rates in our tests and should be very well suited for fast-paced gaming. In comparison, all tested devices range from 0.2 (minimum) to 636 (maximum) ms. » 12 % of all devices are better. This means that the measured response time is better than the average of all tested devices (33.7 ms). | ||
We had to manually estimate response times due to background PWM with the mini LED panel. The estimated response times seem decent for a gaming laptop.
Asus advertises a 3 ms response time, but we measured 5 ms with 50% grey to 80% grey transitions. A panel overdrive option is not offered.
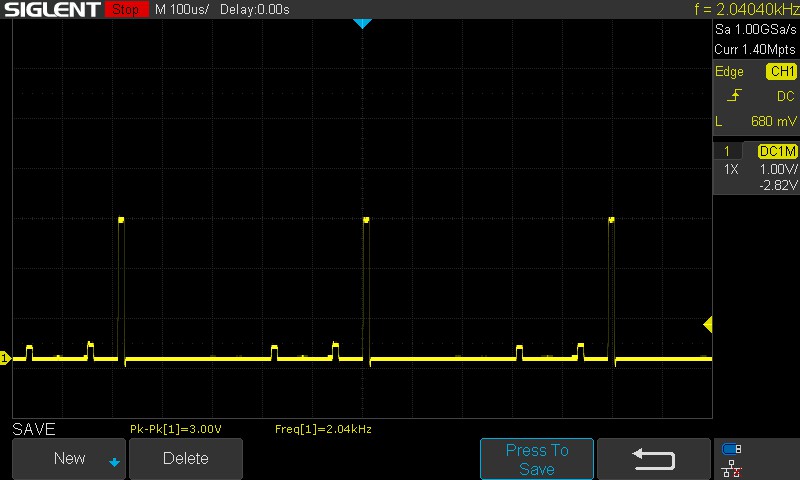
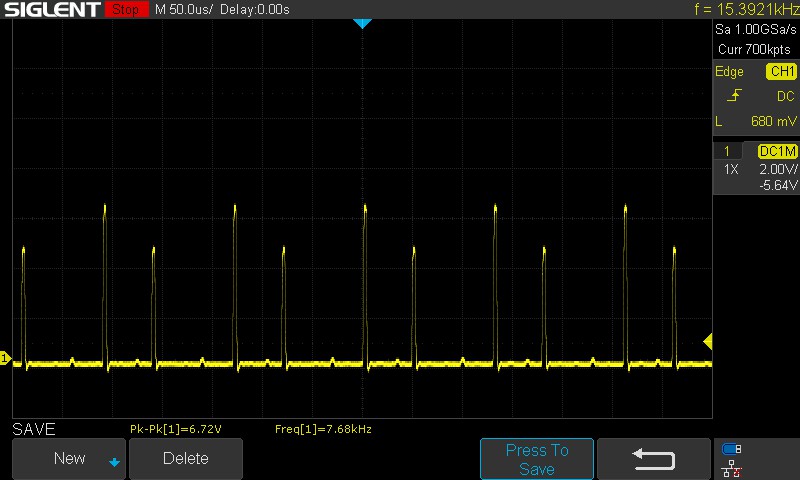
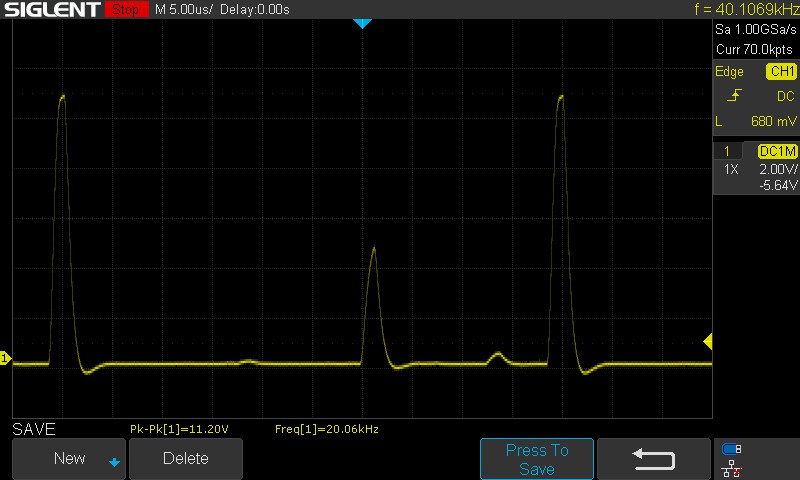
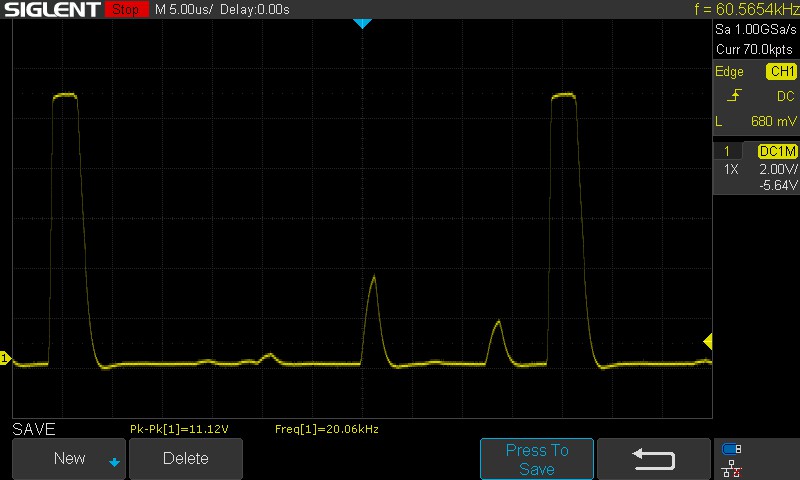
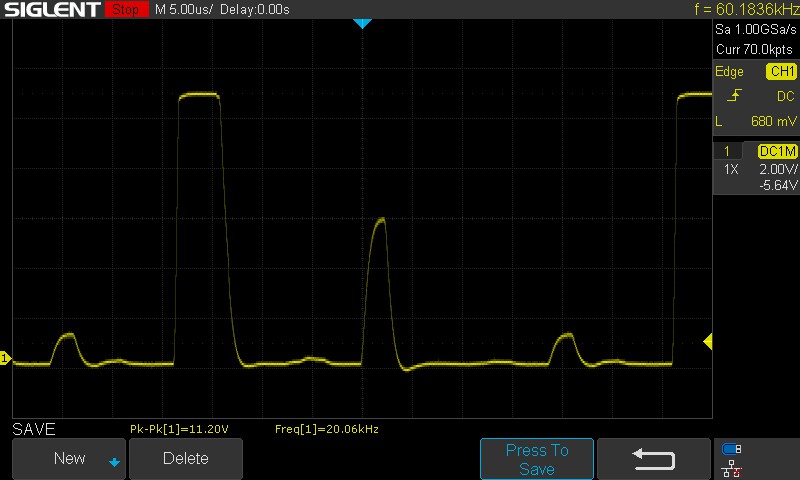
Screen Flickering / PWM (Pulse-Width Modulation)
| Screen flickering / PWM detected | 2040 Hz | ≤ 10 % brightness setting | 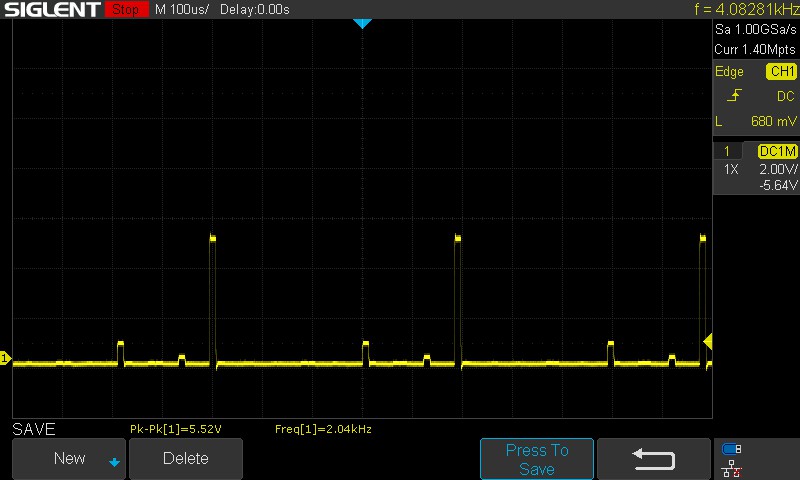 |
The display backlight flickers at 2040 Hz (worst case, e.g., utilizing PWM) Flickering detected at a brightness setting of 10 % and below. There should be no flickering or PWM above this brightness setting. The frequency of 2040 Hz is quite high, so most users sensitive to PWM should not notice any flickering. In comparison: 53 % of all tested devices do not use PWM to dim the display. If PWM was detected, an average of 17898 (minimum: 5 - maximum: 3846000) Hz was measured. | |||
We recorded a PWM frequency of 2.04 kHZ with the Windows brightness slider set to 10%. From 50% to 100% brightness, this value increases to 20.06 kHz. The measured values are quite high and thus, should pose no issues with eye strain even at lower brightness levels.
Refer to our article, "Why PWM is such a headache" for more information. We also have a PWM Ranking page that lists frequency measurements across all reviewed devices.

Outdoor viewing is generally fine, but a glaring sun can present issues with legibility of onscreen content. Viewing angles are quite stable with no perceivable loss of brightness or color information at the extremes.

Performance: Core i9-14900HX shows modest gains over Core i9-13980HX
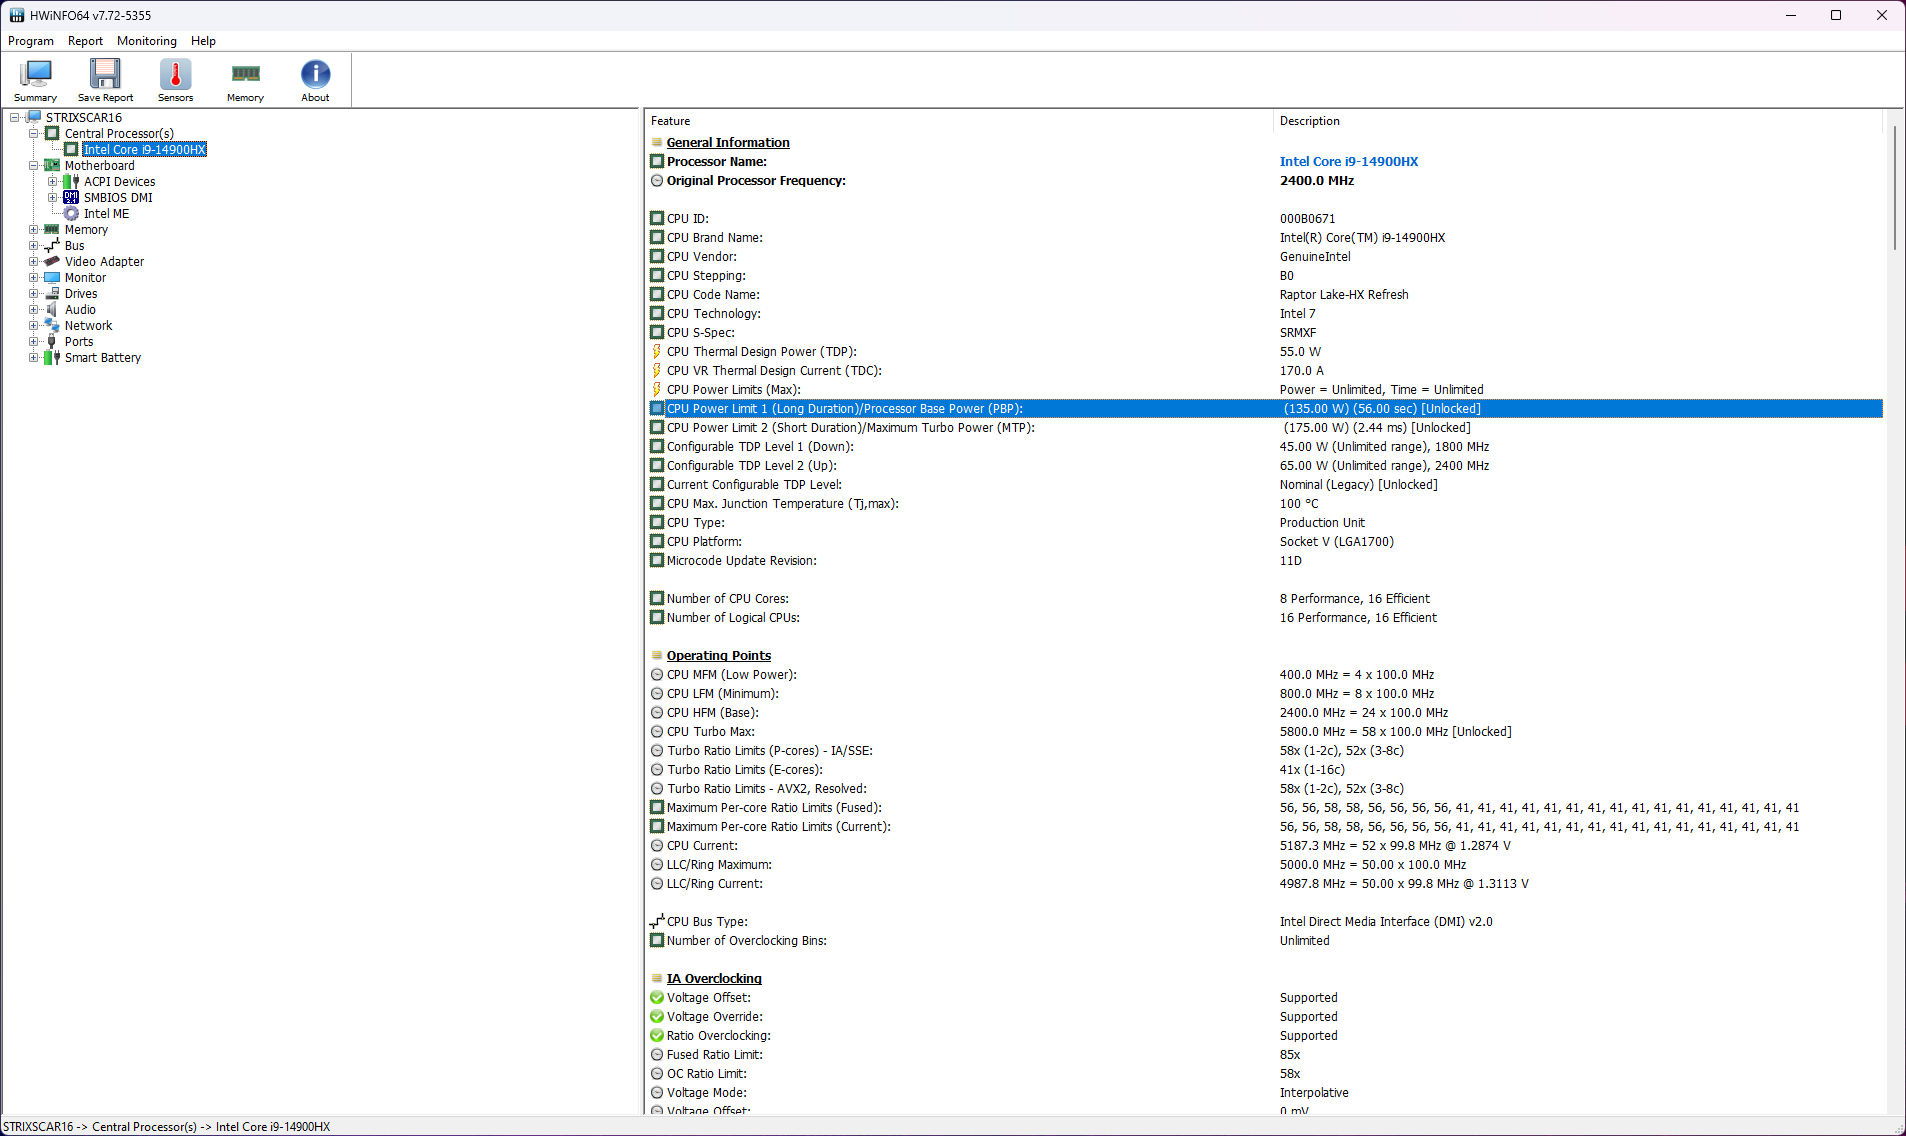
Asus offers the ROG Strix Scar 16 in two configurations, both with Intel Core i9-14900HX processors. The SKUs only differ in the GPU, with choices between the Nvidia GeForce RTX 4080 and the RTX 4090 Laptop GPUs.
Testing Conditions
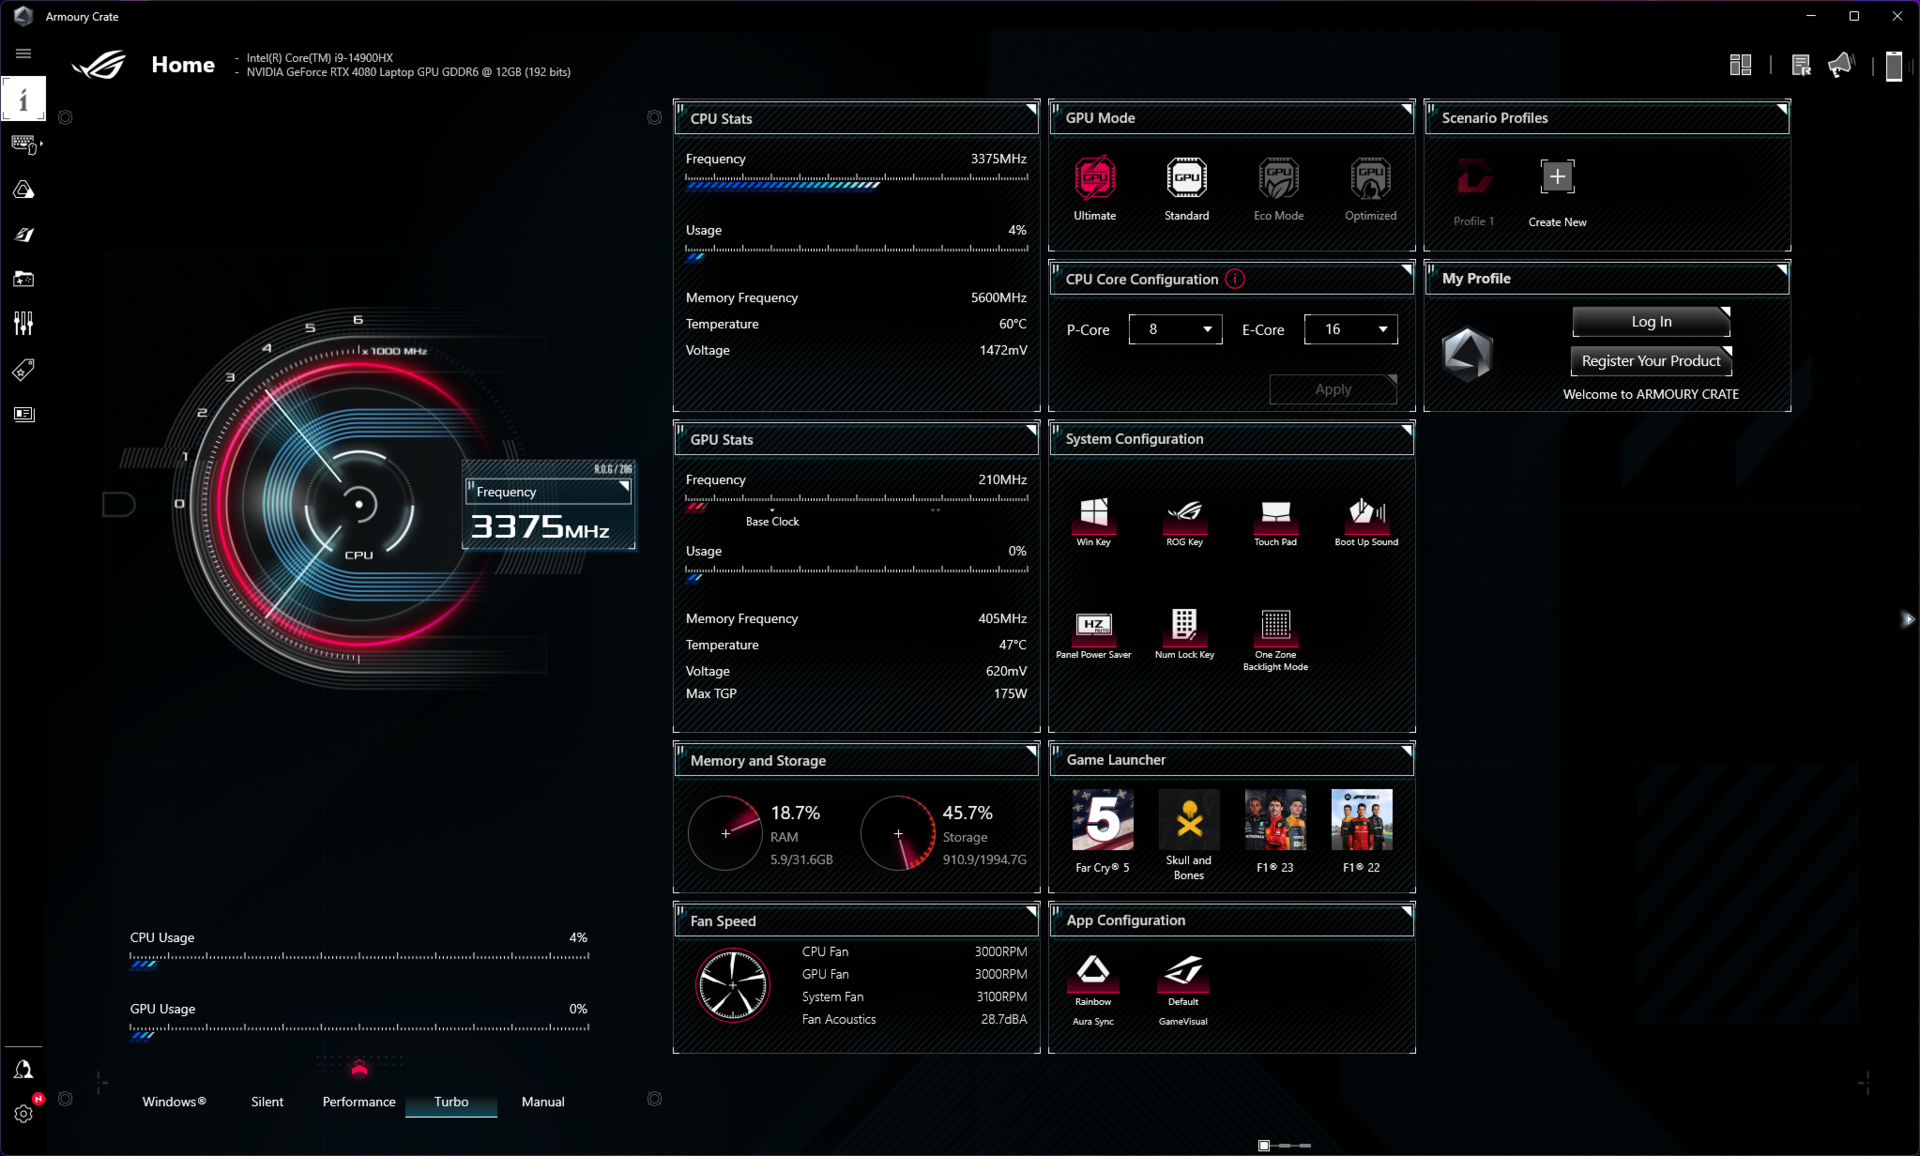
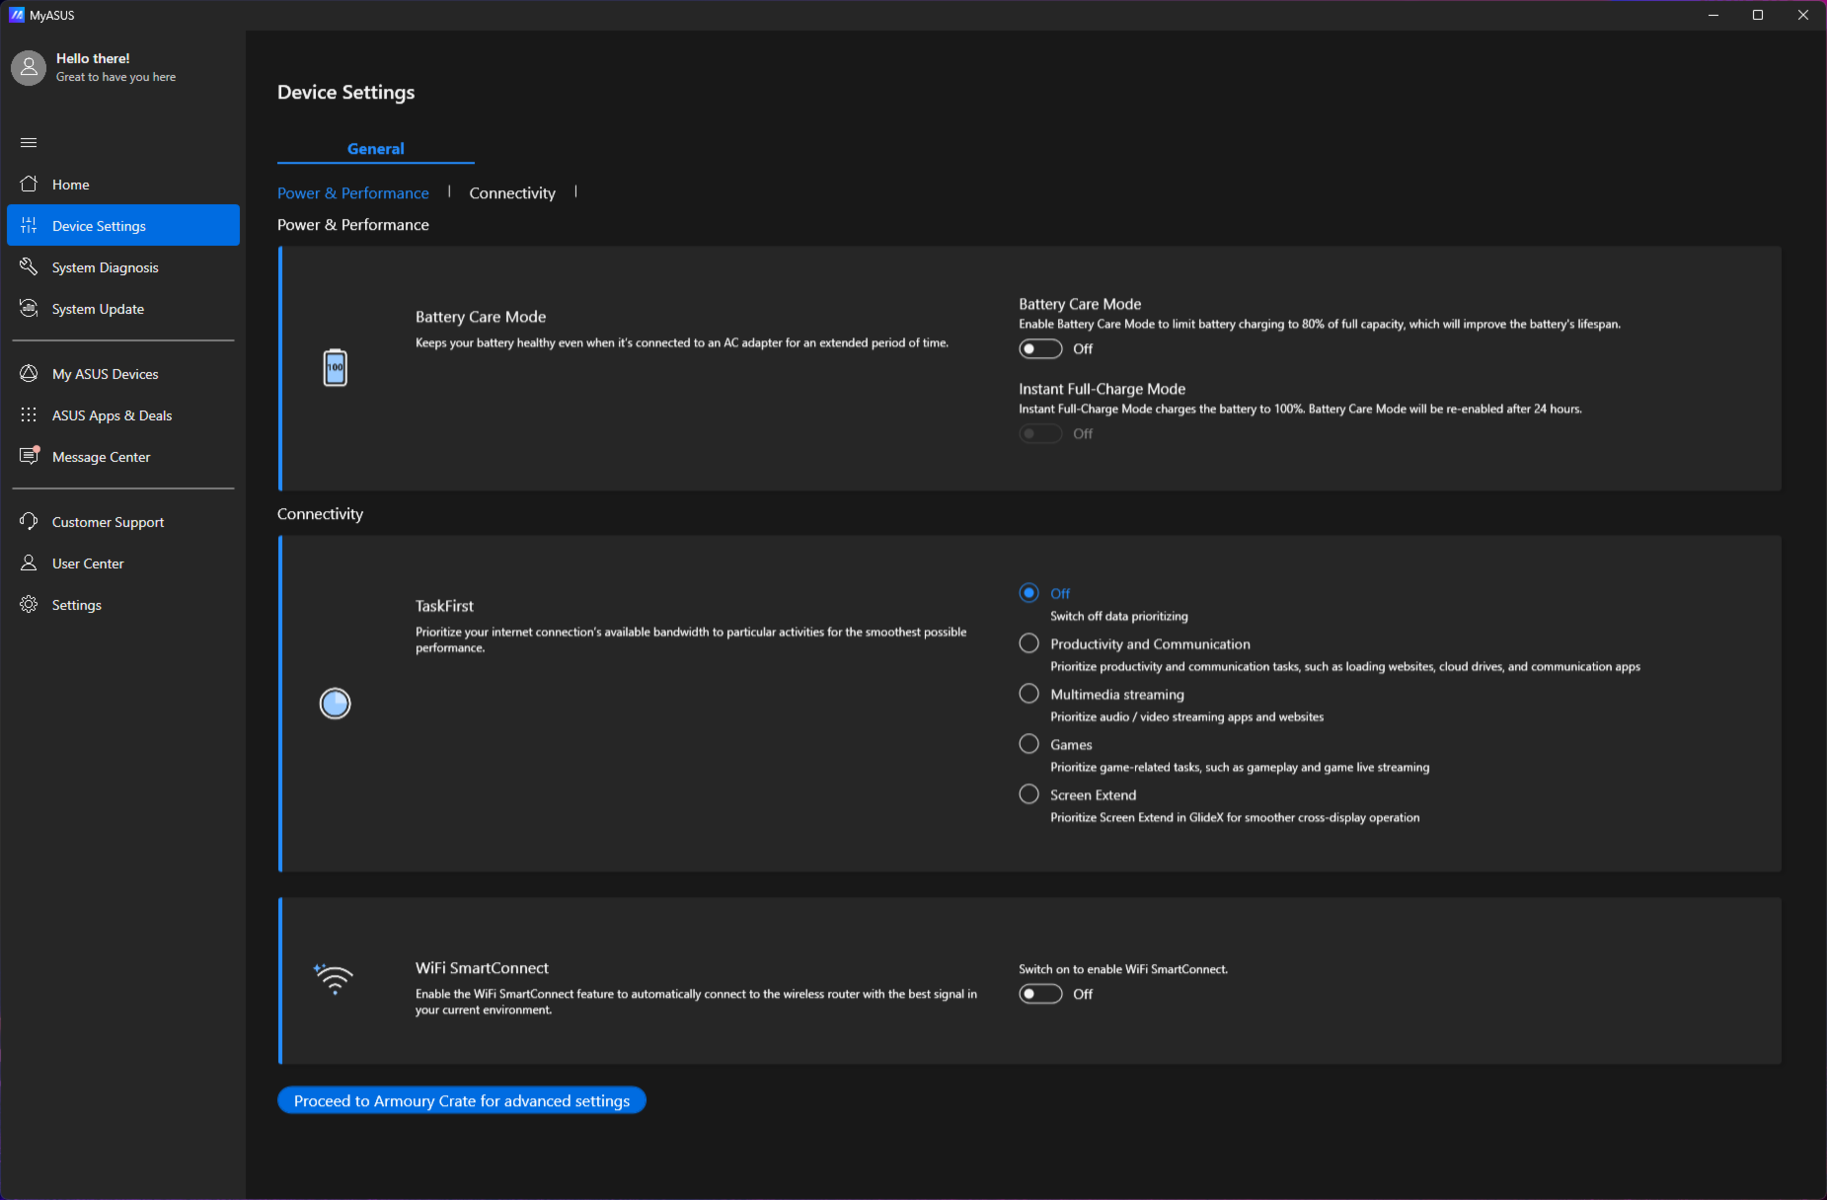
Performance tuning can be performed via Armory Crate. Asus also bundles the MyAsus app that offers ancillary functions such as system updates, diagnostics, etc.
The Scar 16 offers three primary power profiles to choose from: Silent, Performance, and Turbo. It is also possible to use Windows power plans in lieu of the ones available in Armory Crate. Additionally, there's a Manual mode that allows configuring up to a 140 W PL1.
| Performance mode | PL1 (PBP) / Tau | PL2 (MTP) / Tau | Cinebench R15 Multi score | Cinebench R15 Multi score (30 loops) |
|---|---|---|---|---|
| Silent | 70 W / 56 s | 100 W / 2.44 ms | 3904 (-15.14%) | 3435 (-20.98%) |
| Performance | 107 W / 56 s | 120 W / 2.44 ms | 4208 (-8.54%) | 4182 (-3.79%) |
| Turbo | 135 W / 56 s | 175 W / 2.44 ms | 4601 (100%) | 4347 (100%) |
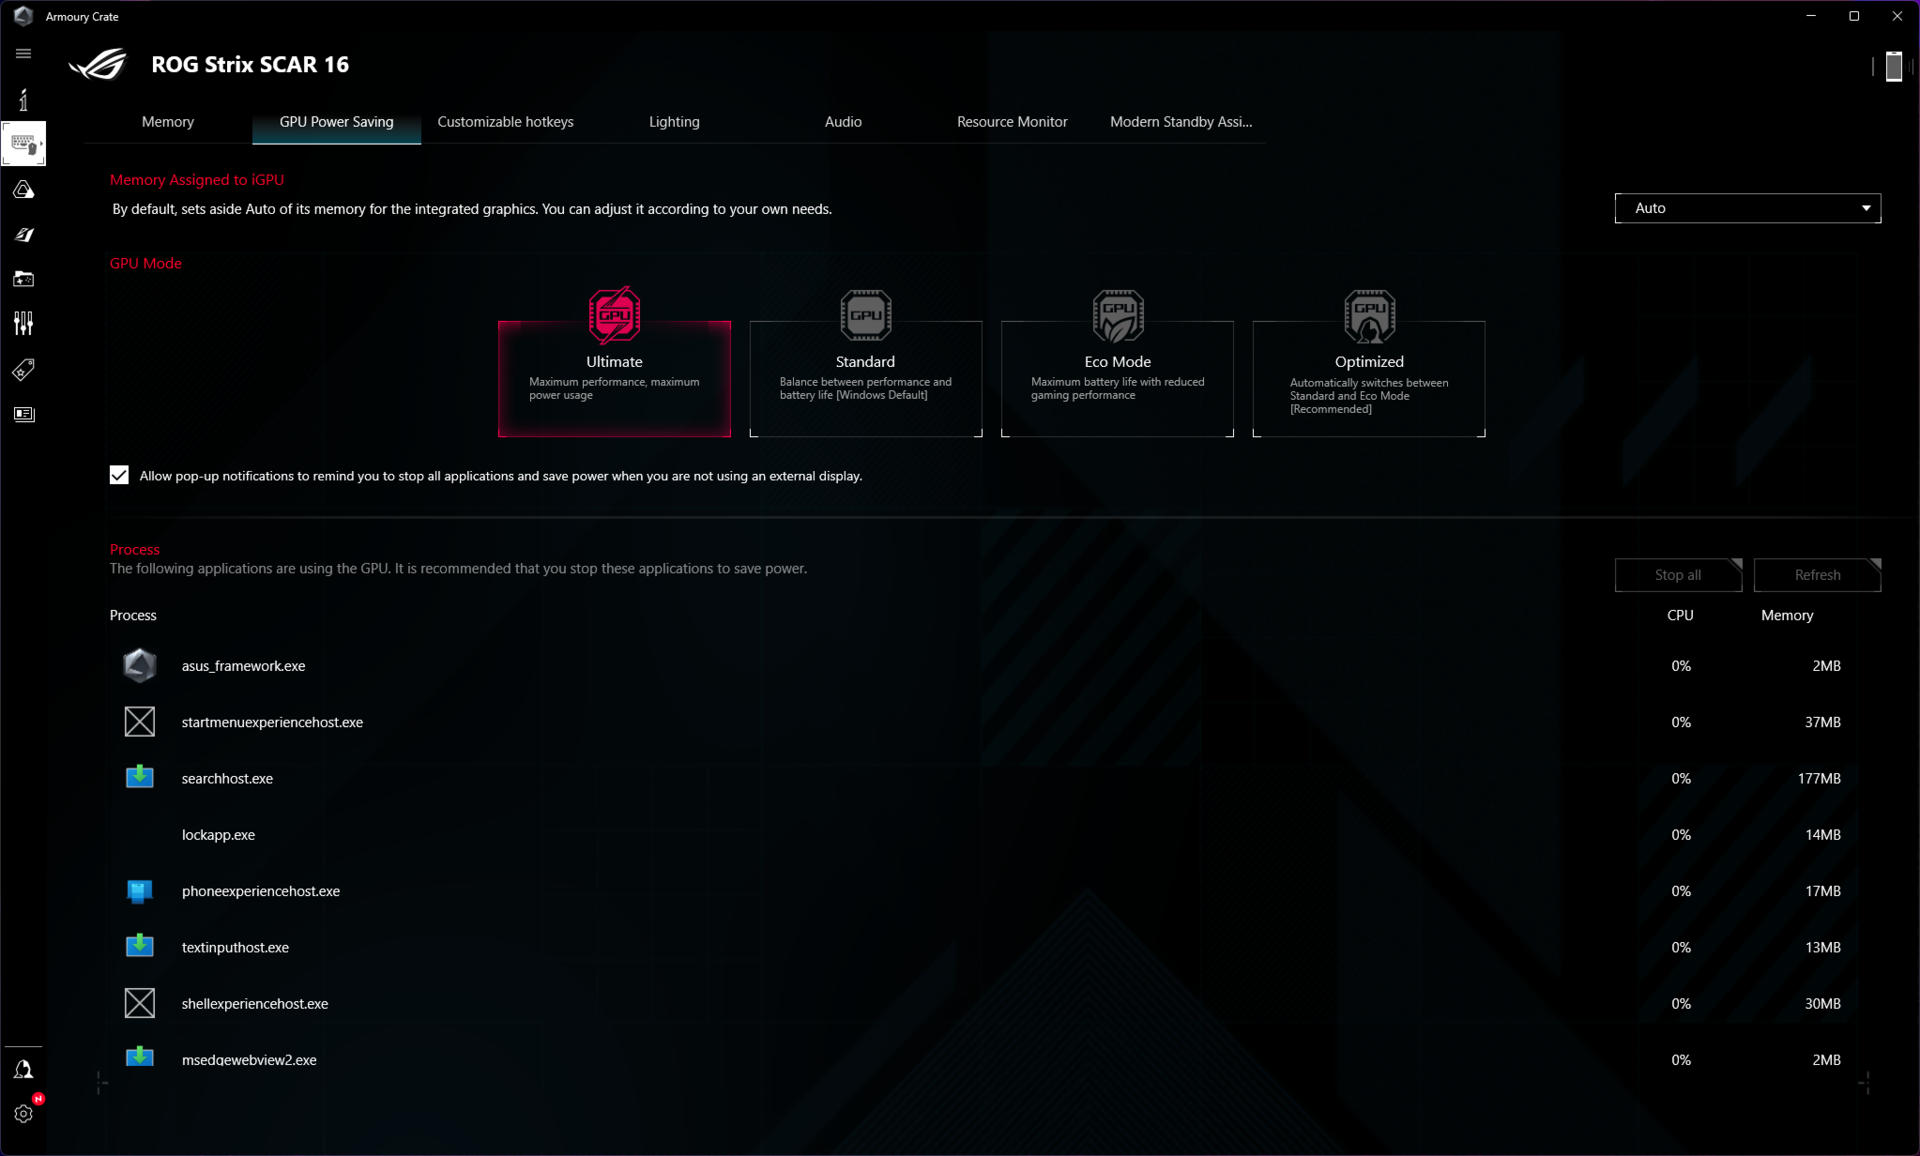
Nvidia Advanced Optimus is supported, but Asus includes a hardware MUX mode as well. We performed all benchmarking in the Turbo mode with MUX set to the RTX 4080 dGPU.
Battery tests were performed in the Silent mode with MSHybrid enabled.
Processor
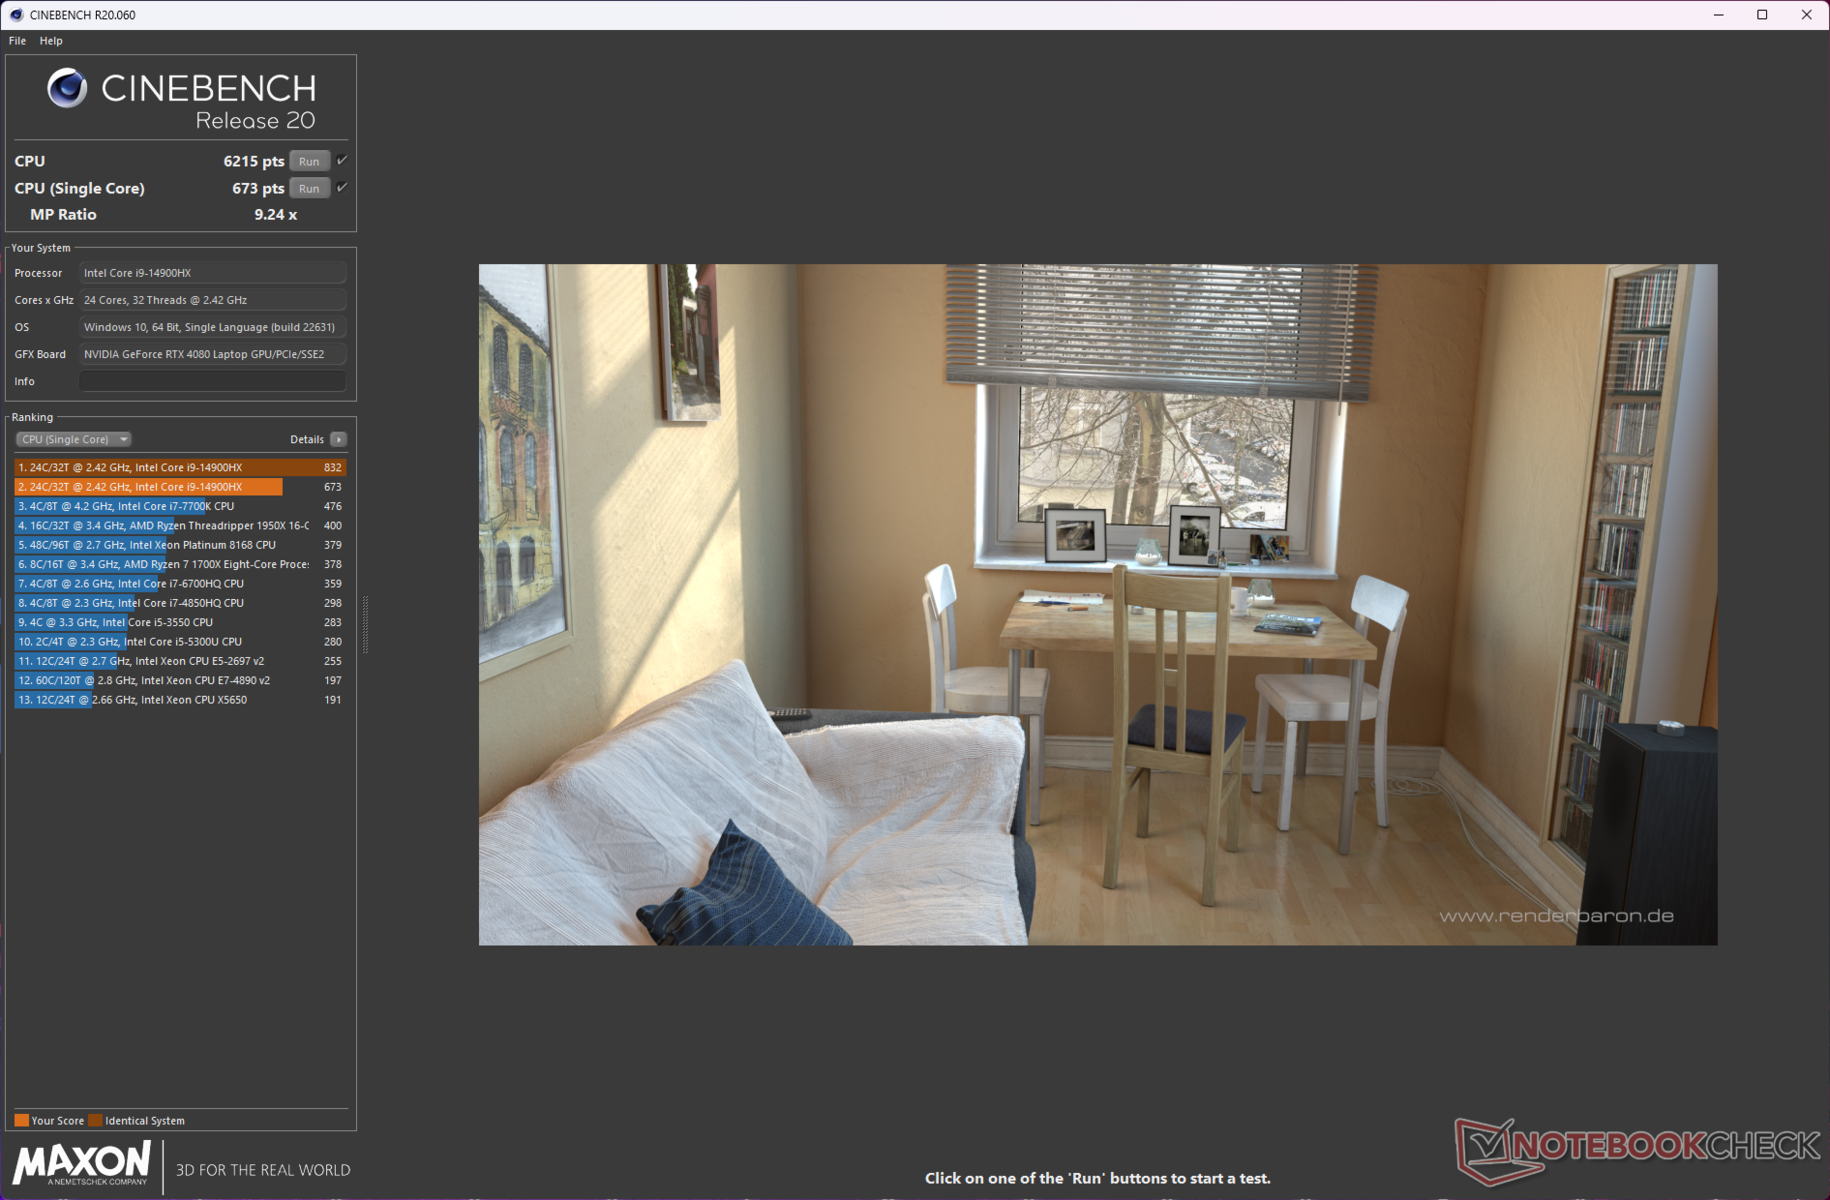
The Core i9-14900HX is pretty much akin to the Core i9-13980HX featuring 24 cores (8P + 16E) and 32 threads but with a 5.8 GHz boost.
The 14th gen Raptor Lake-HX isn't a major upgrade and the performance uplift from a Core i9-13980HX is within the margin of error. The Scar 16's single-core performance is on par with other Core i9-14900HX laptops in comparison.
However, the MSI Vector 16 HX with the same CPU has a perceivable advantage in multi-core due to the higher 184 W PL2. Conversely, the HP Omen 16's Core i9-14900HX with a 130 W PL2 trails behind the Scar 16 in these tests.
Cinebench R15 Multi Loop
Cinebench R23: Multi Core | Single Core
Cinebench R20: CPU (Multi Core) | CPU (Single Core)
Cinebench R15: CPU Multi 64Bit | CPU Single 64Bit
Blender: v2.79 BMW27 CPU
7-Zip 18.03: 7z b 4 | 7z b 4 -mmt1
Geekbench 6.2: Multi-Core | Single-Core
Geekbench 5.5: Multi-Core | Single-Core
HWBOT x265 Benchmark v2.2: 4k Preset
LibreOffice : 20 Documents To PDF
R Benchmark 2.5: Overall mean
| CPU Performance Rating | |
| Lenovo Legion Pro 7 16IRX9H | |
| Asus ROG Strix Scar 17 G733PYV-LL053X | |
| Asus ROG Strix Scar 16 G634JZR | |
| MSI Vector 16 HX A14V | |
| Average Intel Core i9-14900HX | |
| Asus ROG Strix G16 G614JZ -2! | |
| HP Omen 16 (2024) | |
| Average of class Gaming | |
| Alienware m16 R2 -1! | |
| Cinebench R23 / Multi Core | |
| MSI Vector 16 HX A14V | |
| Asus ROG Strix Scar 17 G733PYV-LL053X | |
| Lenovo Legion Pro 7 16IRX9H | |
| Asus ROG Strix Scar 16 G634JZR | |
| Asus ROG Strix G16 G614JZ | |
| Average Intel Core i9-14900HX (20702 - 32996, n=23) | |
| HP Omen 16 (2024) | |
| Average of class Gaming (2435 - 34613, n=233, last 2 years) | |
| Alienware m16 R2 | |
| Cinebench R23 / Single Core | |
| Lenovo Legion Pro 7 16IRX9H | |
| HP Omen 16 (2024) | |
| MSI Vector 16 HX A14V | |
| Asus ROG Strix Scar 16 G634JZR | |
| Average Intel Core i9-14900HX (2043 - 2235, n=23) | |
| Asus ROG Strix G16 G614JZ | |
| Asus ROG Strix Scar 17 G733PYV-LL053X | |
| Average of class Gaming (527 - 2235, n=231, last 2 years) | |
| Alienware m16 R2 | |
| Cinebench R20 / CPU (Multi Core) | |
| Asus ROG Strix Scar 17 G733PYV-LL053X | |
| Lenovo Legion Pro 7 16IRX9H | |
| MSI Vector 16 HX A14V | |
| Asus ROG Strix Scar 16 G634JZR | |
| Asus ROG Strix G16 G614JZ | |
| Average Intel Core i9-14900HX (8427 - 12419, n=23) | |
| HP Omen 16 (2024) | |
| Average of class Gaming (930 - 13769, n=231, last 2 years) | |
| Alienware m16 R2 | |
| Cinebench R20 / CPU (Single Core) | |
| HP Omen 16 (2024) | |
| Asus ROG Strix Scar 16 G634JZR | |
| MSI Vector 16 HX A14V | |
| Average Intel Core i9-14900HX (779 - 859, n=23) | |
| Lenovo Legion Pro 7 16IRX9H | |
| Asus ROG Strix G16 G614JZ | |
| Asus ROG Strix Scar 17 G733PYV-LL053X | |
| Average of class Gaming (169 - 855, n=231, last 2 years) | |
| Alienware m16 R2 | |
| Cinebench R15 / CPU Multi 64Bit | |
| Asus ROG Strix Scar 17 G733PYV-LL053X | |
| Asus ROG Strix Scar 16 G634JZR | |
| Asus ROG Strix G16 G614JZ | |
| Asus ROG Strix G16 G614JZ | |
| Lenovo Legion Pro 7 16IRX9H | |
| MSI Vector 16 HX A14V | |
| Average Intel Core i9-14900HX (3263 - 4875, n=23) | |
| HP Omen 16 (2024) | |
| Average of class Gaming (400 - 5663, n=235, last 2 years) | |
| Alienware m16 R2 | |
| Cinebench R15 / CPU Single 64Bit | |
| Asus ROG Strix Scar 16 G634JZR | |
| Lenovo Legion Pro 7 16IRX9H | |
| Asus ROG Strix Scar 17 G733PYV-LL053X | |
| HP Omen 16 (2024) | |
| Average Intel Core i9-14900HX (287 - 320, n=23) | |
| MSI Vector 16 HX A14V | |
| Asus ROG Strix G16 G614JZ | |
| Asus ROG Strix G16 G614JZ | |
| Average of class Gaming (79.2 - 318, n=234, last 2 years) | |
| Alienware m16 R2 | |
| Blender / v2.79 BMW27 CPU | |
| Average of class Gaming (87 - 1259, n=229, last 2 years) | |
| HP Omen 16 (2024) | |
| Average Intel Core i9-14900HX (102 - 164, n=23) | |
| Asus ROG Strix Scar 16 G634JZR | |
| Asus ROG Strix G16 G614JZ | |
| Lenovo Legion Pro 7 16IRX9H | |
| MSI Vector 16 HX A14V | |
| Asus ROG Strix Scar 17 G733PYV-LL053X | |
| 7-Zip 18.03 / 7z b 4 | |
| Asus ROG Strix Scar 17 G733PYV-LL053X | |
| Lenovo Legion Pro 7 16IRX9H | |
| MSI Vector 16 HX A14V | |
| Asus ROG Strix Scar 16 G634JZR | |
| Asus ROG Strix G16 G614JZ | |
| Average Intel Core i9-14900HX (87555 - 127108, n=23) | |
| HP Omen 16 (2024) | |
| Average of class Gaming (11386 - 140932, n=230, last 2 years) | |
| Alienware m16 R2 | |
| 7-Zip 18.03 / 7z b 4 -mmt1 | |
| Asus ROG Strix Scar 17 G733PYV-LL053X | |
| Asus ROG Strix Scar 16 G634JZR | |
| Lenovo Legion Pro 7 16IRX9H | |
| HP Omen 16 (2024) | |
| MSI Vector 16 HX A14V | |
| Average Intel Core i9-14900HX (6206 - 7508, n=23) | |
| Asus ROG Strix G16 G614JZ | |
| Average of class Gaming (2685 - 7581, n=230, last 2 years) | |
| Alienware m16 R2 | |
| Geekbench 6.2 / Multi-Core | |
| Asus ROG Strix Scar 16 G634JZR | |
| Lenovo Legion Pro 7 16IRX9H | |
| MSI Vector 16 HX A14V | |
| Average Intel Core i9-14900HX (15849 - 18643, n=23) | |
| Asus ROG Strix Scar 17 G733PYV-LL053X | |
| HP Omen 16 (2024) | |
| Average of class Gaming (5340 - 18590, n=77, last 2 years) | |
| Alienware m16 R2 | |
| Geekbench 6.2 / Single-Core | |
| HP Omen 16 (2024) | |
| Lenovo Legion Pro 7 16IRX9H | |
| Asus ROG Strix Scar 16 G634JZR | |
| MSI Vector 16 HX A14V | |
| Average Intel Core i9-14900HX (2800 - 3095, n=23) | |
| Asus ROG Strix Scar 17 G733PYV-LL053X | |
| Average of class Gaming (1599 - 3095, n=77, last 2 years) | |
| Alienware m16 R2 | |
| Geekbench 5.5 / Multi-Core | |
| Asus ROG Strix Scar 16 G634JZR | |
| MSI Vector 16 HX A14V | |
| Lenovo Legion Pro 7 16IRX9H | |
| Asus ROG Strix Scar 17 G733PYV-LL053X | |
| Average Intel Core i9-14900HX (8618 - 21606, n=23) | |
| Asus ROG Strix G16 G614JZ | |
| HP Omen 16 (2024) | |
| Average of class Gaming (1946 - 22200, n=235, last 2 years) | |
| Alienware m16 R2 | |
| Geekbench 5.5 / Single-Core | |
| Asus ROG Strix Scar 16 G634JZR | |
| HP Omen 16 (2024) | |
| Asus ROG Strix Scar 17 G733PYV-LL053X | |
| MSI Vector 16 HX A14V | |
| Lenovo Legion Pro 7 16IRX9H | |
| Average Intel Core i9-14900HX (1669 - 2210, n=23) | |
| Asus ROG Strix G16 G614JZ | |
| Average of class Gaming (158 - 2210, n=235, last 2 years) | |
| Alienware m16 R2 | |
| HWBOT x265 Benchmark v2.2 / 4k Preset | |
| Asus ROG Strix Scar 17 G733PYV-LL053X | |
| Lenovo Legion Pro 7 16IRX9H | |
| MSI Vector 16 HX A14V | |
| Asus ROG Strix Scar 16 G634JZR | |
| Asus ROG Strix G16 G614JZ | |
| Average Intel Core i9-14900HX (22.7 - 34.4, n=23) | |
| HP Omen 16 (2024) | |
| Average of class Gaming (3 - 37.6, n=233, last 2 years) | |
| Alienware m16 R2 | |
| LibreOffice / 20 Documents To PDF | |
| Alienware m16 R2 | |
| Average of class Gaming (32.8 - 332, n=227, last 2 years) | |
| Asus ROG Strix Scar 16 G634JZR | |
| Asus ROG Strix G16 G614JZ | |
| MSI Vector 16 HX A14V | |
| HP Omen 16 (2024) | |
| Average Intel Core i9-14900HX (33.9 - 85.1, n=23) | |
| Asus ROG Strix Scar 17 G733PYV-LL053X | |
| Lenovo Legion Pro 7 16IRX9H | |
| R Benchmark 2.5 / Overall mean | |
| Alienware m16 R2 | |
| Average of class Gaming (0.3609 - 4.47, n=230, last 2 years) | |
| Asus ROG Strix Scar 17 G733PYV-LL053X | |
| Asus ROG Strix G16 G614JZ | |
| Lenovo Legion Pro 7 16IRX9H | |
| MSI Vector 16 HX A14V | |
| Average Intel Core i9-14900HX (0.3609 - 0.4225, n=23) | |
| HP Omen 16 (2024) | |
| Asus ROG Strix Scar 16 G634JZR | |
* ... smaller is better
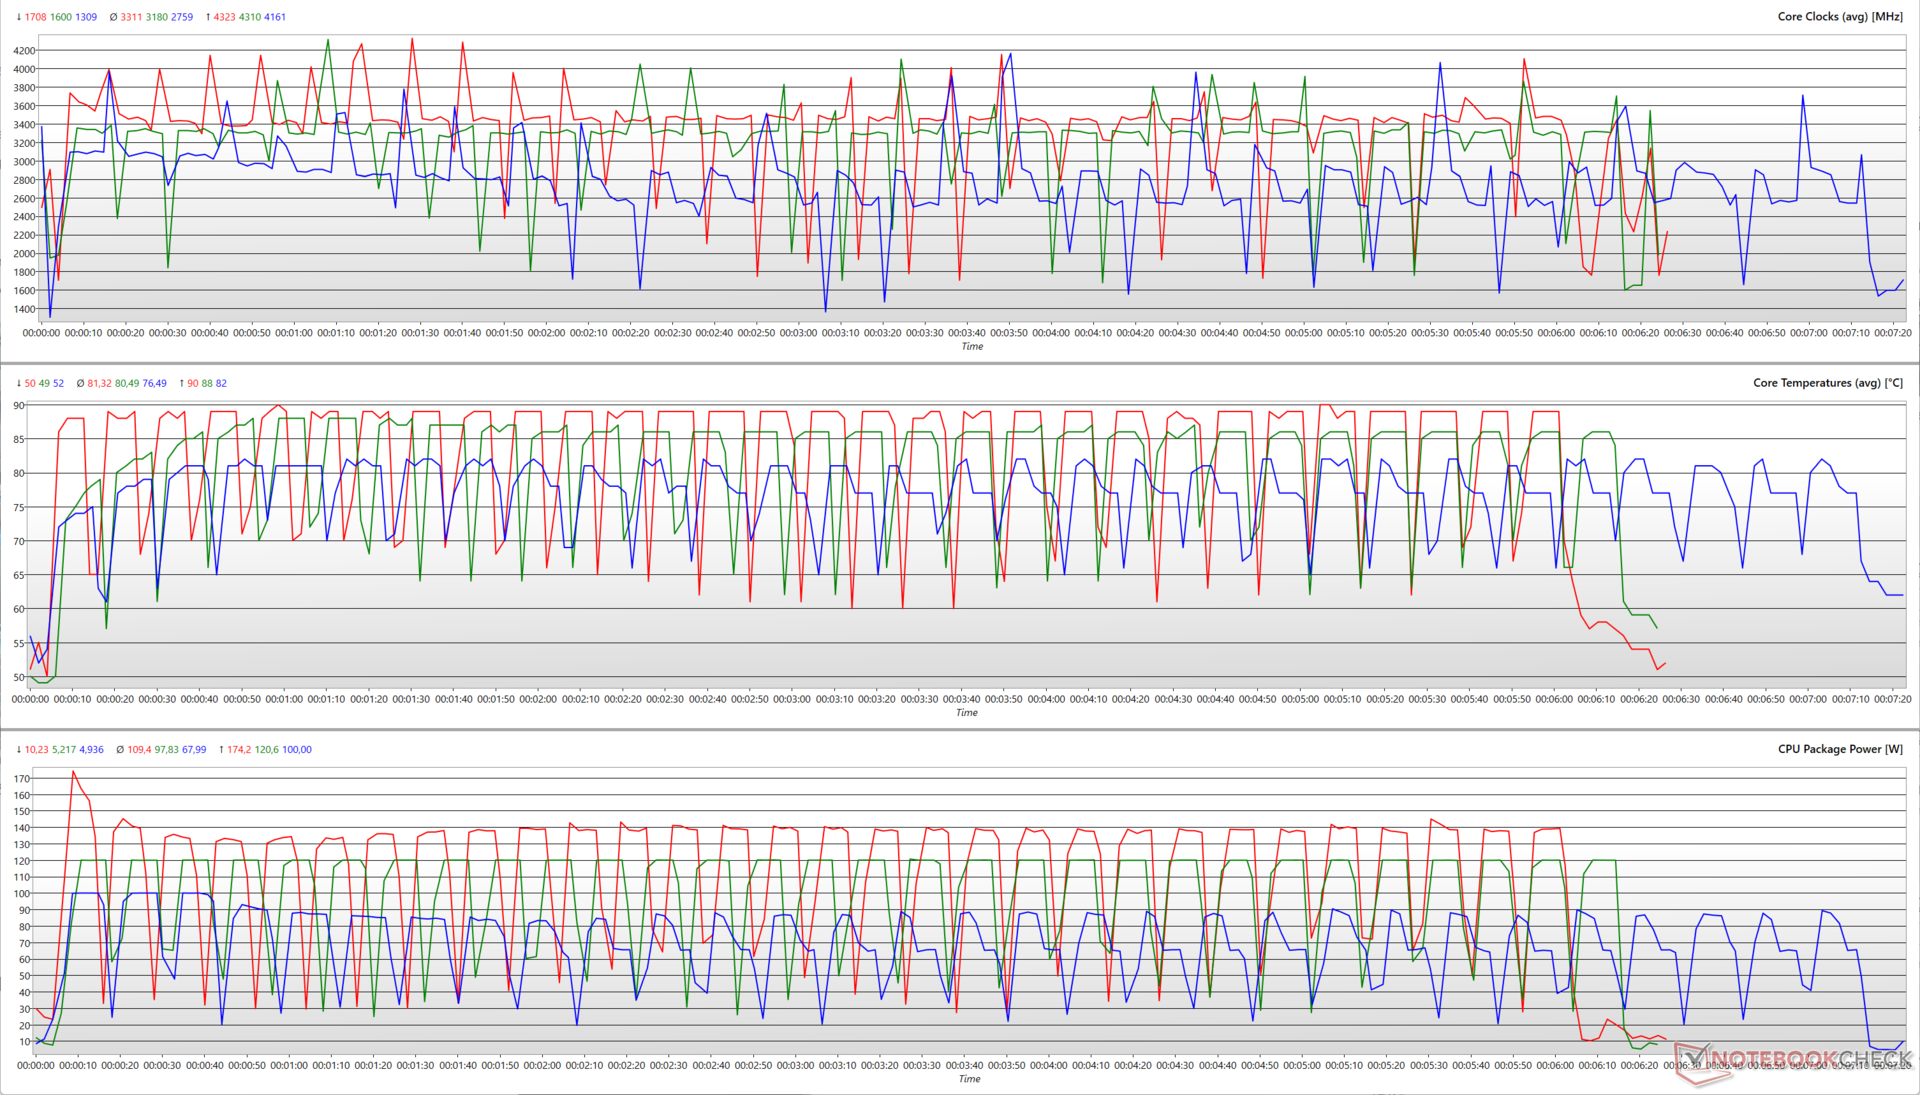
Running Cinebench R15 multi-core for 30 loops shows that the Core i9-14900HX is able to utilize the full PL2 limit allowed in each mode. In the Turbo profile, the Core i9-14900HX is able to attain 4.3 GHz boost at 174 W before settling at average clocks of 3.3 GHz at 109 W average.
However, the CPU is able to attain a similar clock at 120 W in the Performance mode as well while average clocks hover at 3.18 GHz at 97.8 W average package power.
Silent mode sees an average package power consumption of 68 W for average clocks of 2.76 GHz. The CPU is able to attain max boosts of 4.16 GHz at 100 W in this mode.
Cinebench R20 scores on battery power drop by 19.78% and 46.44% in single-core and multi-core, respectively.
AIDA64: FP32 Ray-Trace | FPU Julia | CPU SHA3 | CPU Queen | FPU SinJulia | FPU Mandel | CPU AES | CPU ZLib | FP64 Ray-Trace | CPU PhotoWorxx
| Performance Rating | |
| Asus ROG Strix Scar 17 G733PYV-LL053X | |
| MSI Vector 16 HX A14V | |
| Lenovo Legion Pro 7 16IRX9H | |
| Asus ROG Strix Scar 16 G634JZR | |
| Asus ROG Strix G16 G614JZ | |
| Average Intel Core i9-14900HX | |
| HP Omen 16 (2024) | |
| Average of class Gaming | |
| Alienware m16 R2 | |
| AIDA64 / FP32 Ray-Trace | |
| Asus ROG Strix Scar 17 G733PYV-LL053X | |
| MSI Vector 16 HX A14V | |
| Lenovo Legion Pro 7 16IRX9H | |
| Asus ROG Strix G16 G614JZ | |
| Asus ROG Strix Scar 16 G634JZR | |
| Average Intel Core i9-14900HX (17244 - 29351, n=22) | |
| Average of class Gaming (3069 - 60169, n=226, last 2 years) | |
| Alienware m16 R2 | |
| HP Omen 16 (2024) | |
| AIDA64 / FPU Julia | |
| Asus ROG Strix Scar 17 G733PYV-LL053X | |
| MSI Vector 16 HX A14V | |
| Lenovo Legion Pro 7 16IRX9H | |
| Asus ROG Strix G16 G614JZ | |
| Average Intel Core i9-14900HX (88537 - 148888, n=22) | |
| Asus ROG Strix Scar 16 G634JZR | |
| Average of class Gaming (18567 - 252486, n=226, last 2 years) | |
| Alienware m16 R2 | |
| HP Omen 16 (2024) | |
| AIDA64 / CPU SHA3 | |
| Asus ROG Strix Scar 17 G733PYV-LL053X | |
| Lenovo Legion Pro 7 16IRX9H | |
| MSI Vector 16 HX A14V | |
| Asus ROG Strix Scar 16 G634JZR | |
| Asus ROG Strix G16 G614JZ | |
| Average Intel Core i9-14900HX (4267 - 7229, n=22) | |
| HP Omen 16 (2024) | |
| Average of class Gaming (629 - 10389, n=226, last 2 years) | |
| Alienware m16 R2 | |
| AIDA64 / CPU Queen | |
| Asus ROG Strix Scar 17 G733PYV-LL053X | |
| Asus ROG Strix Scar 16 G634JZR | |
| Lenovo Legion Pro 7 16IRX9H | |
| Asus ROG Strix G16 G614JZ | |
| MSI Vector 16 HX A14V | |
| Average Intel Core i9-14900HX (118405 - 148773, n=22) | |
| HP Omen 16 (2024) | |
| Average of class Gaming (15371 - 200651, n=226, last 2 years) | |
| Alienware m16 R2 | |
| AIDA64 / FPU SinJulia | |
| Asus ROG Strix Scar 17 G733PYV-LL053X | |
| Asus ROG Strix G16 G614JZ | |
| Lenovo Legion Pro 7 16IRX9H | |
| MSI Vector 16 HX A14V | |
| Asus ROG Strix Scar 16 G634JZR | |
| Average Intel Core i9-14900HX (12217 - 18256, n=22) | |
| HP Omen 16 (2024) | |
| Average of class Gaming (2137 - 32988, n=226, last 2 years) | |
| Alienware m16 R2 | |
| AIDA64 / FPU Mandel | |
| Asus ROG Strix Scar 17 G733PYV-LL053X | |
| MSI Vector 16 HX A14V | |
| Lenovo Legion Pro 7 16IRX9H | |
| Asus ROG Strix G16 G614JZ | |
| Asus ROG Strix Scar 16 G634JZR | |
| Average Intel Core i9-14900HX (43302 - 72594, n=22) | |
| Average of class Gaming (10291 - 134044, n=226, last 2 years) | |
| Alienware m16 R2 | |
| HP Omen 16 (2024) | |
| AIDA64 / CPU AES | |
| Asus ROG Strix Scar 17 G733PYV-LL053X | |
| Asus ROG Strix Scar 16 G634JZR | |
| Average Intel Core i9-14900HX (86964 - 241777, n=22) | |
| Lenovo Legion Pro 7 16IRX9H | |
| MSI Vector 16 HX A14V | |
| Asus ROG Strix G16 G614JZ | |
| Average of class Gaming (19065 - 328679, n=226, last 2 years) | |
| HP Omen 16 (2024) | |
| Alienware m16 R2 | |
| AIDA64 / CPU ZLib | |
| Lenovo Legion Pro 7 16IRX9H | |
| MSI Vector 16 HX A14V | |
| Asus ROG Strix Scar 17 G733PYV-LL053X | |
| Asus ROG Strix G16 G614JZ | |
| Asus ROG Strix Scar 16 G634JZR | |
| Average Intel Core i9-14900HX (1265 - 2149, n=22) | |
| HP Omen 16 (2024) | |
| Alienware m16 R2 | |
| Average of class Gaming (150.9 - 2409, n=226, last 2 years) | |
| AIDA64 / FP64 Ray-Trace | |
| Asus ROG Strix Scar 17 G733PYV-LL053X | |
| MSI Vector 16 HX A14V | |
| Lenovo Legion Pro 7 16IRX9H | |
| Asus ROG Strix G16 G614JZ | |
| Asus ROG Strix Scar 16 G634JZR | |
| Average Intel Core i9-14900HX (9170 - 16128, n=22) | |
| Average of class Gaming (1518 - 31796, n=226, last 2 years) | |
| Alienware m16 R2 | |
| HP Omen 16 (2024) | |
| AIDA64 / CPU PhotoWorxx | |
| Asus ROG Strix Scar 16 G634JZR | |
| HP Omen 16 (2024) | |
| MSI Vector 16 HX A14V | |
| Average Intel Core i9-14900HX (33960 - 51118, n=22) | |
| Lenovo Legion Pro 7 16IRX9H | |
| Alienware m16 R2 | |
| Asus ROG Strix G16 G614JZ | |
| Average of class Gaming (10805 - 60161, n=227, last 2 years) | |
| Asus ROG Strix Scar 17 G733PYV-LL053X | |
More information and performance comparisons can be found in our dedicated Intel Core i9-14900HX page.
System Performance
The Scar 16 somewhat trails behind the Lenovo Legion Pro 7 in PCMark 10 and CrossMark tests. That being said, the laptop is quite responsive for everyday tasks, and there aren't too many workloads that can bottleneck its performance.
CrossMark: Overall | Productivity | Creativity | Responsiveness
AIDA64: Memory Copy | Memory Read | Memory Write | Memory Latency
WebXPRT 3: Overall
WebXPRT 4: Overall
Mozilla Kraken 1.1: Total
| PCMark 10 / Score | |
| Asus ROG Strix Scar 17 G733PYV-LL053X | |
| Lenovo Legion Pro 7 16IRX9H | |
| HP Omen 16 (2024) | |
| MSI Vector 16 HX A14V | |
| Average Intel Core i9-14900HX, NVIDIA GeForce RTX 4080 Laptop GPU (7703 - 8923, n=4) | |
| Alienware m16 R2 | |
| Asus ROG Strix Scar 16 G634JZR | |
| Average of class Gaming (5235 - 9852, n=199, last 2 years) | |
| Asus ROG Strix G16 G614JZ | |
| PCMark 10 / Essentials | |
| Asus ROG Strix G16 G614JZ | |
| Lenovo Legion Pro 7 16IRX9H | |
| Asus ROG Strix Scar 16 G634JZR | |
| Asus ROG Strix Scar 17 G733PYV-LL053X | |
| Average Intel Core i9-14900HX, NVIDIA GeForce RTX 4080 Laptop GPU (11255 - 11706, n=4) | |
| MSI Vector 16 HX A14V | |
| HP Omen 16 (2024) | |
| Average of class Gaming (8300 - 12334, n=198, last 2 years) | |
| Alienware m16 R2 | |
| PCMark 10 / Productivity | |
| HP Omen 16 (2024) | |
| Lenovo Legion Pro 7 16IRX9H | |
| Asus ROG Strix Scar 17 G733PYV-LL053X | |
| MSI Vector 16 HX A14V | |
| Average Intel Core i9-14900HX, NVIDIA GeForce RTX 4080 Laptop GPU (6662 - 11410, n=4) | |
| Average of class Gaming (6662 - 11833, n=198, last 2 years) | |
| Alienware m16 R2 | |
| Asus ROG Strix G16 G614JZ | |
| Asus ROG Strix Scar 16 G634JZR | |
| PCMark 10 / Digital Content Creation | |
| Asus ROG Strix Scar 17 G733PYV-LL053X | |
| Asus ROG Strix Scar 16 G634JZR | |
| MSI Vector 16 HX A14V | |
| Average Intel Core i9-14900HX, NVIDIA GeForce RTX 4080 Laptop GPU (14466 - 16027, n=4) | |
| HP Omen 16 (2024) | |
| Lenovo Legion Pro 7 16IRX9H | |
| Alienware m16 R2 | |
| Average of class Gaming (6462 - 18475, n=198, last 2 years) | |
| Asus ROG Strix G16 G614JZ | |
| CrossMark / Overall | |
| Lenovo Legion Pro 7 16IRX9H | |
| HP Omen 16 (2024) | |
| Average Intel Core i9-14900HX, NVIDIA GeForce RTX 4080 Laptop GPU (2037 - 2334, n=4) | |
| MSI Vector 16 HX A14V | |
| Asus ROG Strix G16 G614JZ | |
| Asus ROG Strix Scar 17 G733PYV-LL053X | |
| Asus ROG Strix Scar 16 G634JZR | |
| Average of class Gaming (1247 - 2334, n=171, last 2 years) | |
| Alienware m16 R2 | |
| CrossMark / Productivity | |
| Lenovo Legion Pro 7 16IRX9H | |
| HP Omen 16 (2024) | |
| Average Intel Core i9-14900HX, NVIDIA GeForce RTX 4080 Laptop GPU (1874 - 2204, n=4) | |
| Asus ROG Strix G16 G614JZ | |
| MSI Vector 16 HX A14V | |
| Asus ROG Strix Scar 17 G733PYV-LL053X | |
| Asus ROG Strix Scar 16 G634JZR | |
| Average of class Gaming (1299 - 2204, n=171, last 2 years) | |
| Alienware m16 R2 | |
| CrossMark / Creativity | |
| Lenovo Legion Pro 7 16IRX9H | |
| MSI Vector 16 HX A14V | |
| Asus ROG Strix Scar 17 G733PYV-LL053X | |
| Average Intel Core i9-14900HX, NVIDIA GeForce RTX 4080 Laptop GPU (2327 - 2500, n=4) | |
| Asus ROG Strix G16 G614JZ | |
| HP Omen 16 (2024) | |
| Asus ROG Strix Scar 16 G634JZR | |
| Average of class Gaming (1275 - 2514, n=171, last 2 years) | |
| Alienware m16 R2 | |
| CrossMark / Responsiveness | |
| Lenovo Legion Pro 7 16IRX9H | |
| HP Omen 16 (2024) | |
| Average Intel Core i9-14900HX, NVIDIA GeForce RTX 4080 Laptop GPU (1756 - 2254, n=4) | |
| Asus ROG Strix G16 G614JZ | |
| MSI Vector 16 HX A14V | |
| Asus ROG Strix Scar 16 G634JZR | |
| Average of class Gaming (1030 - 2330, n=171, last 2 years) | |
| Asus ROG Strix Scar 17 G733PYV-LL053X | |
| Alienware m16 R2 | |
| AIDA64 / Memory Copy | |
| HP Omen 16 (2024) | |
| Asus ROG Strix Scar 16 G634JZR | |
| Average Intel Core i9-14900HX, NVIDIA GeForce RTX 4080 Laptop GPU (78053 - 79244, n=5) | |
| Lenovo Legion Pro 7 16IRX9H | |
| MSI Vector 16 HX A14V | |
| Alienware m16 R2 | |
| Asus ROG Strix G16 G614JZ | |
| Average of class Gaming (21842 - 92565, n=226, last 2 years) | |
| Asus ROG Strix Scar 17 G733PYV-LL053X | |
| AIDA64 / Memory Read | |
| Asus ROG Strix Scar 16 G634JZR | |
| HP Omen 16 (2024) | |
| Average Intel Core i9-14900HX, NVIDIA GeForce RTX 4080 Laptop GPU (85898 - 87507, n=5) | |
| Lenovo Legion Pro 7 16IRX9H | |
| MSI Vector 16 HX A14V | |
| Alienware m16 R2 | |
| Asus ROG Strix G16 G614JZ | |
| Average of class Gaming (24879 - 90647, n=226, last 2 years) | |
| Asus ROG Strix Scar 17 G733PYV-LL053X | |
| AIDA64 / Memory Write | |
| HP Omen 16 (2024) | |
| Asus ROG Strix Scar 16 G634JZR | |
| MSI Vector 16 HX A14V | |
| Average Intel Core i9-14900HX, NVIDIA GeForce RTX 4080 Laptop GPU (71763 - 77715, n=5) | |
| Lenovo Legion Pro 7 16IRX9H | |
| Alienware m16 R2 | |
| Average of class Gaming (21619 - 103259, n=226, last 2 years) | |
| Asus ROG Strix G16 G614JZ | |
| Asus ROG Strix Scar 17 G733PYV-LL053X | |
| AIDA64 / Memory Latency | |
| Alienware m16 R2 | |
| Asus ROG Strix Scar 17 G733PYV-LL053X | |
| Asus ROG Strix G16 G614JZ | |
| Average of class Gaming (59.5 - 152.5, n=223, last 2 years) | |
| HP Omen 16 (2024) | |
| Average Intel Core i9-14900HX, NVIDIA GeForce RTX 4080 Laptop GPU (79.7 - 84.6, n=5) | |
| MSI Vector 16 HX A14V | |
| Asus ROG Strix Scar 16 G634JZR | |
| Lenovo Legion Pro 7 16IRX9H | |
| WebXPRT 3 / Overall | |
| Asus ROG Strix Scar 17 G733PYV-LL053X | |
| Lenovo Legion Pro 7 16IRX9H | |
| Asus ROG Strix G16 G614JZ | |
| Average Intel Core i9-14900HX, NVIDIA GeForce RTX 4080 Laptop GPU (310 - 345, n=4) | |
| HP Omen 16 (2024) | |
| MSI Vector 16 HX A14V | |
| Asus ROG Strix Scar 16 G634JZR | |
| Average of class Gaming (215 - 480, n=195, last 2 years) | |
| Alienware m16 R2 | |
| WebXPRT 4 / Overall | |
| Asus ROG Strix Scar 17 G733PYV-LL053X | |
| Lenovo Legion Pro 7 16IRX9H | |
| Asus ROG Strix G16 G614JZ | |
| HP Omen 16 (2024) | |
| Asus ROG Strix Scar 16 G634JZR | |
| Average Intel Core i9-14900HX, NVIDIA GeForce RTX 4080 Laptop GPU (300 - 316, n=4) | |
| MSI Vector 16 HX A14V | |
| Average of class Gaming (157.9 - 328, n=163, last 2 years) | |
| Alienware m16 R2 | |
| Mozilla Kraken 1.1 / Total | |
| Alienware m16 R2 | |
| Average of class Gaming (421 - 824, n=210, last 2 years) | |
| Asus ROG Strix G16 G614JZ | |
| MSI Vector 16 HX A14V | |
| Asus ROG Strix Scar 16 G634JZR | |
| Average Intel Core i9-14900HX, NVIDIA GeForce RTX 4080 Laptop GPU (437 - 443, n=4) | |
| Lenovo Legion Pro 7 16IRX9H | |
| HP Omen 16 (2024) | |
| Asus ROG Strix Scar 17 G733PYV-LL053X | |
* ... smaller is better
| PCMark 8 Home Score Accelerated v2 | 5883 points | |
| PCMark 10 Score | 7703 points | |
Help | ||
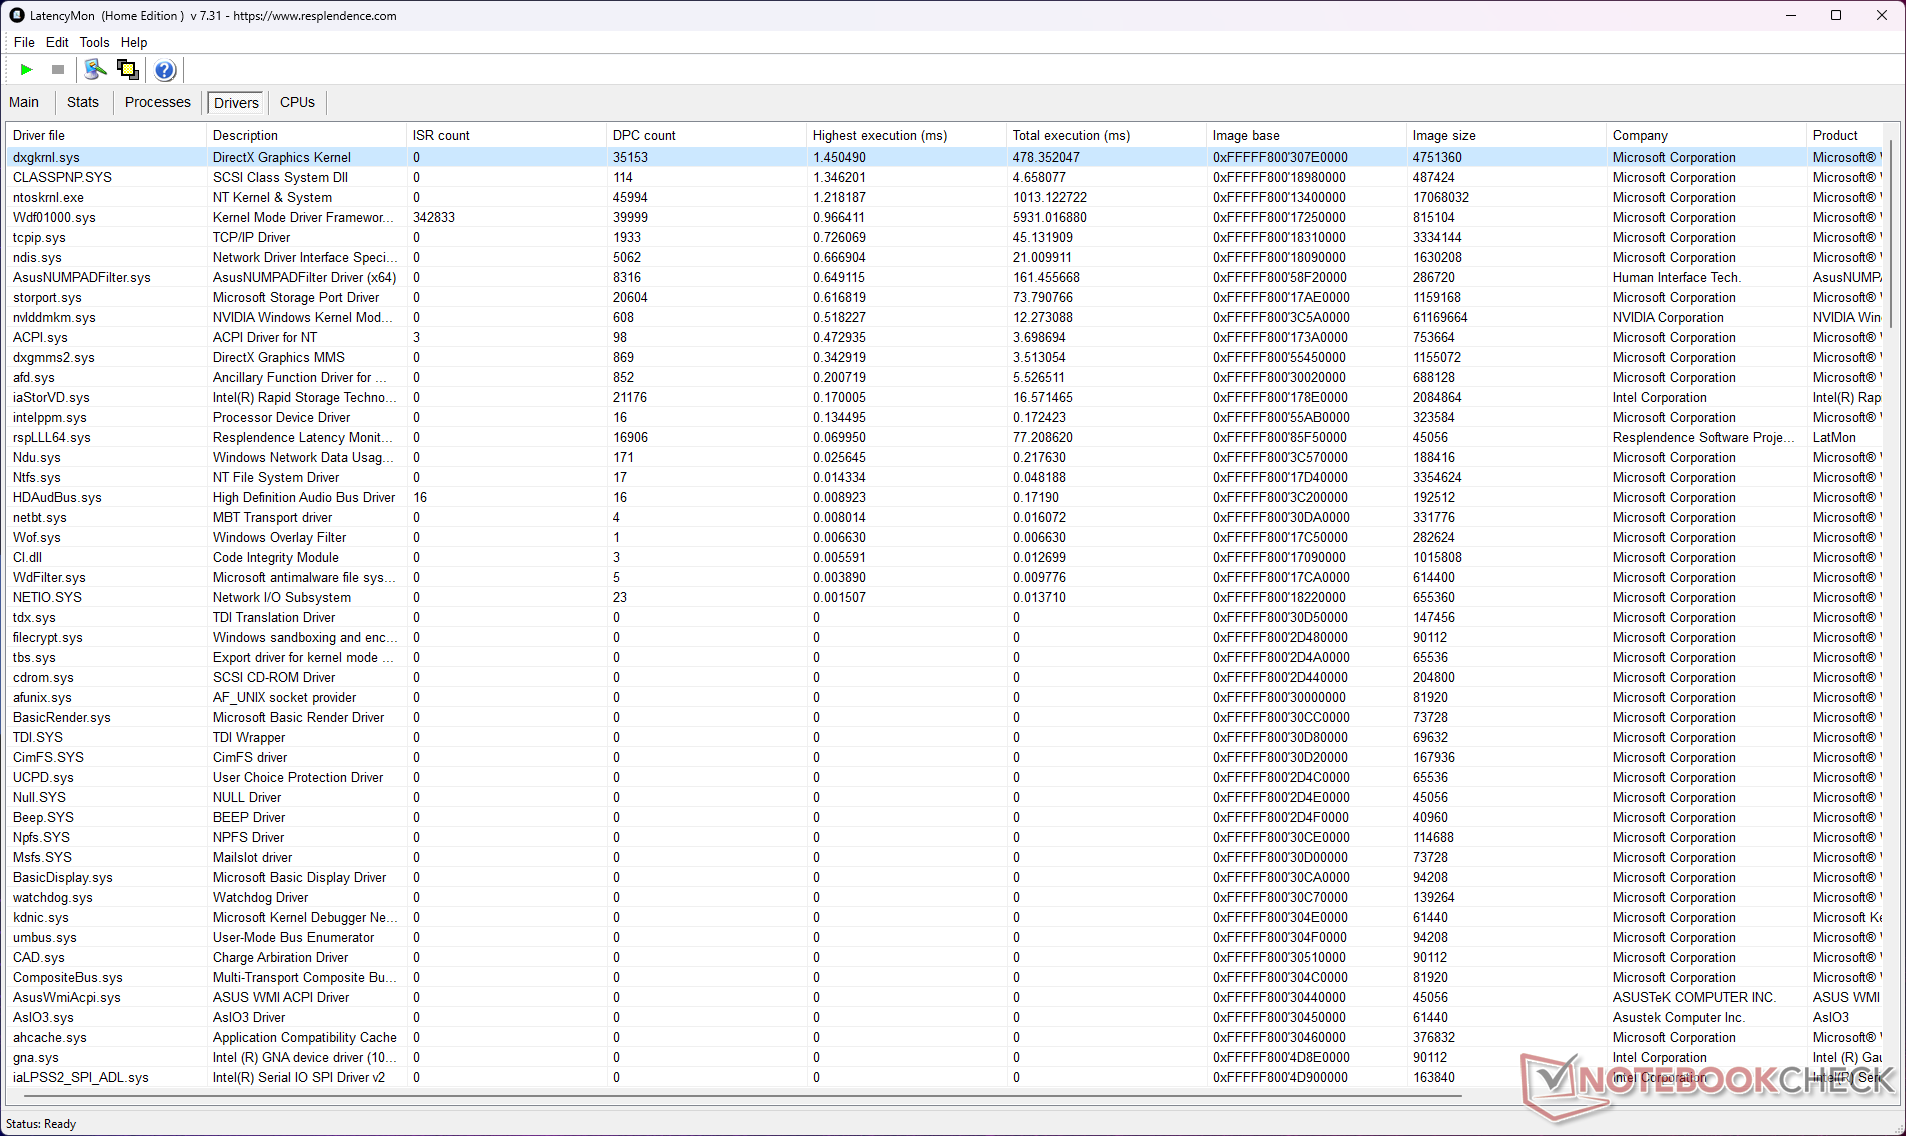
DPC Latency
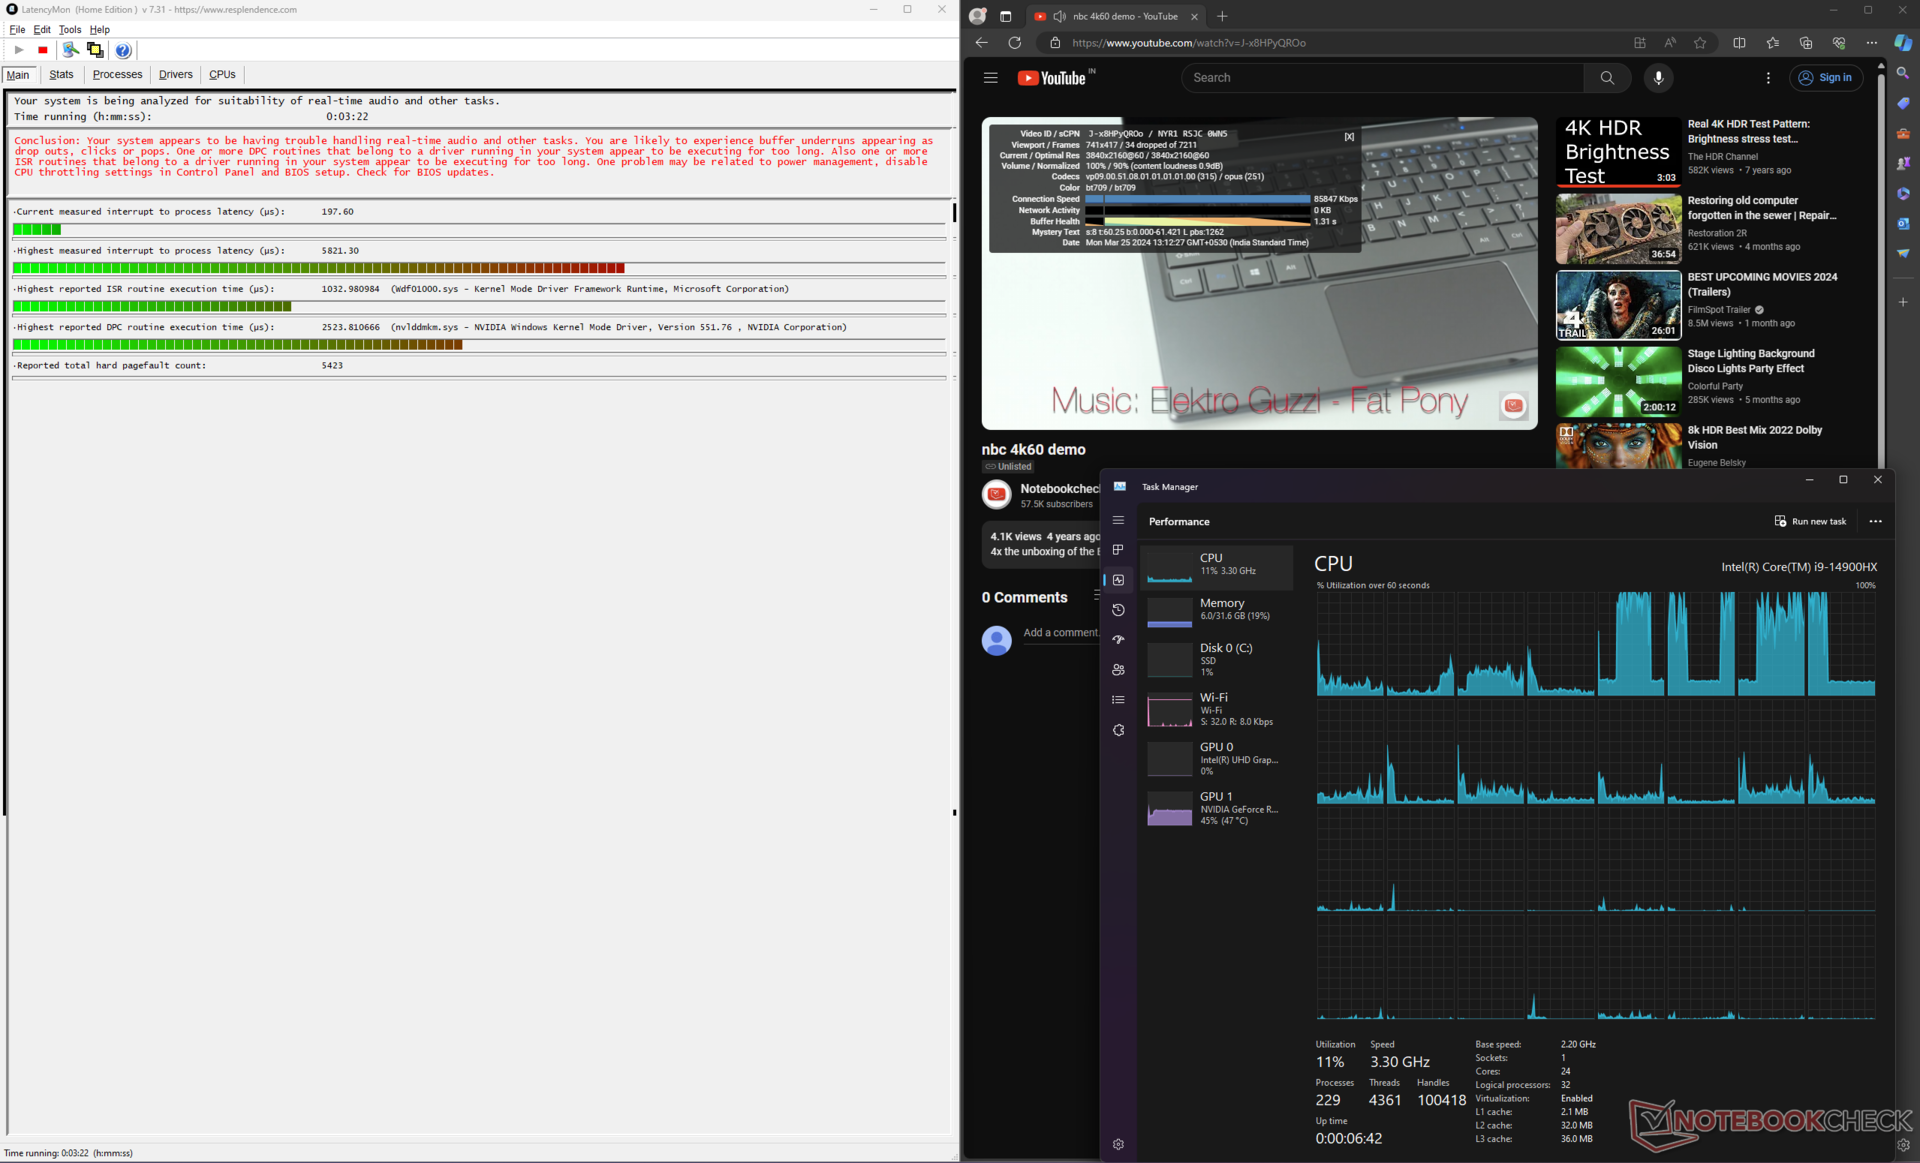
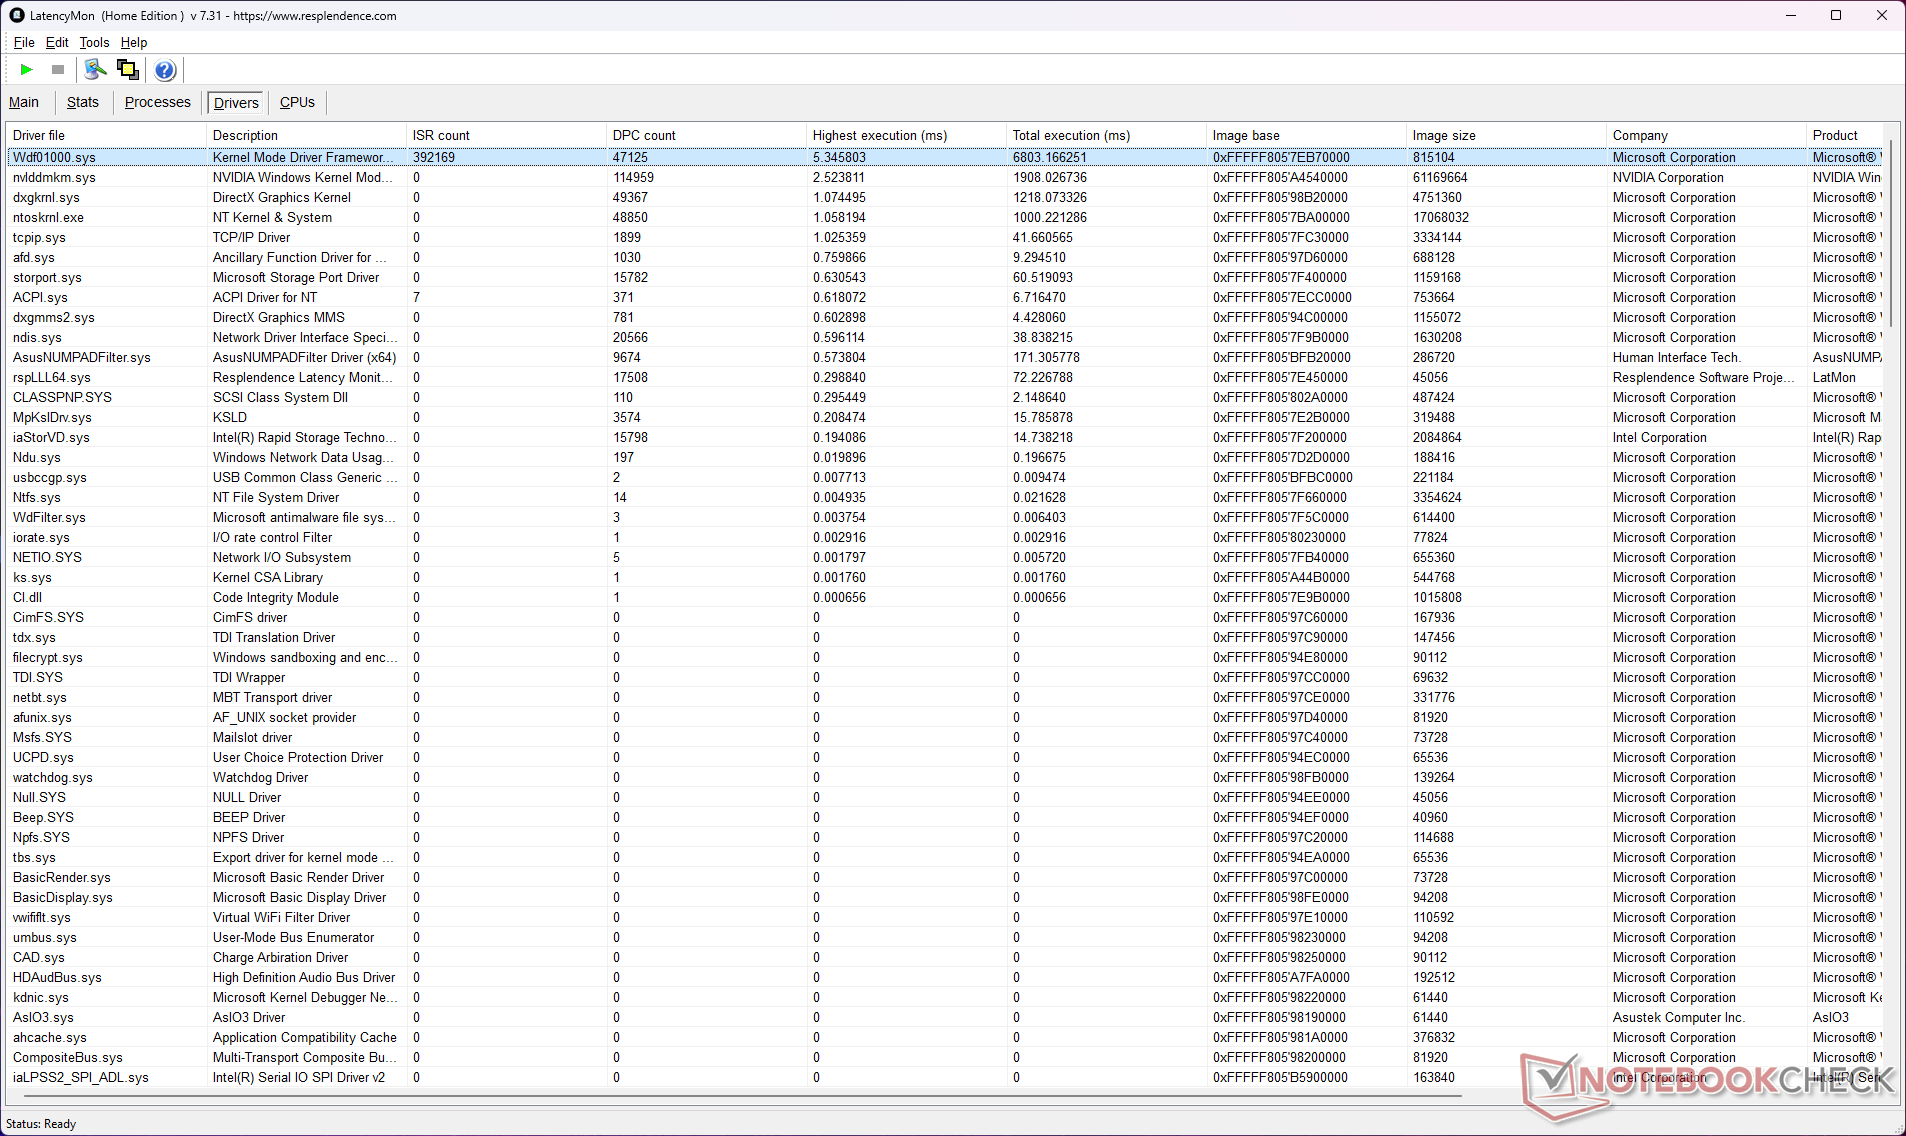
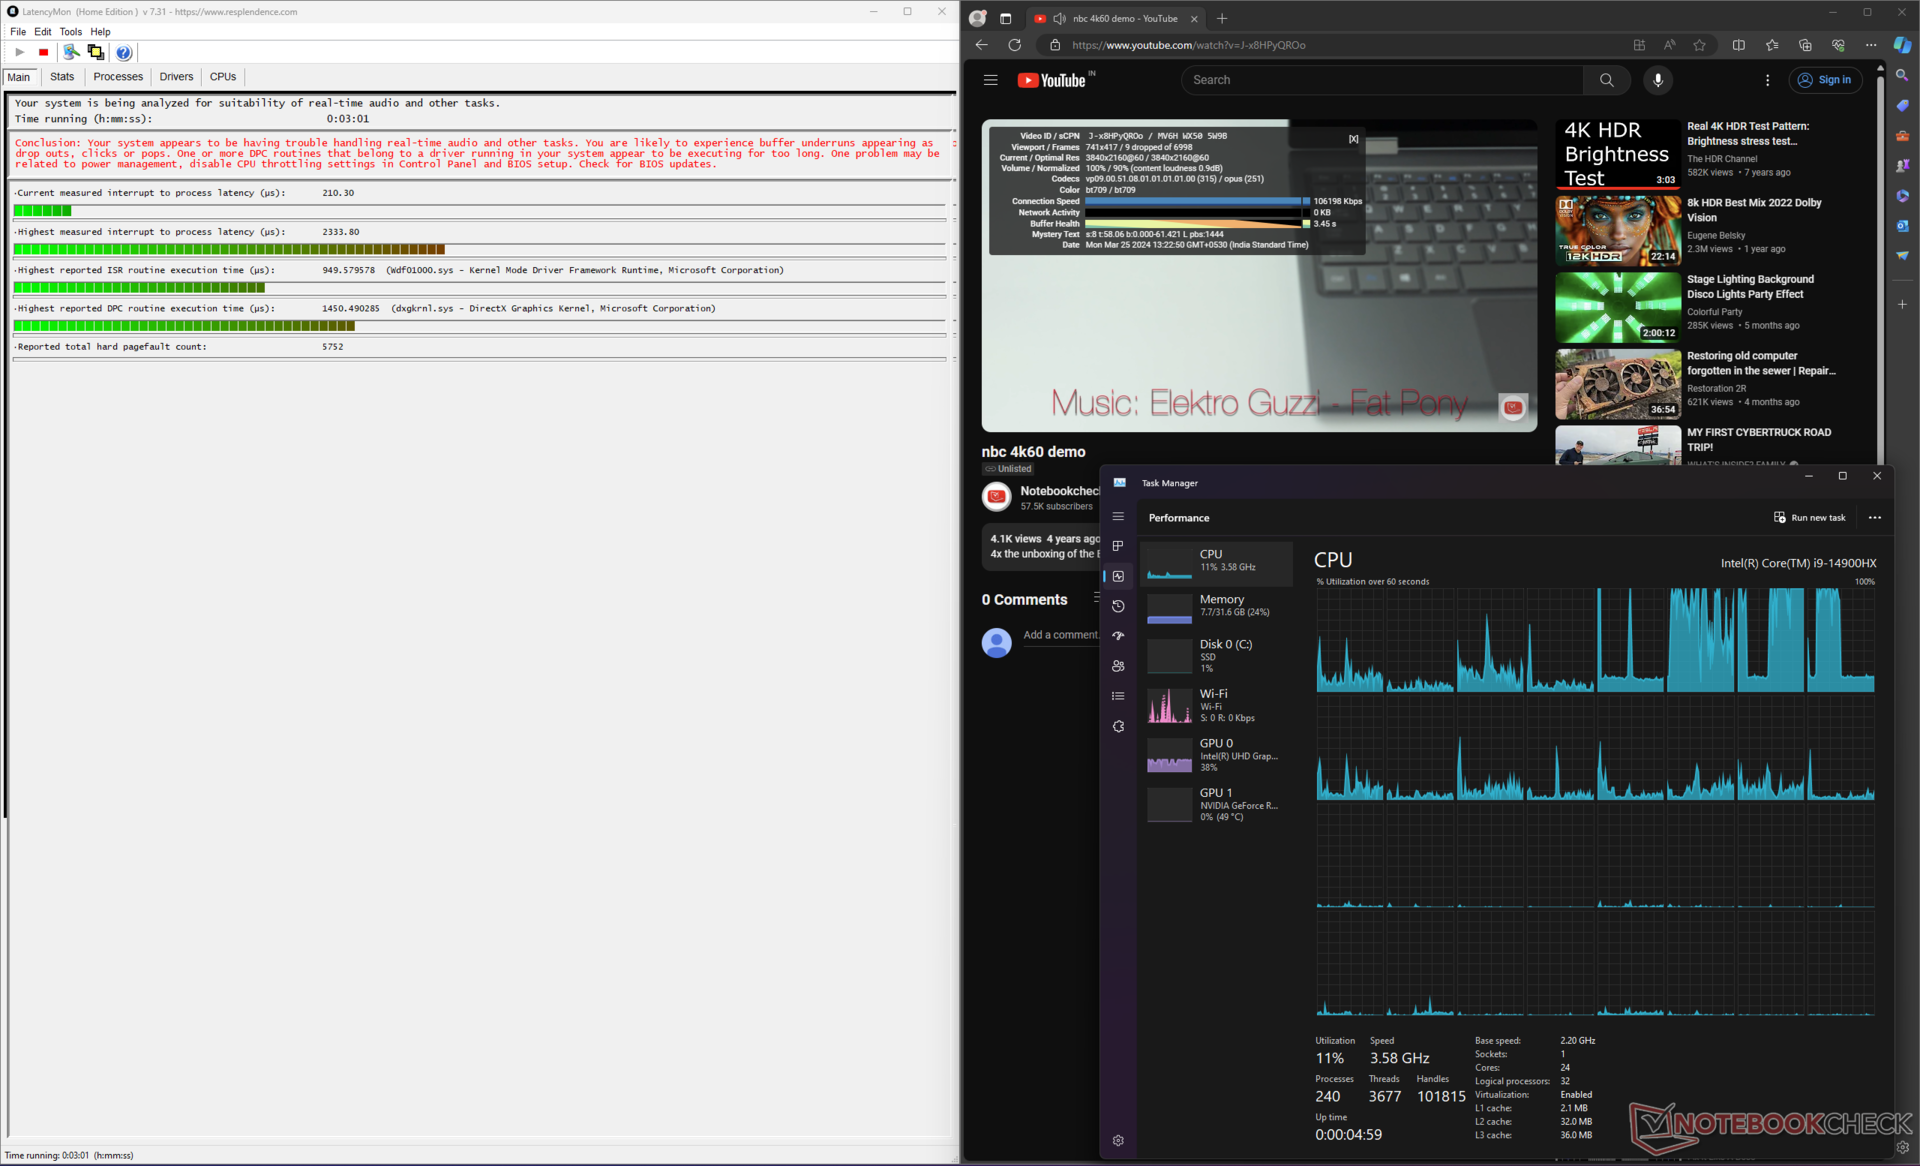
DPC latency is on the higher side with the dGPU MUX enabled. Switching over to the iGPU reduces the latency from 5821.30 µs to 2333.80 µs, which is still a high value. This can pose issues if you are into real-time audio or video editing workflows.
| DPC Latencies / LatencyMon - interrupt to process latency (max), Web, Youtube, Prime95 | |
| Asus ROG Strix Scar 16 G634JZR | |
| Asus ROG Strix G16 G614JZ | |
| Alienware m16 R2 | |
| MSI Vector 16 HX A14V | |
| Lenovo Legion Pro 7 16IRX9H | |
| HP Omen 16 (2024) | |
| Asus ROG Strix Scar 17 G733PYV-LL053X | |
* ... smaller is better
Our DPC Latency Ranking page provides an overview of measured latencies across reviewed devices.
Storage Devices
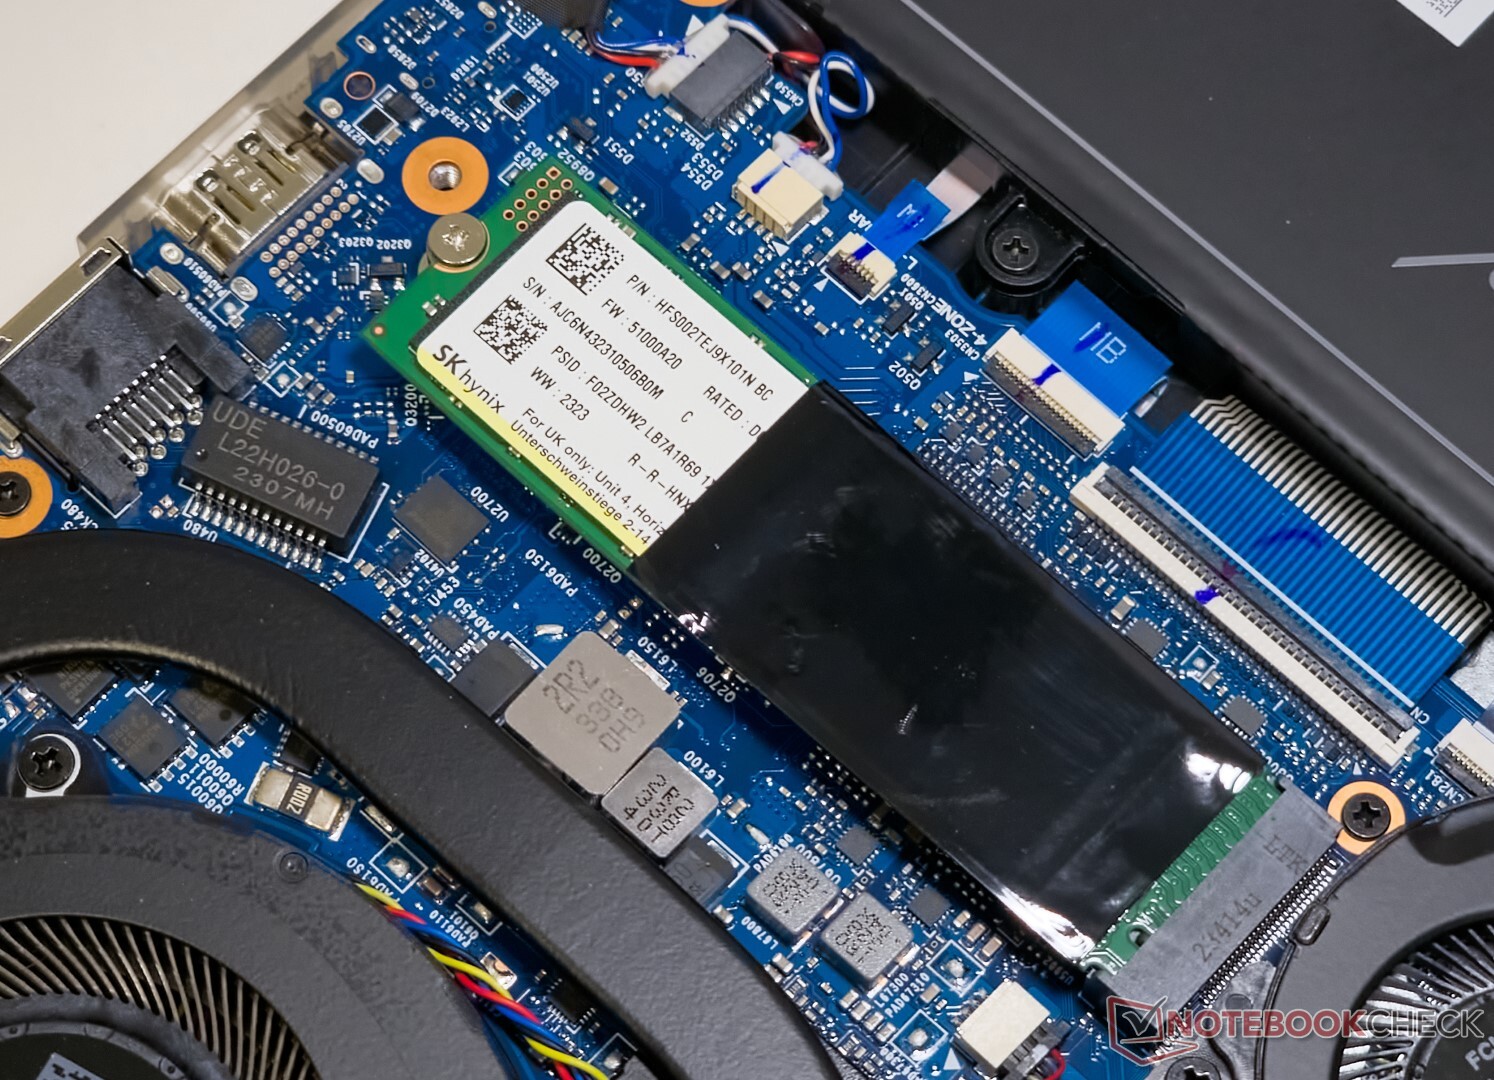
Our Scar 16 unit came equipped with an Sk hynix PC801 2 TB PCIe Gen 4 NVMe SSD.
The SSD's performance takes a beating in sequential reads and several 4k tests, but the cumulative performance is within reach of the Alienware m16 R2's Samsung PM9A1.
Additional storage can be added via an expansion slot for another M.2 SSD. However, there is no provision for installing 2.5-inch SATA drives.

* ... smaller is better
Disk Throttling: DiskSpd Read Loop, Queue Depth 8
Drive performance drops after the 14th run during a DiskSpd read loop test at a queue depth of 8 but remains stable thereon.
More storage performance comparisons can be found in our SSD and HDD benchmarks page.
GPU Performance
The Scar 16 is equipped with a 175 W Nvidia GeForce RTX 4080 Laptop GPU. Overall 3DMark performance is comparable to other laptops featuring this card while trailing the Lenovo Legion Pro 7 by 6%.
The HP Omen 16 with a 140 W RTX 4080 Laptop GPU takes a larger than expected 24% setback against the Strix Scar 16 in cumulative 3DMark performance.
The Scar 16's RTX 4080 puts it just behind the Asus ROG Strix Scar 17 with an RTX 4090 Laptop GPU in Blender Classroom Optix, albeit by a 15% margin — this increases to 18% in Blender Classroom CUDA.
Blender Classroom CPU, on the other hand, sees the Scar 16's Core i9-14900HX being on par with that of the Legion Pro 7 and Vector 16 HX, but the Scar 17's AMD Ryzen 9 7945HX3D is able to finish the render 20% faster.
| 3DMark 11 Performance | 42772 points | |
| 3DMark Ice Storm Standard Score | 284572 points | |
| 3DMark Cloud Gate Standard Score | 64579 points | |
| 3DMark Fire Strike Score | 32183 points | |
| 3DMark Fire Strike Extreme Score | 21288 points | |
| 3DMark Time Spy Score | 18822 points | |
Help | ||
| Blender / v3.3 Classroom OPTIX/RTX | |
| Average of class Gaming (9 - 142, n=182, last 2 years) | |
| Alienware m16 R2 | |
| HP Omen 16 (2024) | |
| Average NVIDIA GeForce RTX 4080 Laptop GPU (13 - 20, n=18) | |
| Asus ROG Strix G16 G614JZ | |
| MSI Vector 16 HX A14V | |
| Lenovo Legion Pro 7 16IRX9H | |
| Asus ROG Strix Scar 16 G634JZR | |
| Asus ROG Strix Scar 17 G733PYV-LL053X | |
| Blender / v3.3 Classroom CUDA | |
| Average of class Gaming (16 - 175, n=189, last 2 years) | |
| Alienware m16 R2 | |
| HP Omen 16 (2024) | |
| Average NVIDIA GeForce RTX 4080 Laptop GPU (21 - 28, n=19) | |
| Asus ROG Strix G16 G614JZ | |
| MSI Vector 16 HX A14V | |
| Asus ROG Strix Scar 16 G634JZR | |
| Lenovo Legion Pro 7 16IRX9H | |
| Asus ROG Strix Scar 17 G733PYV-LL053X | |
| Blender / v3.3 Classroom CPU | |
| Average of class Gaming (138 - 962, n=202, last 2 years) | |
| Alienware m16 R2 | |
| HP Omen 16 (2024) | |
| Average NVIDIA GeForce RTX 4080 Laptop GPU (177 - 337, n=19) | |
| Asus ROG Strix G16 G614JZ | |
| Asus ROG Strix Scar 16 G634JZR | |
| Lenovo Legion Pro 7 16IRX9H | |
| MSI Vector 16 HX A14V | |
| Asus ROG Strix Scar 17 G733PYV-LL053X | |
* ... smaller is better
Gaming Performance
The performance delta between the Legion Pro 7 and the Strix Scar 16 disappears in cumulative 1080p Ultra gaming performance.
The Scar 16 can easily surpass the 100 fps mark in 1440p Ultra with older titles. The laptop can handle most modern AAA games at 60 fps in this resolution, and you can achieve even higher frame rates with a helping hand from upscalers.
| The Witcher 3 - 1920x1080 Ultra Graphics & Postprocessing (HBAO+) | |
| Asus ROG Strix Scar 17 G733PYV-LL053X | |
| Lenovo Legion Pro 7 16IRX9H | |
| Asus ROG Strix Scar 16 G634JZR | |
| MSI Vector 16 HX A14V | |
| Asus ROG Strix G16 G614JZ | |
| HP Omen 16 (2024) | |
| Alienware m16 R2 | |
| Average of class Gaming (8.61 - 216, n=228, last 2 years) | |
| GTA V - 1920x1080 Highest Settings possible AA:4xMSAA + FX AF:16x | |
| Asus ROG Strix Scar 17 G733PYV-LL053X | |
| Lenovo Legion Pro 7 16IRX9H | |
| Asus ROG Strix G16 G614JZ | |
| Asus ROG Strix Scar 16 G634JZR | |
| MSI Vector 16 HX A14V | |
| HP Omen 16 (2024) | |
| Average of class Gaming (6.38 - 167.7, n=219, last 2 years) | |
The Witcher 3 FPS Chart
The Scar 16's massive cooling system is able to ensure a relatively throttle-free gaming performance. We did not observe any drastic frame drops while stressing with The Witcher 3 at 1080p Ultra.
| low | med. | high | ultra | QHD | |
| GTA V (2015) | 187.3 | 187.1 | 182.6 | 139 | 130.1 |
| The Witcher 3 (2015) | 581 | 513 | 365 | 185.6 | 140.1 |
| Dota 2 Reborn (2015) | 247 | 216 | 192.7 | 177.4 | |
| Final Fantasy XV Benchmark (2018) | 228 | 207 | 178 | 138.1 | |
| X-Plane 11.11 (2018) | 211 | 184.3 | 141.3 | ||
| Far Cry 5 (2018) | 183 | 168 | 164 | 157 | 157 |
| Strange Brigade (2018) | 499 | 402 | 373 | 337 | 240 |
| F1 22 (2022) | 323 | 334 | 287 | 117.1 | 76.6 |
| F1 23 (2023) | 310 | 326 | 295 | 111.3 | 70 |
| Cyberpunk 2077 2.0 Phantom Liberty (2023) | 170.4 | 159.8 | 141.3 | 123.1 | 77.6 |
| Avatar Frontiers of Pandora (2023) | 141.4 | 131.6 | 115.2 | 88.3 | 59.3 |
| Skull & Bones (2024) | 155 | 168 | 144 | 115 | 91 |
Refer to our dedicated Nvidia GeForce RTX 4080 Laptop GPU page for more performance and gaming benchmarks.
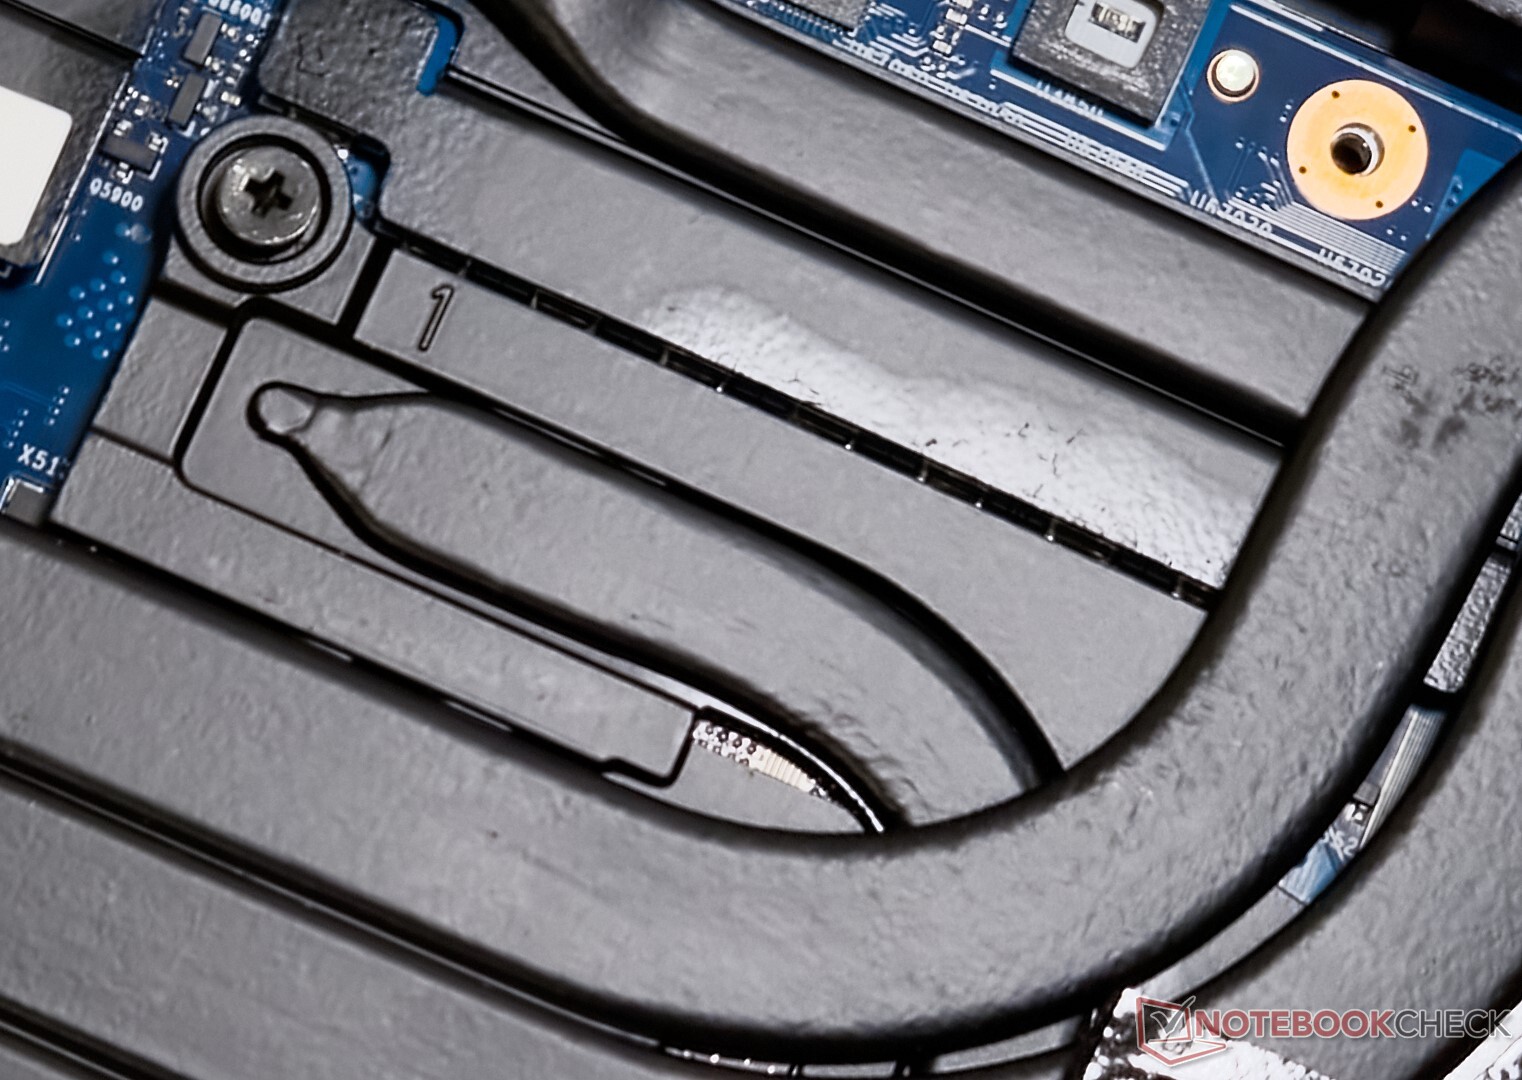
Emissions: High surface temps and noise despite 3 fans and 7 heatpipes
System Noise
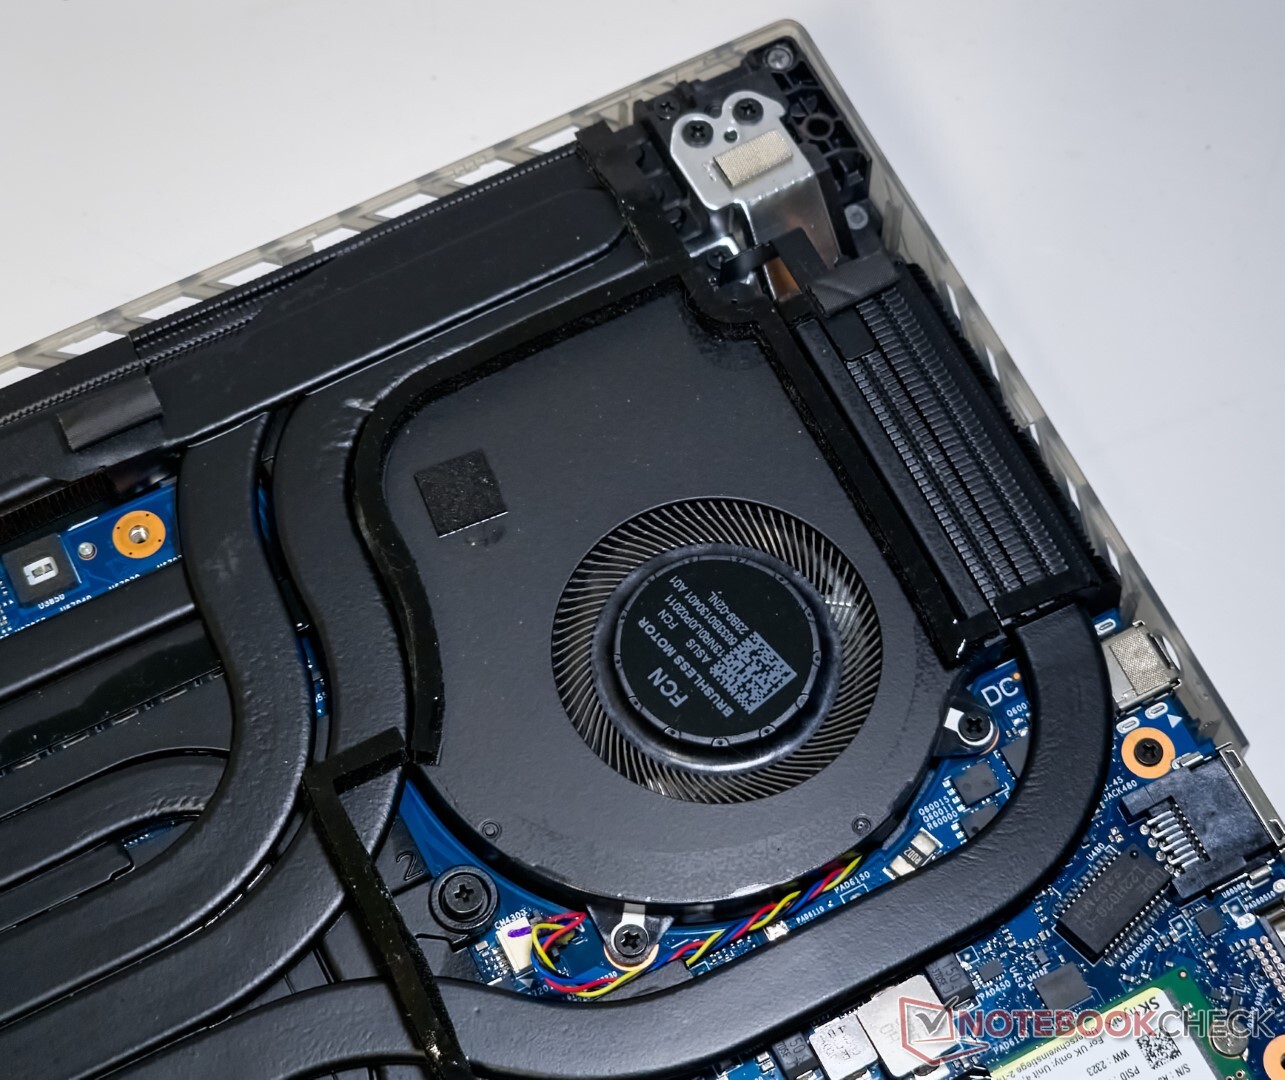
Asus, interestingly, includes a third fan on the VRAM in addition to the ones connected to the CPU and the GPU.
The Scar 16 doesn't seem to enforce any hard limits on noise emissions in each power profile. As a result, fan noise emissions in Turbo mode can be as high as 58 db(A) under maximum load.
The Performance mode also produces high noise emissions. Silent mode is comparatively more tolerable, but at the cost of a noticeable drop in gaming performance.
That being said, the fans are completely off in the Silent mode when idle and during less-intensive workloads such as Office or casual web browsing.
Noise Level
| Idle |
| 29.75 / 29.75 / 29.75 dB(A) |
| Load |
| 54.85 / 58 dB(A) |
 | ||
30 dB silent 40 dB(A) audible 50 dB(A) loud |
||
min: | ||
| Performance mode | Idle dB(A) | Load average dB(A) | Load maximum dB(A) | The Witcher 3 1080p Ultra dB(A) |
|---|---|---|---|---|
| Silent | 21.07 | 37.50 | 46.56 | 46.32 / 133 fps |
| Performance | 21.07 | 54.03 | 54.02 | 54.08 / 174 fps |
| Turbo | 29.75 | 54.85 | 58 | 57.75 / 177 fps |
| Asus ROG Strix Scar 16 G634JZR i9-14900HX, NVIDIA GeForce RTX 4080 Laptop GPU | Asus ROG Strix Scar 17 G733PYV-LL053X R9 7945HX3D, NVIDIA GeForce RTX 4090 Laptop GPU | Asus ROG Strix G16 G614JZ i9-13980HX, NVIDIA GeForce RTX 4080 Laptop GPU | Lenovo Legion Pro 7 16IRX9H i9-14900HX, NVIDIA GeForce RTX 4080 Laptop GPU | HP Omen 16 (2024) i9-14900HX, NVIDIA GeForce RTX 4080 Laptop GPU | MSI Vector 16 HX A14V i9-14900HX, NVIDIA GeForce RTX 4080 Laptop GPU | Alienware m16 R2 Ultra 7 155H, NVIDIA GeForce RTX 4070 Laptop GPU | |
|---|---|---|---|---|---|---|---|
| Noise | 3% | 5% | -4% | 5% | -8% | 10% | |
| off / environment * | 21.07 | 23 -9% | 25 -19% | 24 -14% | 25 -19% | 23.2 -10% | 24.7 -17% |
| Idle Minimum * | 29.75 | 23 23% | 26 13% | 25 16% | 29 3% | 33.5 -13% | 25.3 15% |
| Idle Average * | 29.75 | 27.7 7% | 28 6% | 30 -1% | 30 -1% | 33.5 -13% | 25.3 15% |
| Idle Maximum * | 29.75 | 34.7 -17% | 30 -1% | 45 -51% | 31 -4% | 33.5 -13% | 25.3 15% |
| Load Average * | 54.85 | 53.4 3% | 48 12% | 50 9% | 46 16% | 52.1 5% | 31.7 42% |
| Witcher 3 ultra * | 57.8 | 53.4 8% | 49 15% | 54 7% | 47 19% | 62 -7% | 53.8 7% |
| Load Maximum * | 58 | 53.4 8% | 52 10% | 56 3% | 47 19% | 62 -7% | 62 -7% |
* ... smaller is better
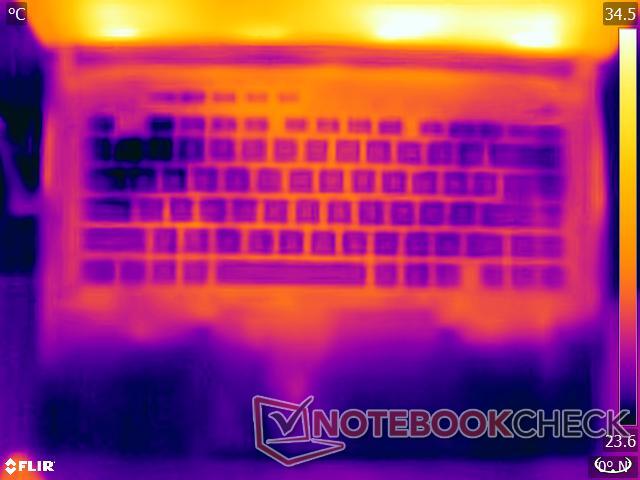
Temperature
The ROG Strix Scar 16 is equipped with seven heatpipes and a triple fan cooling system. This time, Asus has gone all out in using Conductonaut Extreme liquid metal for both the CPU and the GPU.
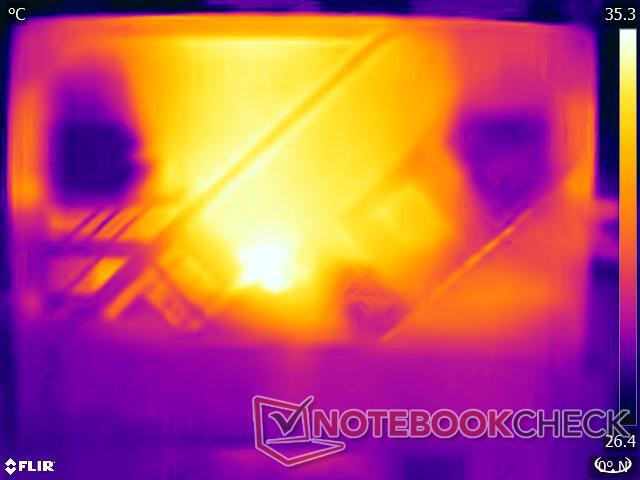
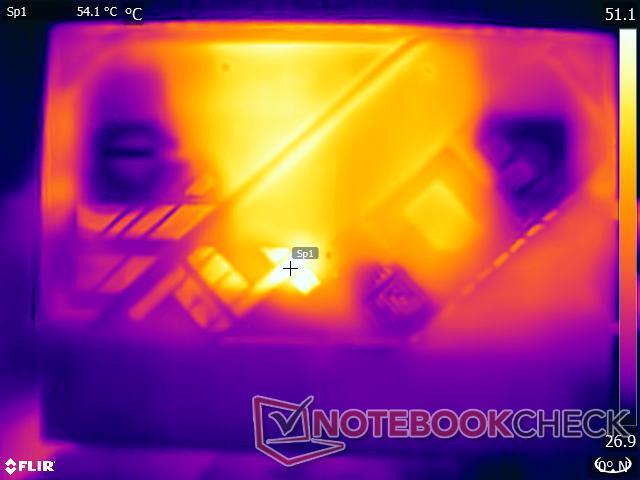
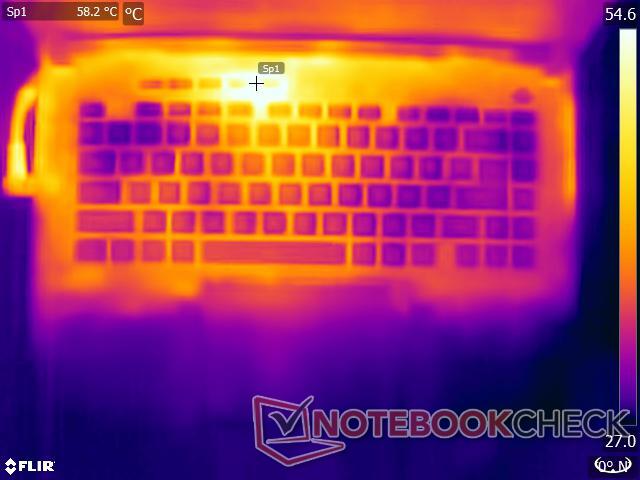
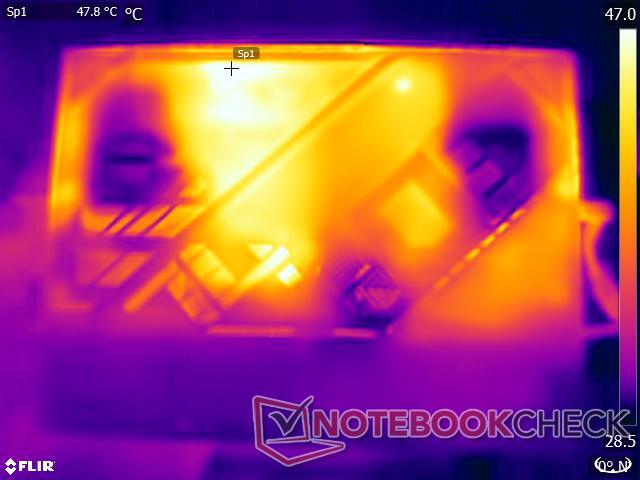
While the robust cooling apparatus and the presence of exhaust vents on three sides aid in effective component cooling, they also lead to higher heat dissipation as evidenced by high surface temperature readouts under load.
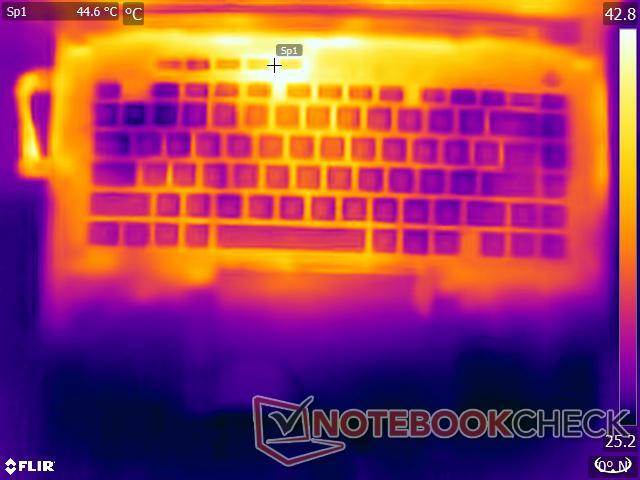
We noted a few hotspots above the 55 °C mark on the upper side during stress testing with The Witcher 3 at 1080p Ultra.
In practical terms, given its weight and surface temperatures, the Scar 16 serves better as a desk machine. That being said, the laptop shouldn't cause much discomfort while using on the lap in the Silent profile, provided it is not subjected to heavy workloads.
(-) The maximum temperature on the upper side is 47.8 °C / 118 F, compared to the average of 40.4 °C / 105 F, ranging from 21.2 to 68.8 °C for the class Gaming.
(-) The bottom heats up to a maximum of 52.2 °C / 126 F, compared to the average of 43.2 °C / 110 F
(+) In idle usage, the average temperature for the upper side is 30.9 °C / 88 F, compared to the device average of 33.8 °C / 93 F.
(-) Playing The Witcher 3, the average temperature for the upper side is 42.9 °C / 109 F, compared to the device average of 33.8 °C / 93 F.
(±) The palmrests and touchpad can get very hot to the touch with a maximum of 39.2 °C / 102.6 F.
(-) The average temperature of the palmrest area of similar devices was 28.9 °C / 84 F (-10.3 °C / -18.6 F).
| Asus ROG Strix Scar 16 G634JZR i9-14900HX, NVIDIA GeForce RTX 4080 Laptop GPU | Asus ROG Strix Scar 17 G733PYV-LL053X R9 7945HX3D, NVIDIA GeForce RTX 4090 Laptop GPU | Asus ROG Strix G16 G614JZ i9-13980HX, NVIDIA GeForce RTX 4080 Laptop GPU | Lenovo Legion Pro 7 16IRX9H i9-14900HX, NVIDIA GeForce RTX 4080 Laptop GPU | HP Omen 16 (2024) i9-14900HX, NVIDIA GeForce RTX 4080 Laptop GPU | MSI Vector 16 HX A14V i9-14900HX, NVIDIA GeForce RTX 4080 Laptop GPU | Alienware m16 R2 Ultra 7 155H, NVIDIA GeForce RTX 4070 Laptop GPU | |
|---|---|---|---|---|---|---|---|
| Heat | 15% | -2% | -5% | 9% | 23% | -7% | |
| Maximum Upper Side * | 47.8 | 40.1 16% | 54 -13% | 46 4% | 47 2% | 36.4 24% | 44.8 6% |
| Maximum Bottom * | 52.2 | 46.7 11% | 55 -5% | 49 6% | 57 -9% | 35.6 32% | 48 8% |
| Idle Upper Side * | 32.4 | 26.5 18% | 29 10% | 38 -17% | 25 23% | 26.6 18% | 37.2 -15% |
| Idle Bottom * | 33 | 27.7 16% | 33 -0% | 37 -12% | 26 21% | 27 18% | 42 -27% |
* ... smaller is better
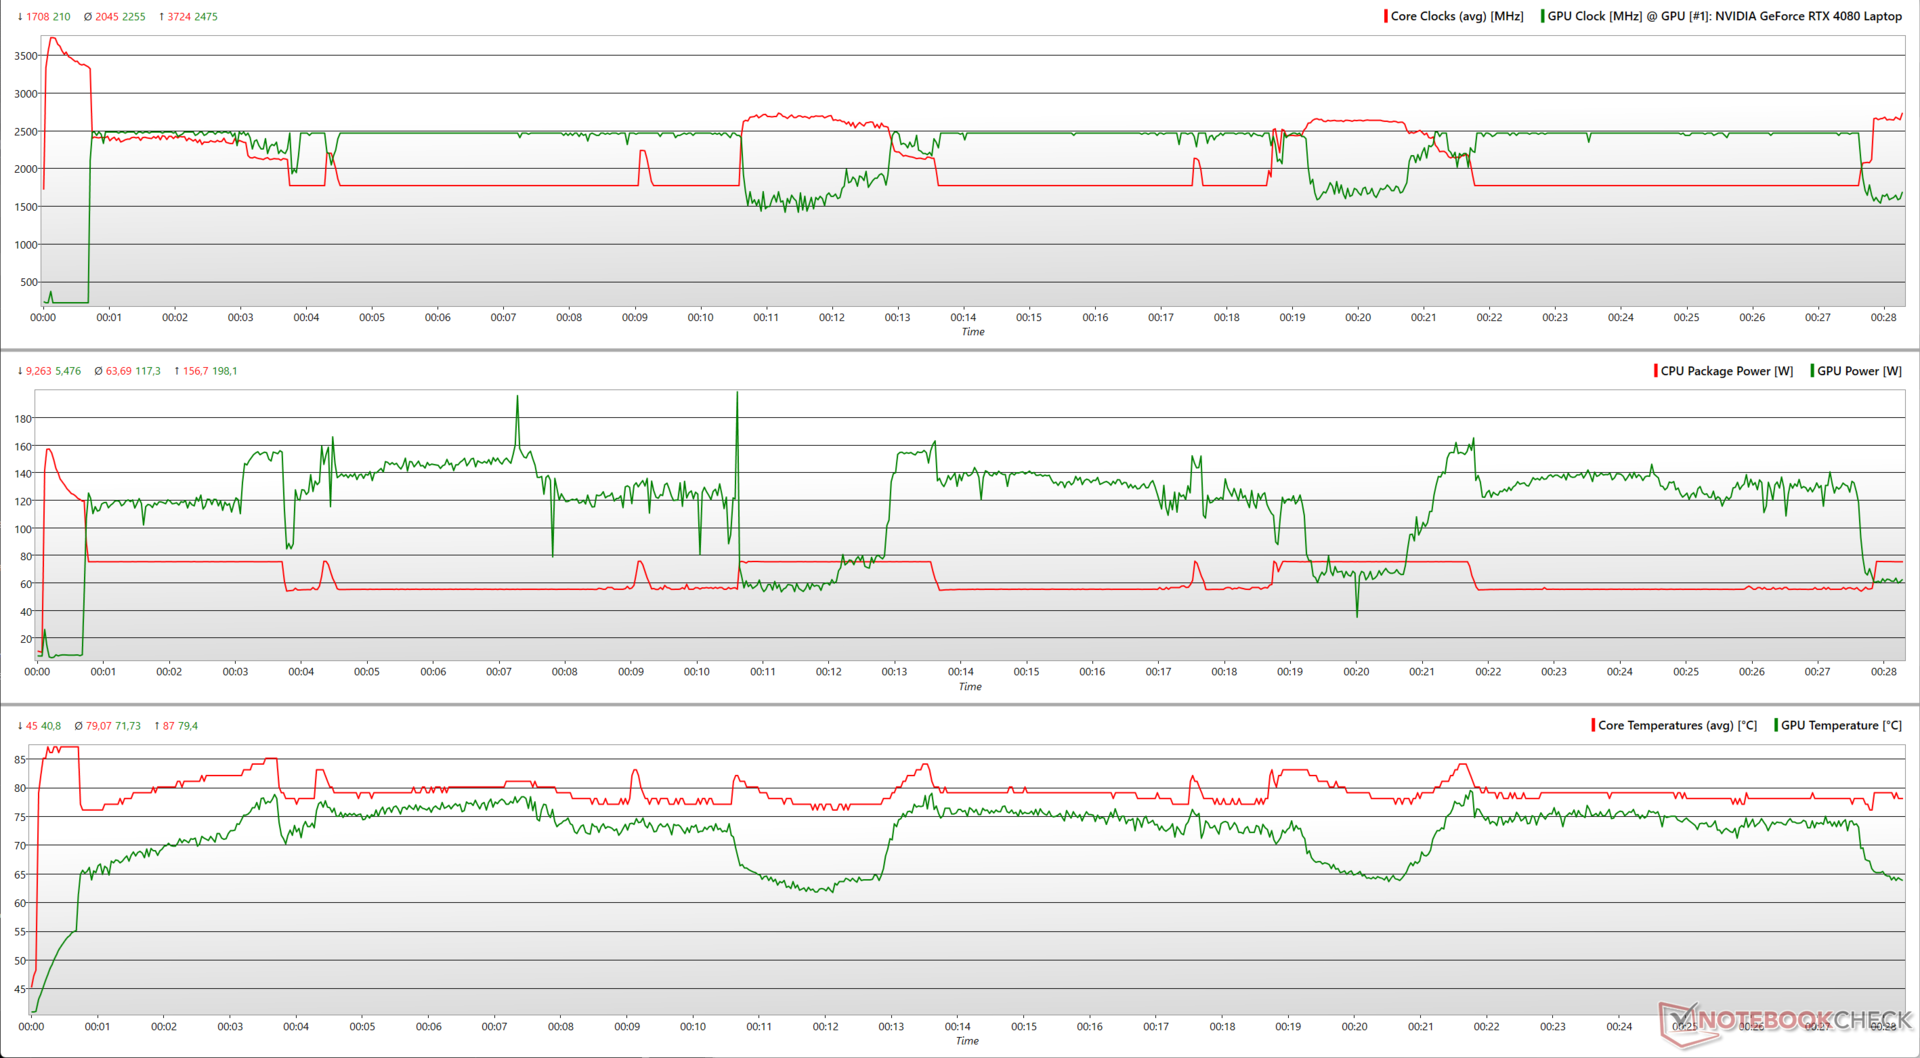
Stress Test
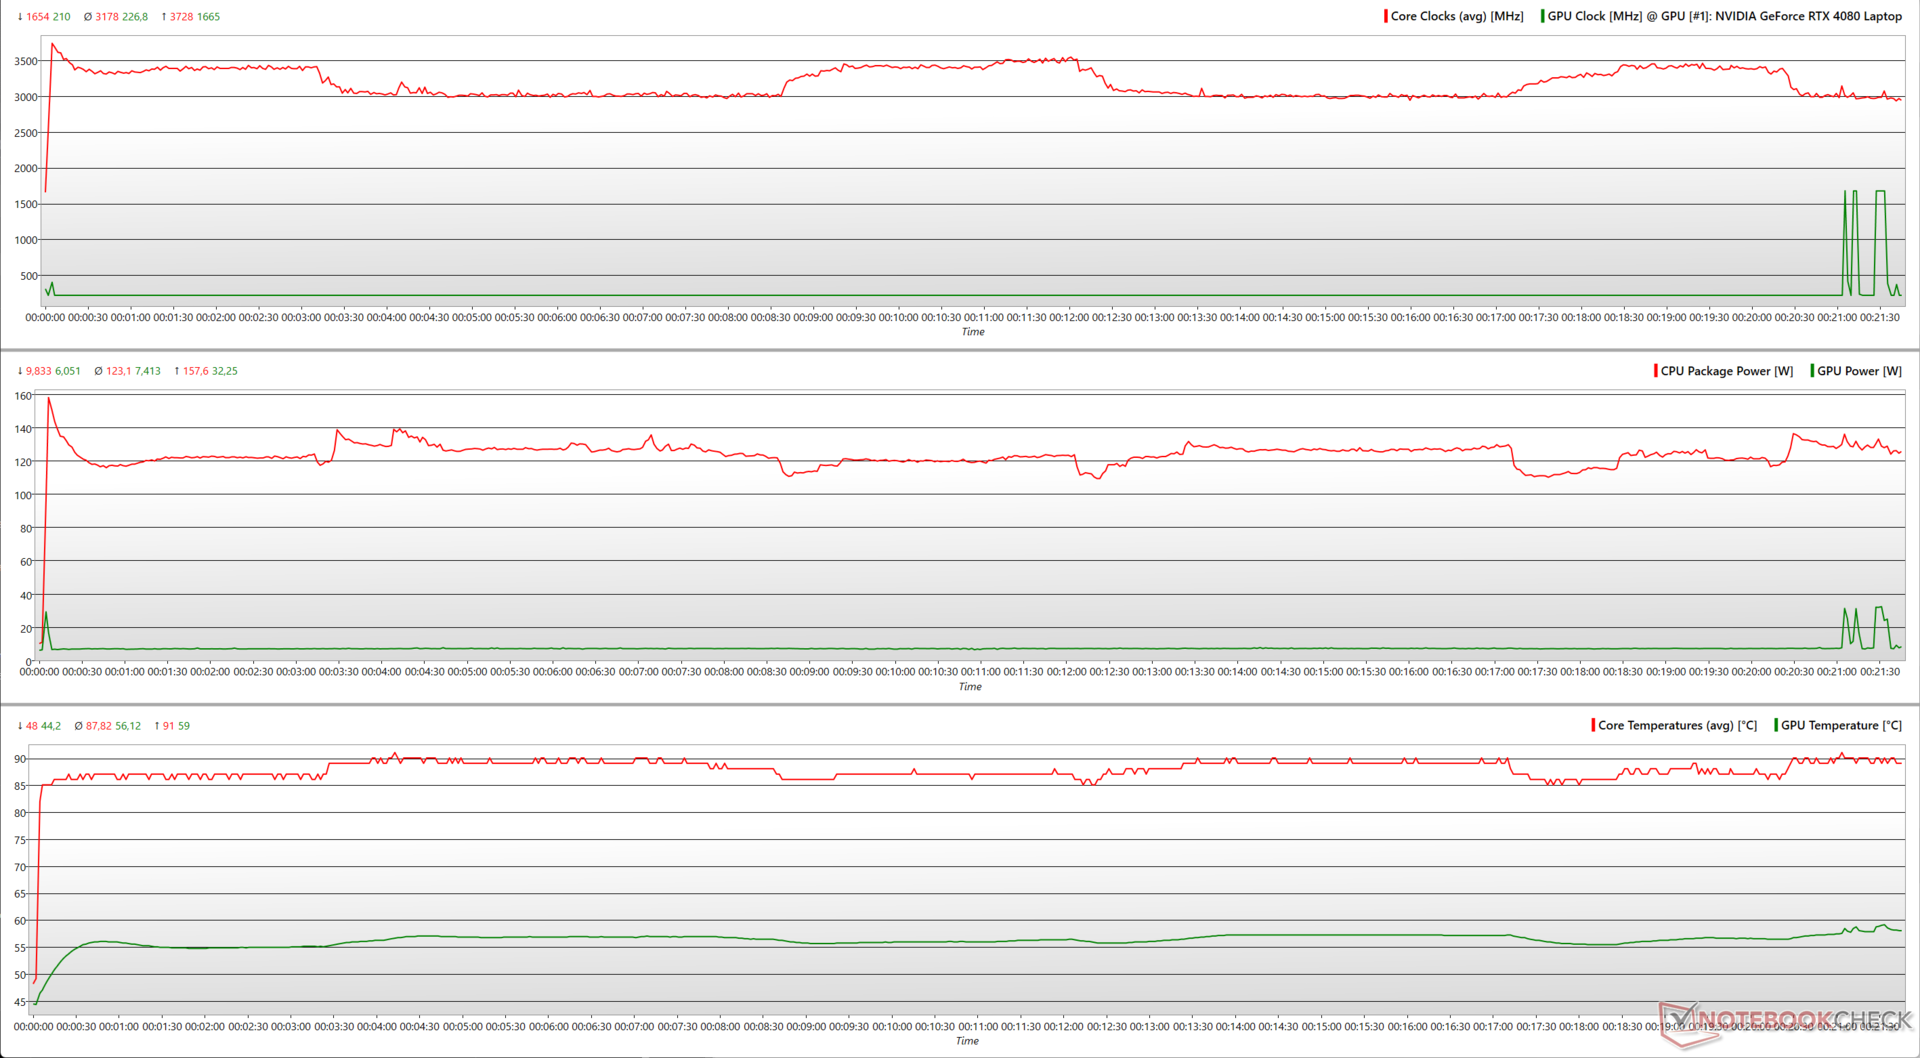
Stressing the Scar 16 with Prime95 in-place large FFTs alone sees the Core i9-14900HX utilize up to 158 W with clocks peaking at 3.7 GHz, but this cannot be sustained for long. The frequency drops to ~3 GHz when core temperatures hit the 90 °C mark. The cores get a breather and are able to boost up to 3.5 GHz when temperatures drop to ~87 °C.
The addition of FurMark (1280 x 720, no AA) sees the Scar 16's RTX 4080 draw a momentary 198 W. The laptop can utilize a combined 181 W total power on average with both the CPU and GPU.
However, we observed a tussle for power as the CPU needed to dial down for the GPU to boost higher and vice versa.
| Stress Test | CPU Clock (GHz) | GPU Clock (MHz) | Average CPU Temperature (°C) | Average GPU Temperature (°C) |
| System Idle | 1.6 | 210 | 41 | 37.5 |
| Prime95 | 3.0 | 210 | 87 | 56 |
| Prime95 + FurMark | 2.7 | 1,500 | 78 | 70.4 |
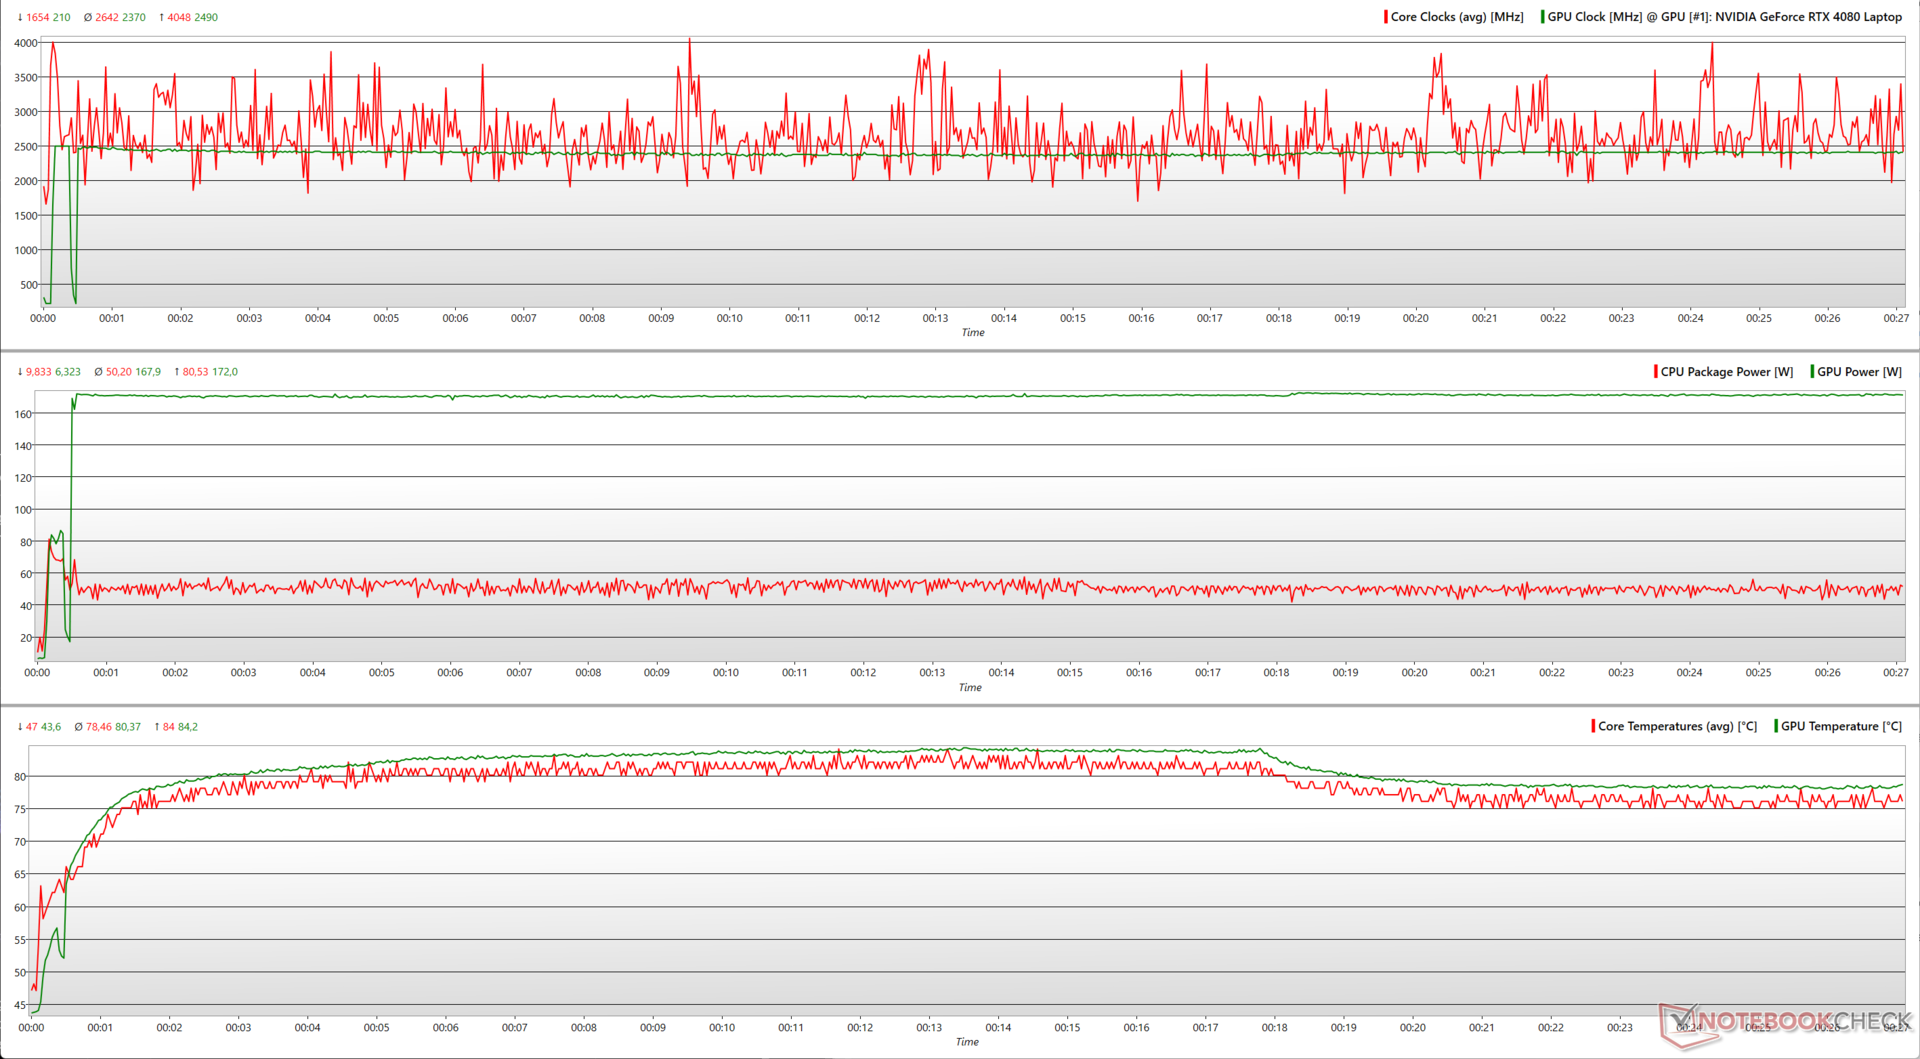
| The Witcher 3 1080p Ultra | 2.4 | 2,460 | 78 | 80.2 |
Stressing the Scar 16 with The Witcher 3 at 1080p Ultra present a more real-world behavior. The Core i9-14900HX can attain 4 GHz boosts at times while consuming 81 W. The RTX 4080, on the other hand, operates at a well-sustained 2,500 MHz while utilizing a consistent ~170 W.
Speakers
The Scar 16 uses a quad-speaker array with two tweeters near the base of the lid and two downward firing woofers. Asus specifies support for Hi-Res Audio and Dolby Atmos.
The 79 db(A) loudness is sufficient for an average sized room. The bass response is passable but could have been better considering the presence of dedicated woofers. The mids and highs are reproduced fairly well.
Presence of a 3.5 mm combo audio jack and Bluetooth 5.3 means users can hook up much more capable external audio devices.
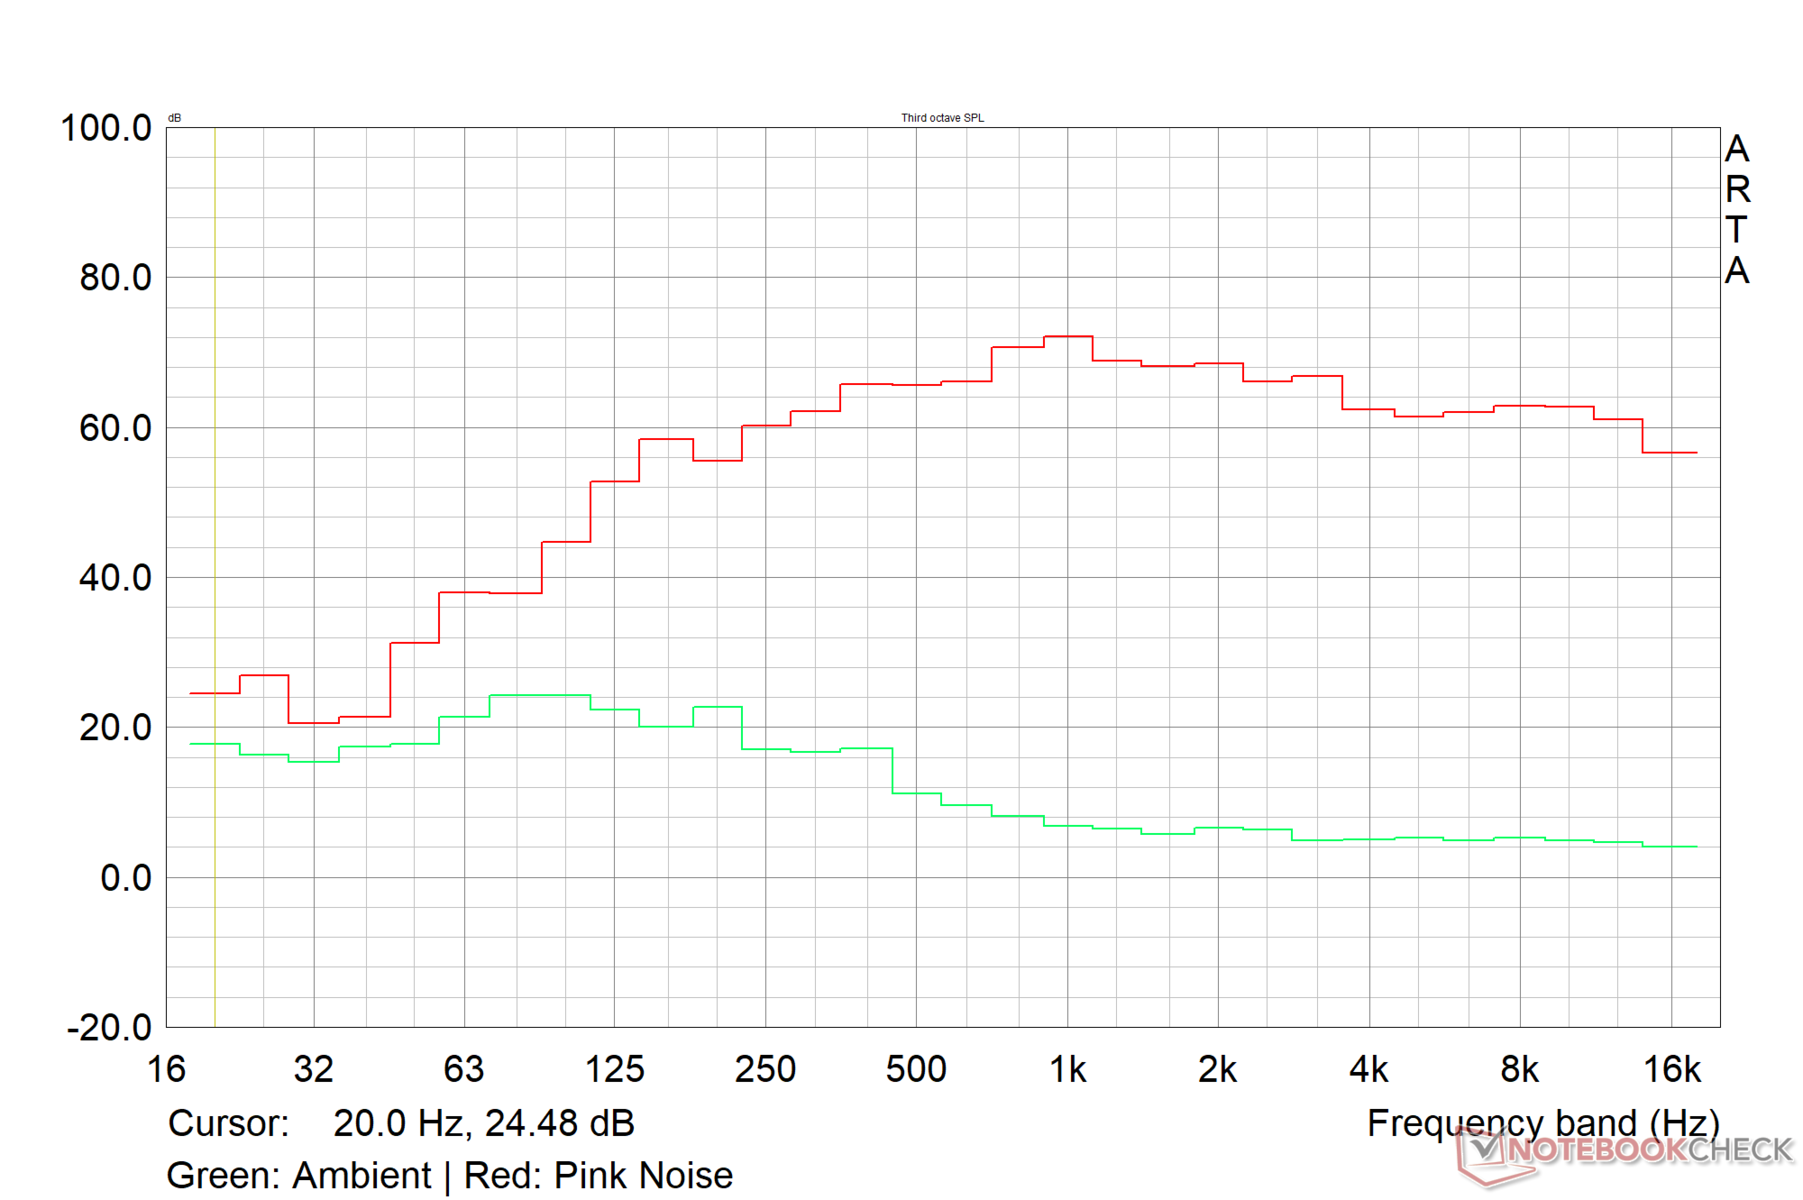
Asus ROG Strix Scar 16 G634JZR audio analysis
(±) | speaker loudness is average but good (79 dB)
Bass 100 - 315 Hz
(±) | reduced bass - on average 7.1% lower than median
(±) | linearity of bass is average (9% delta to prev. frequency)
Mids 400 - 2000 Hz
(±) | higher mids - on average 5.5% higher than median
(+) | mids are linear (3.3% delta to prev. frequency)
Highs 2 - 16 kHz
(+) | balanced highs - only 1.4% away from median
(+) | highs are linear (2.6% delta to prev. frequency)
Overall 100 - 16.000 Hz
(+) | overall sound is linear (9.8% difference to median)
Compared to same class
» 4% of all tested devices in this class were better, 2% similar, 95% worse
» The best had a delta of 6%, average was 18%, worst was 132%
Compared to all devices tested
» 3% of all tested devices were better, 1% similar, 96% worse
» The best had a delta of 4%, average was 25%, worst was 134%
Apple MacBook Pro 16 2021 M1 Pro audio analysis
(+) | speakers can play relatively loud (84.7 dB)
Bass 100 - 315 Hz
(+) | good bass - only 3.8% away from median
(+) | bass is linear (5.2% delta to prev. frequency)
Mids 400 - 2000 Hz
(+) | balanced mids - only 1.3% away from median
(+) | mids are linear (2.1% delta to prev. frequency)
Highs 2 - 16 kHz
(+) | balanced highs - only 1.9% away from median
(+) | highs are linear (2.7% delta to prev. frequency)
Overall 100 - 16.000 Hz
(+) | overall sound is linear (4.6% difference to median)
Compared to same class
» 0% of all tested devices in this class were better, 0% similar, 100% worse
» The best had a delta of 5%, average was 18%, worst was 45%
Compared to all devices tested
» 0% of all tested devices were better, 0% similar, 100% worse
» The best had a delta of 4%, average was 25%, worst was 134%
Energy Management: On expected lines for the hardware on board
Power Consumption
The Scar 16 consumes slightly more power compared to the ROG Strix G16 with a Core i9-13980HX. The Omen 16 with a similar configuration is about 8% more economical than the Scar 16 overall due to its lower wattage CPU and GPU.
The Vector 16 HX has identical power consumption under load, although it shows considerably higher idle power draws.
The supplied 330 W power adapter can keep the laptop adequately fed under maximum stress.
| Off / Standby | |
| Idle | |
| Load |
|
| Asus ROG Strix Scar 16 G634JZR i9-14900HX, NVIDIA GeForce RTX 4080 Laptop GPU, Mini LED, 2560x1600, 16.00 | Asus ROG Strix Scar 17 G733PYV-LL053X R9 7945HX3D, NVIDIA GeForce RTX 4090 Laptop GPU, IPS, 2560x1440, 17.30 | Asus ROG Strix G16 G614JZ i9-13980HX, NVIDIA GeForce RTX 4080 Laptop GPU, IPS, 2560x1600, 16.00 | Lenovo Legion Pro 7 16IRX9H i9-14900HX, NVIDIA GeForce RTX 4080 Laptop GPU, IPS, 2560x1600, 16.00 | HP Omen 16 (2024) i9-14900HX, NVIDIA GeForce RTX 4080 Laptop GPU, IPS, 2560x1440, 16.10 | MSI Vector 16 HX A14V i9-14900HX, NVIDIA GeForce RTX 4080 Laptop GPU, IPS, 2560x1600, 16.00 | Alienware m16 R2 Ultra 7 155H, NVIDIA GeForce RTX 4070 Laptop GPU, IPS, 2560x1600, 16.00 | Average NVIDIA GeForce RTX 4080 Laptop GPU | Average of class Gaming | |
|---|---|---|---|---|---|---|---|---|---|
| Power Consumption | -8% | 3% | -20% | 8% | -16% | 16% | -18% | -3% | |
| Idle Minimum * | 10.71 | 15.4 -44% | 10 7% | 16 -49% | 9 16% | 15.8 -48% | 8.1 24% | 16.2 ? -51% | 13.9 ? -30% |
| Idle Average * | 14.75 | 21.6 -46% | 16 -8% | 21 -42% | 16 -8% | 23.3 -58% | 13 12% | 21.4 ? -45% | 19.2 ? -30% |
| Idle Maximum * | 30 | 22.2 26% | 27 10% | 36 -20% | 35 -17% | 30 -0% | 40.3 -34% | 33.7 ? -12% | 27 ? 10% |
| Load Average * | 135 | 116.7 14% | 129 4% | 132 2% | 129 4% | 123.9 8% | 79 41% | 118.8 ? 12% | 111.4 ? 17% |
| Witcher 3 ultra * | 286 | 262 8% | 247 14% | 267 7% | 150.8 47% | 285 -0% | 188.1 34% | ||
| Load Maximum * | 307 | 327.1 -7% | 342 -11% | 360 -17% | 285 7% | 306 -0% | 254.9 17% | 293 ? 5% | 251 ? 18% |
* ... smaller is better
Power Consumption: The Witcher 3 / Stress test
Power Consumption: External monitor
Battery Life
In the Silent profile with MSHybrid enabled and a 60 Hz refresh rate, the Scar 16 lasts up to 7:14 hours in our standardized Wi-Fi web browsing test at 150 nits brightness. This increases to 7.5 hours in the H.264 1080p loop test at the same brightness level with all radios turned off.
Gaming for long hours on battery with the Scar 16 is a pipedream as the laptop barely lasts an hour while playing The Witcher 3 1080p Ultra at 150 nits.
| Asus ROG Strix Scar 16 G634JZR i9-14900HX, NVIDIA GeForce RTX 4080 Laptop GPU, 90 Wh | Asus ROG Strix Scar 17 G733PYV-LL053X R9 7945HX3D, NVIDIA GeForce RTX 4090 Laptop GPU, 90 Wh | Asus ROG Strix G16 G614JZ i9-13980HX, NVIDIA GeForce RTX 4080 Laptop GPU, 90 Wh | Lenovo Legion Pro 7 16IRX9H i9-14900HX, NVIDIA GeForce RTX 4080 Laptop GPU, 99.9 Wh | HP Omen 16 (2024) i9-14900HX, NVIDIA GeForce RTX 4080 Laptop GPU, 83 Wh | MSI Vector 16 HX A14V i9-14900HX, NVIDIA GeForce RTX 4080 Laptop GPU, 90 Wh | Alienware m16 R2 Ultra 7 155H, NVIDIA GeForce RTX 4070 Laptop GPU, 90 Wh | Average of class Gaming | |
|---|---|---|---|---|---|---|---|---|
| Battery Runtime | -20% | 31% | -14% | -19% | 21% | 15% | 20% | |
| H.264 | 451 | 302 -33% | 400 ? -11% | |||||
| WiFi v1.3 | 434 | 287 -34% | 583 34% | 373 -14% | 352 -19% | 332 -24% | 483 11% | 367 ? -15% |
| Witcher 3 ultra | 57 | 80.6 ? 41% | ||||||
| Load | 51 | 55 8% | 65 27% | 84 65% | 60 18% | 84.3 ? 65% | ||
| Reader / Idle | 641 | 758 | 543 ? |
Pros
Cons
Verdict: Customary iterative upgrade for enthusiast gamers
Asus sticks to the tried and tested formula that distinguishes the Scar 16 from the competition. In that sense, this year's Asus ROG Strix Scar 16 is only an evolutionary but not a revolutionary upgrade over the previous generation.
Asus offers a premium mini LED G-Sync HDR display with the Scar 16. The 240 Hz high-PWM frequency display presents excellent color characteristics and is perfectly suitable for color-critical workflows as well, albeit in the single-zone backlight mode. This is, unfortunately, not well-documented.
The Asus ROG Strix Scar 16 ticks nearly all boxes expected from a 16-inch enthusiast gaming laptop in 2024. Its peers, however, offer similar features and performance for a lower asking price.
Performance-wise, the ROG Strix Scar 16 stands toe-to-toe with other Core i9-14900HX and RTX 4080-powered laptops.
Asus's cooling tweaks allow the Scar 16 to make use of a combined 180 W from both the CPU and GPU under load. However, pushing the laptop this far inevitably results in high surface temperatures and fan noise emissions.
Some qualms we like to be addressed include better Wi-Fi 5 performance and a more equitable port distribution on either side. Additionally, including a 1080p webcam in this model should not be too demanding for Asus in 2024.
If you are looking at a 16-inch gaming powerhouse with about ₹3,00,00 (~US$3,000) to spare, the Asus ROG Strix Scar 16 almost perfectly fits the bill. It is not the most ideal bargain, however.
The Lenovo Legion Pro 7 has a slimmer profile, larger battery (with lower runtimes), and a vastly superior 1080p webcam while performing slightly better on the CPU side of things.
The MSI Vector 16 HX, although lacking some of the added RGB bling and G-Sync, is priced somewhat lower and matches the Scar 16's performance in most aspects.
Price and Availability
In India, the Asus ROG Strix Scar 16 (2024) with an RTX 4080 is officially priced at ₹2,89,990 but currently retails for ₹3,04,490 on Amazon India while the RTX 4090 version is available for the designated price of ₹3,29,990.
The tested ROG Strix Scar 16 (2024) with a 1 TB SSD and RTX 4080 can be had for US$2,900 on Amazon US and Best Buy US while the RTX 4090 variant will set you back by US$3,625.
Asus ROG Strix Scar 16 G634JZR
-
04/22/2024 v7
Vaidyanathan Subramaniam
More articles related to this device
Asus ROG Strix Scar 16 G634JZR (ROG Strix Scar 16 2024 Series)Related Articles


Transparency
The present review sample was made available to the author as a loan by the manufacturer or a shop for the purposes of review. The lender had no influence on this review, nor did the manufacturer receive a copy of this review before publication. There was no obligation to publish this review.
Pricecompare
