 Deutsch
 English
 Español
 Français
 Italiano
 Nederlands
 Polski
 Português
 Русский
 Türkçe
 Svenska
 Chinese
 Magyar
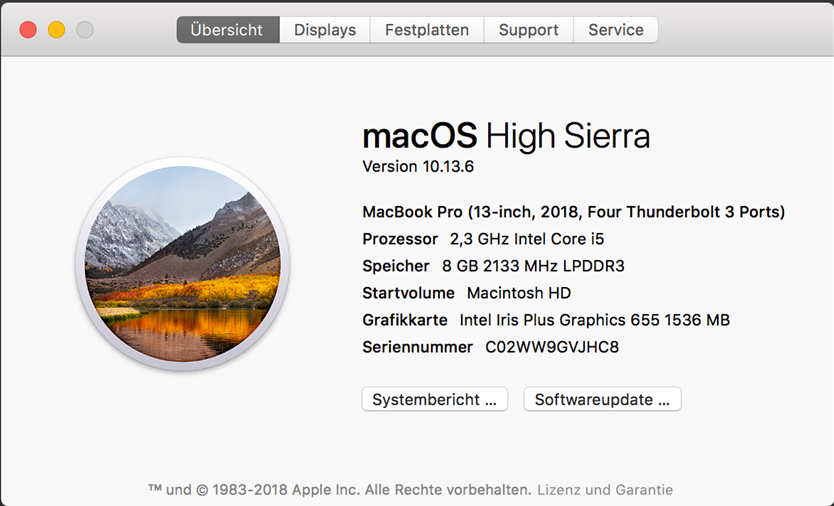
Apple MacBook Pro 13 2018 (Touch Bar, i5) Laptop Review
Apple quietly updated its MacBook Pro series. The exterior did not change, but the manufacturer from Cupertino finally uses Intel's 8th Gen. processors with four cores (Coffee Lake-U). Except for that, the displays now also support the True Tone technology, which is already familiar from the mobile devices iPhone or iPad, respectively.
Our review today is about the smaller 13-inch model, but only the more expensive Touch Bar version received the updates. The less expensive MBP 13 with function keys on the other hand is still sold with 2017 specs. Apple might be repeating the story of the MacBook Air, which did not get any updates for quite a while and became less expensive over the years. We are not fans of this development, because our reviews of the 2017 models showed the more expensive Touch Bar model was not the best choice for every user.
The price did not change and still starts at 1,999 Euros for the entry-level spec with a Core i5-8259U including Iris Plus 655 GPU, 8 GB LPDDR3-2133 RAM & 256 GB SSD storage. You can expand the memory all the way up to 16 GB (+240 Euros) and the storage up to 2 TB (+1,750 Euros), and the additional prices are once again extreme. We ordered our test sample directly from Apple's Austrian online shop; it is not a special press sample from Apple.
Case - MacBook Pro with familiar shell
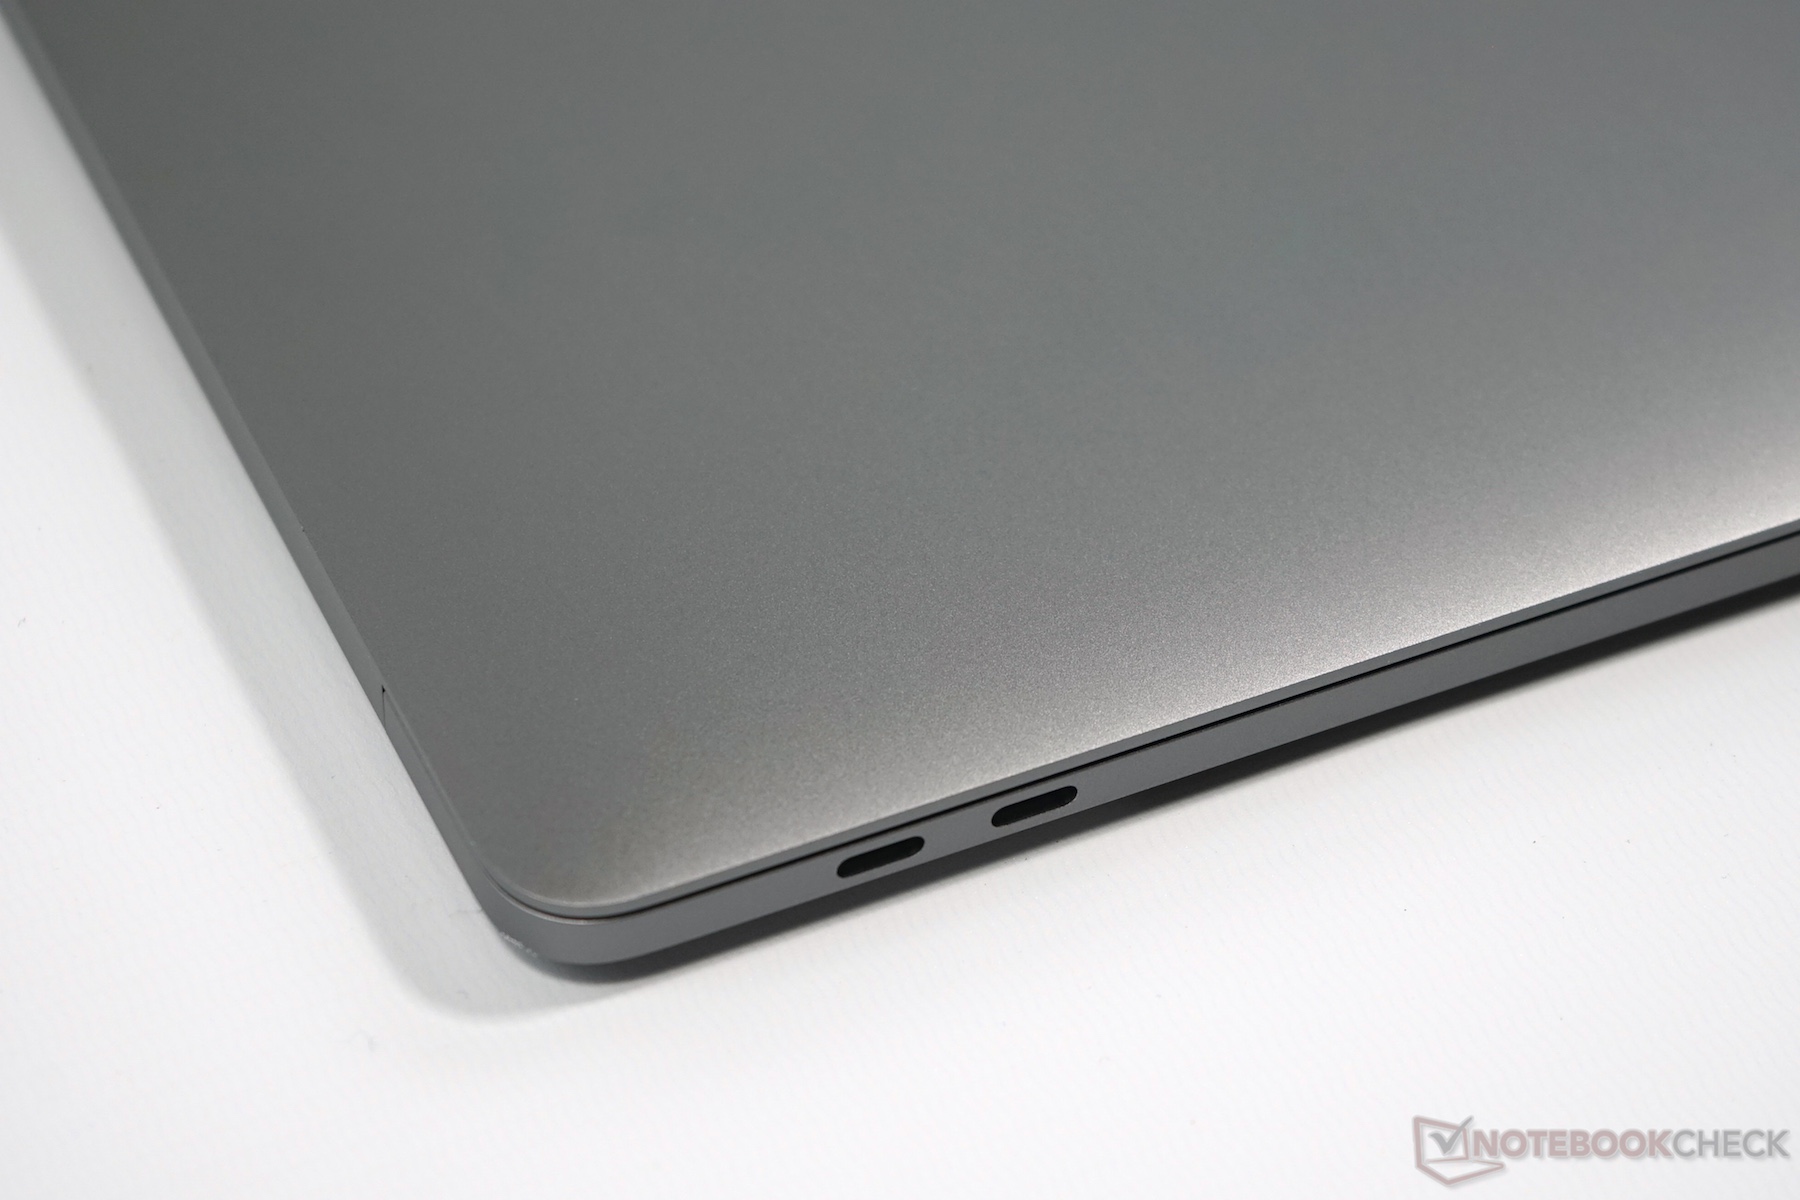
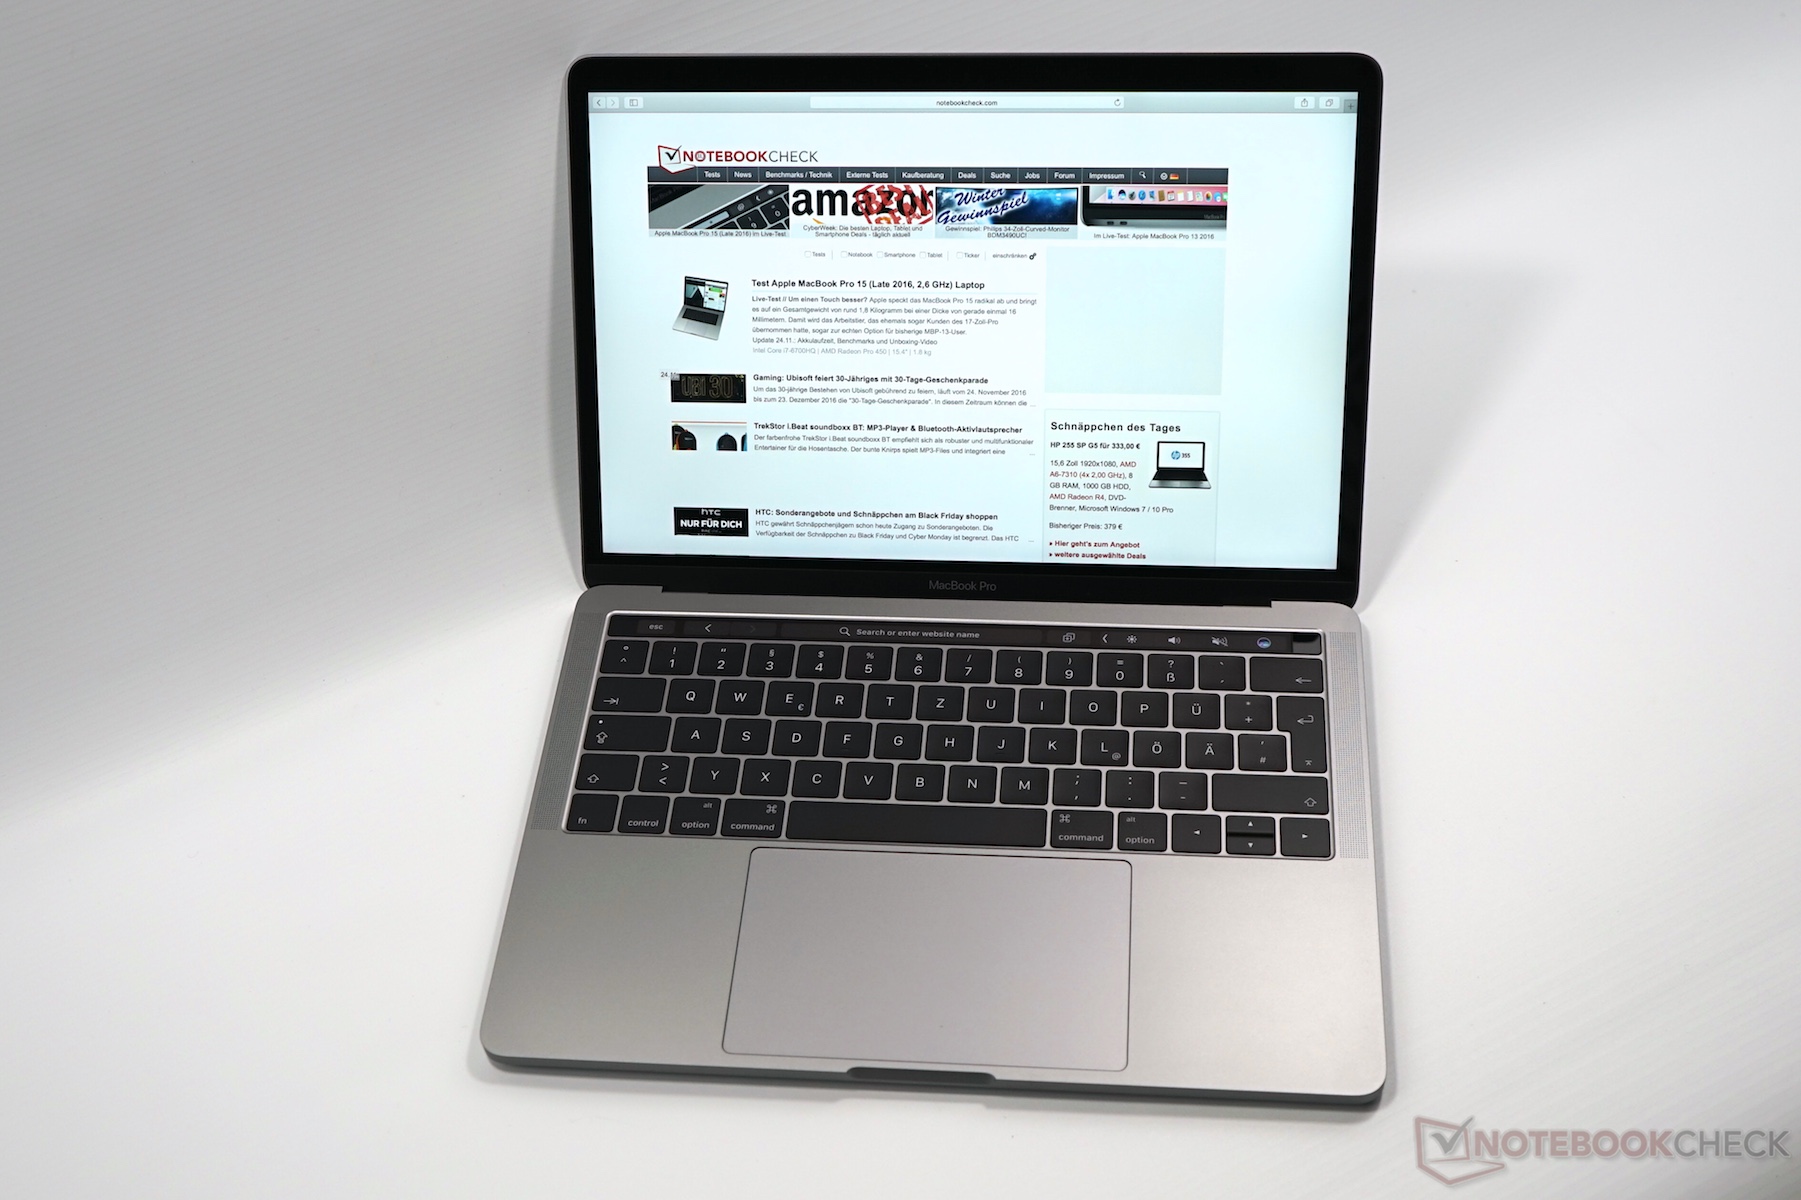
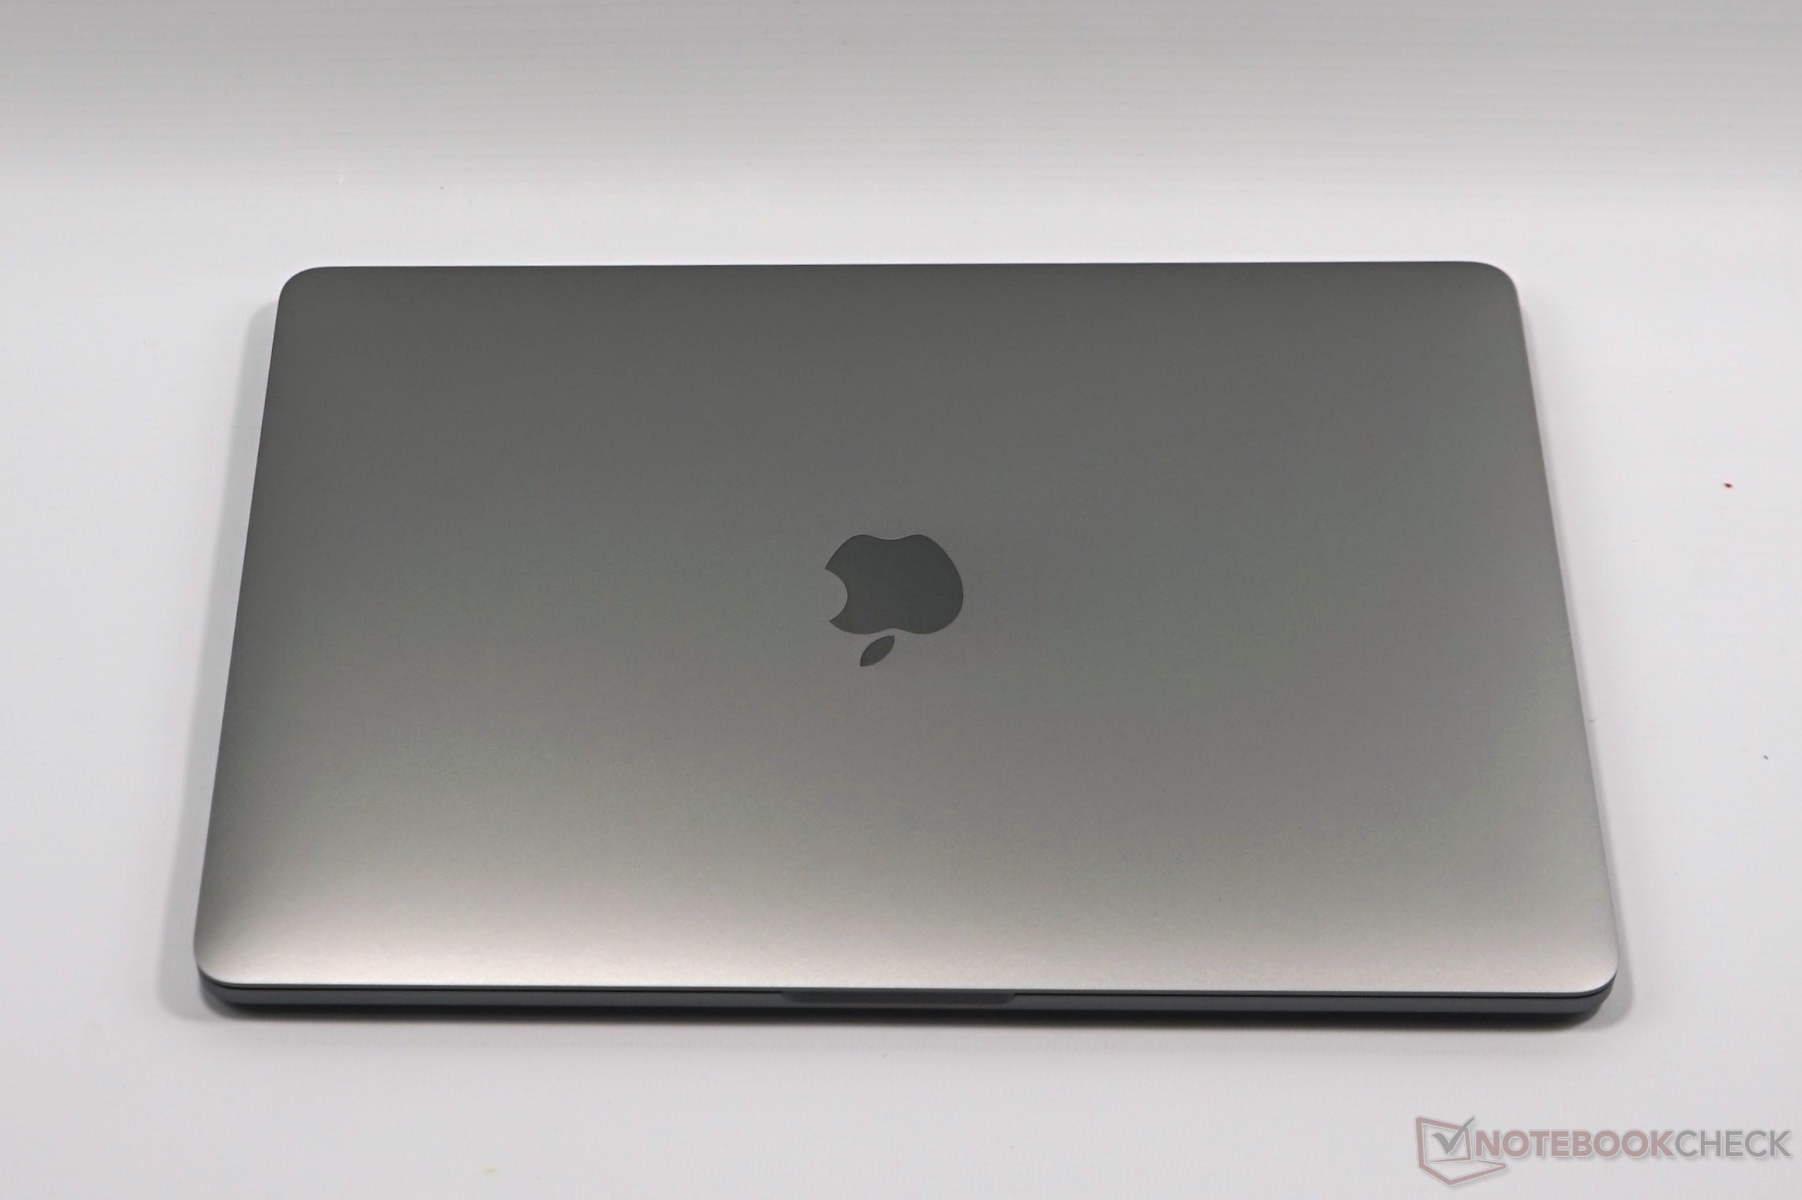
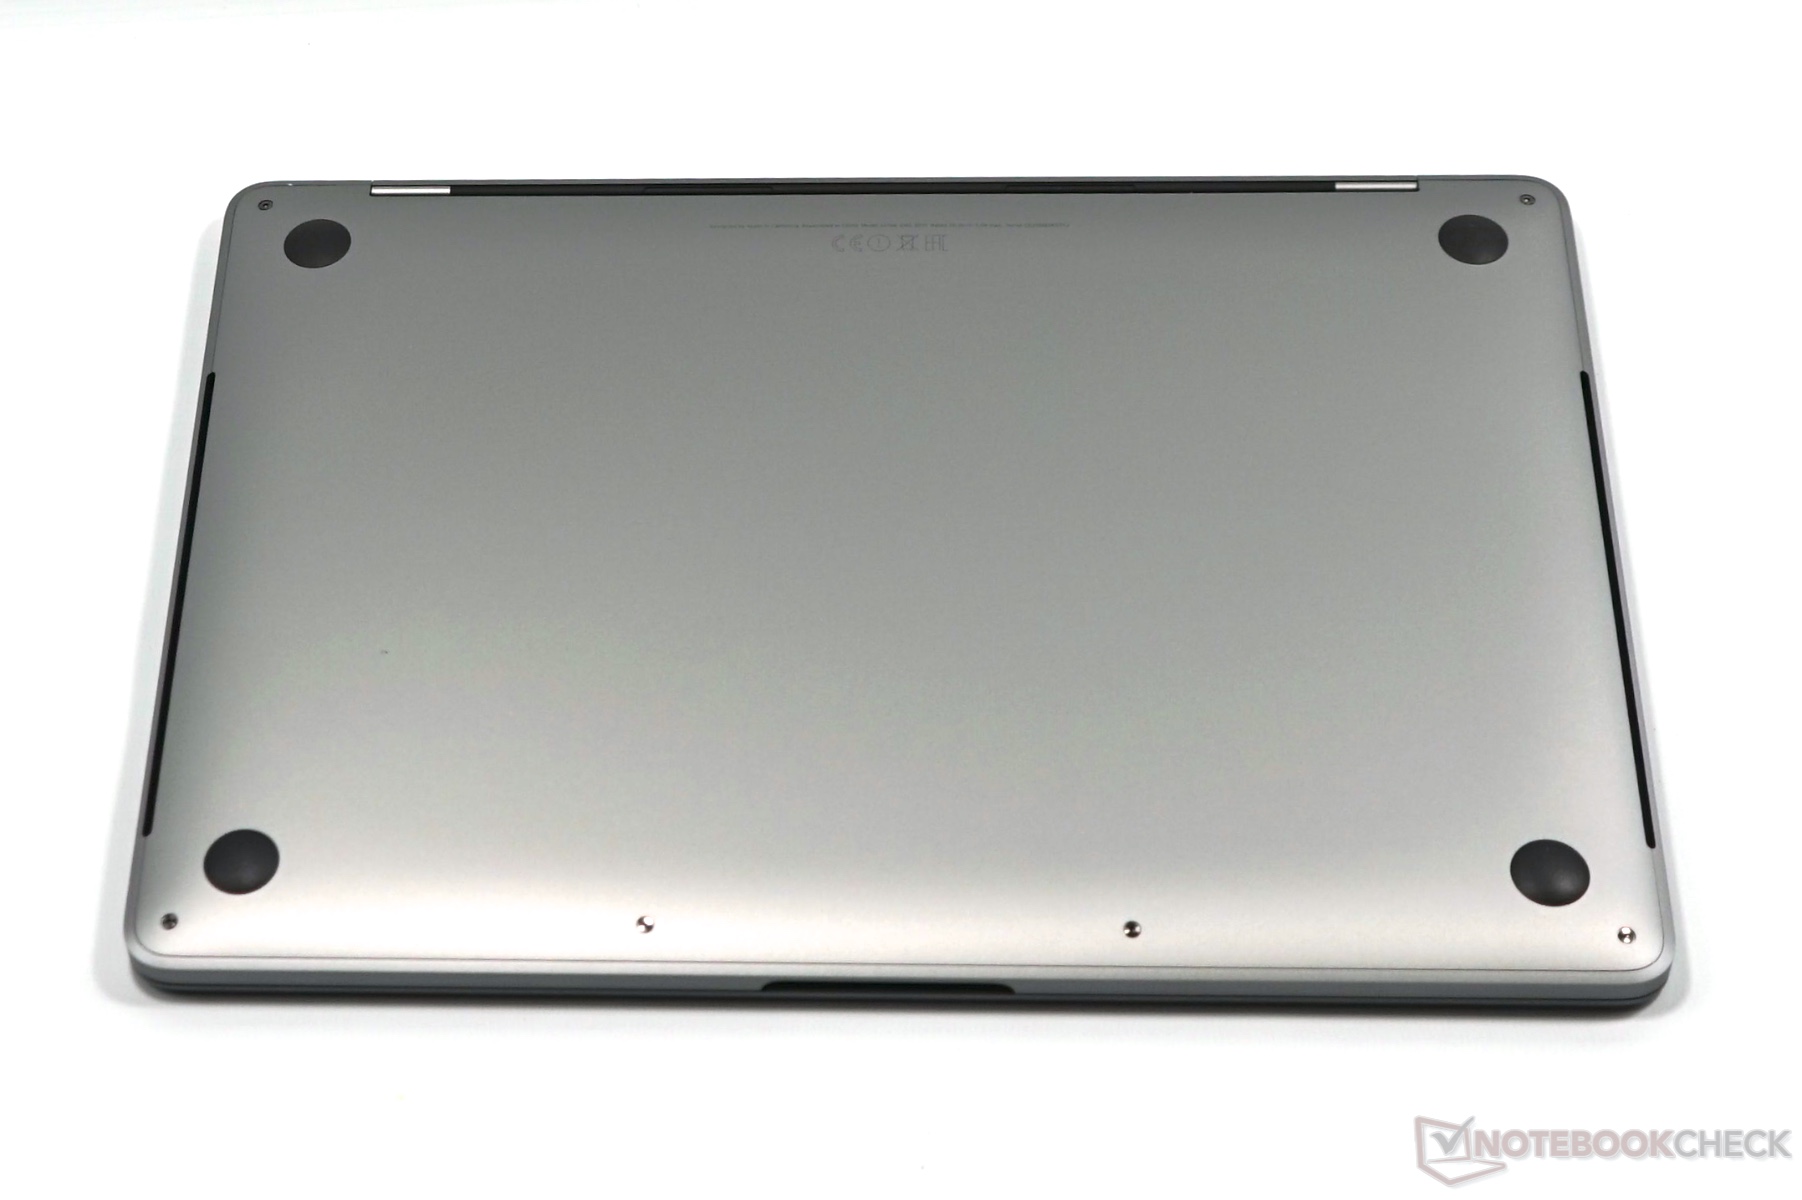
We already know the chassis design of the MacBook Pro 13 since 2016 and the current model is still available in the colors silver as well as space gray. There is still not much to criticize in terms of quality, which is also the case for tactile feeling of the metal surfaces. Based on our own experiences we can say that the case still leaves an excellent impression after longer periods of use, while plastic cases are more prone to wear (greasy surfaces etc.). We recommend our review of the MacBook Pro 13 2016 for more details on the case. The following pictures are from the 2016 model as well.
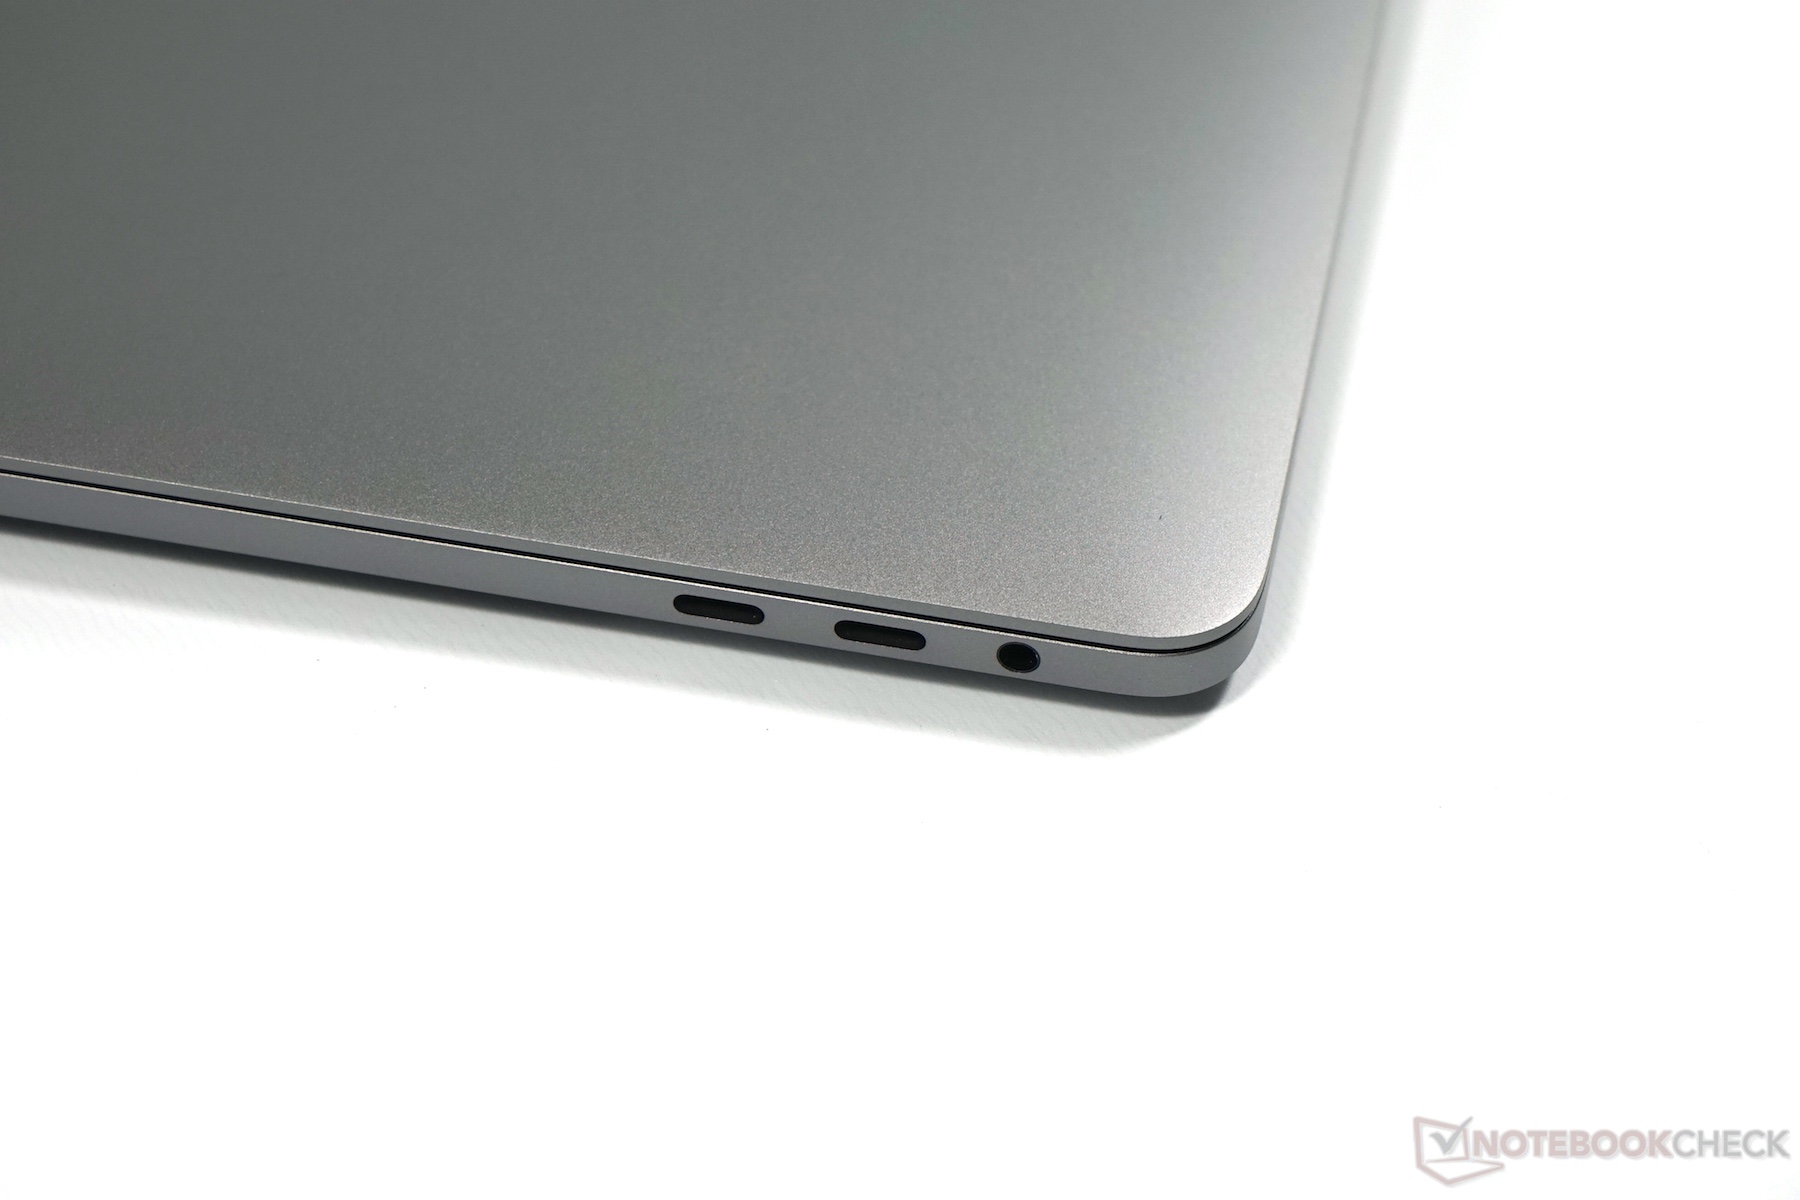
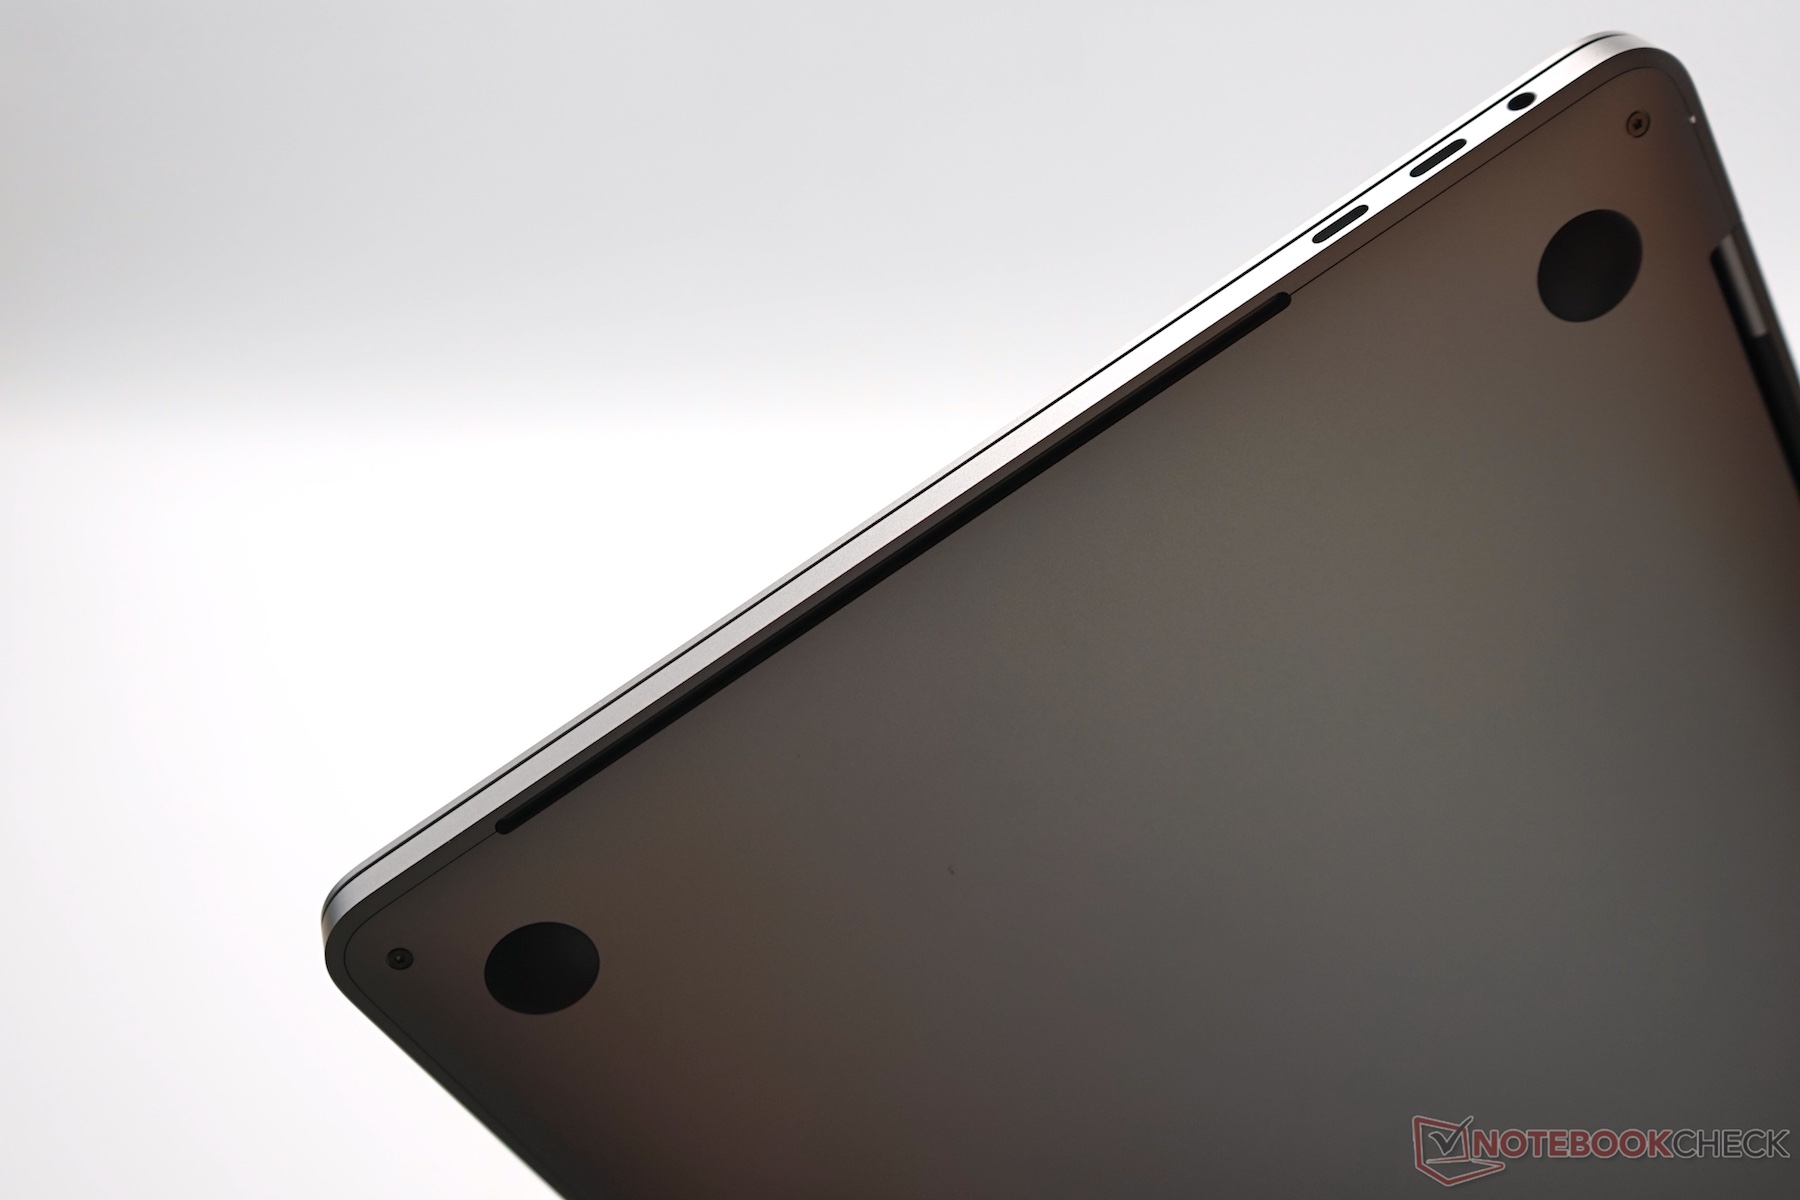
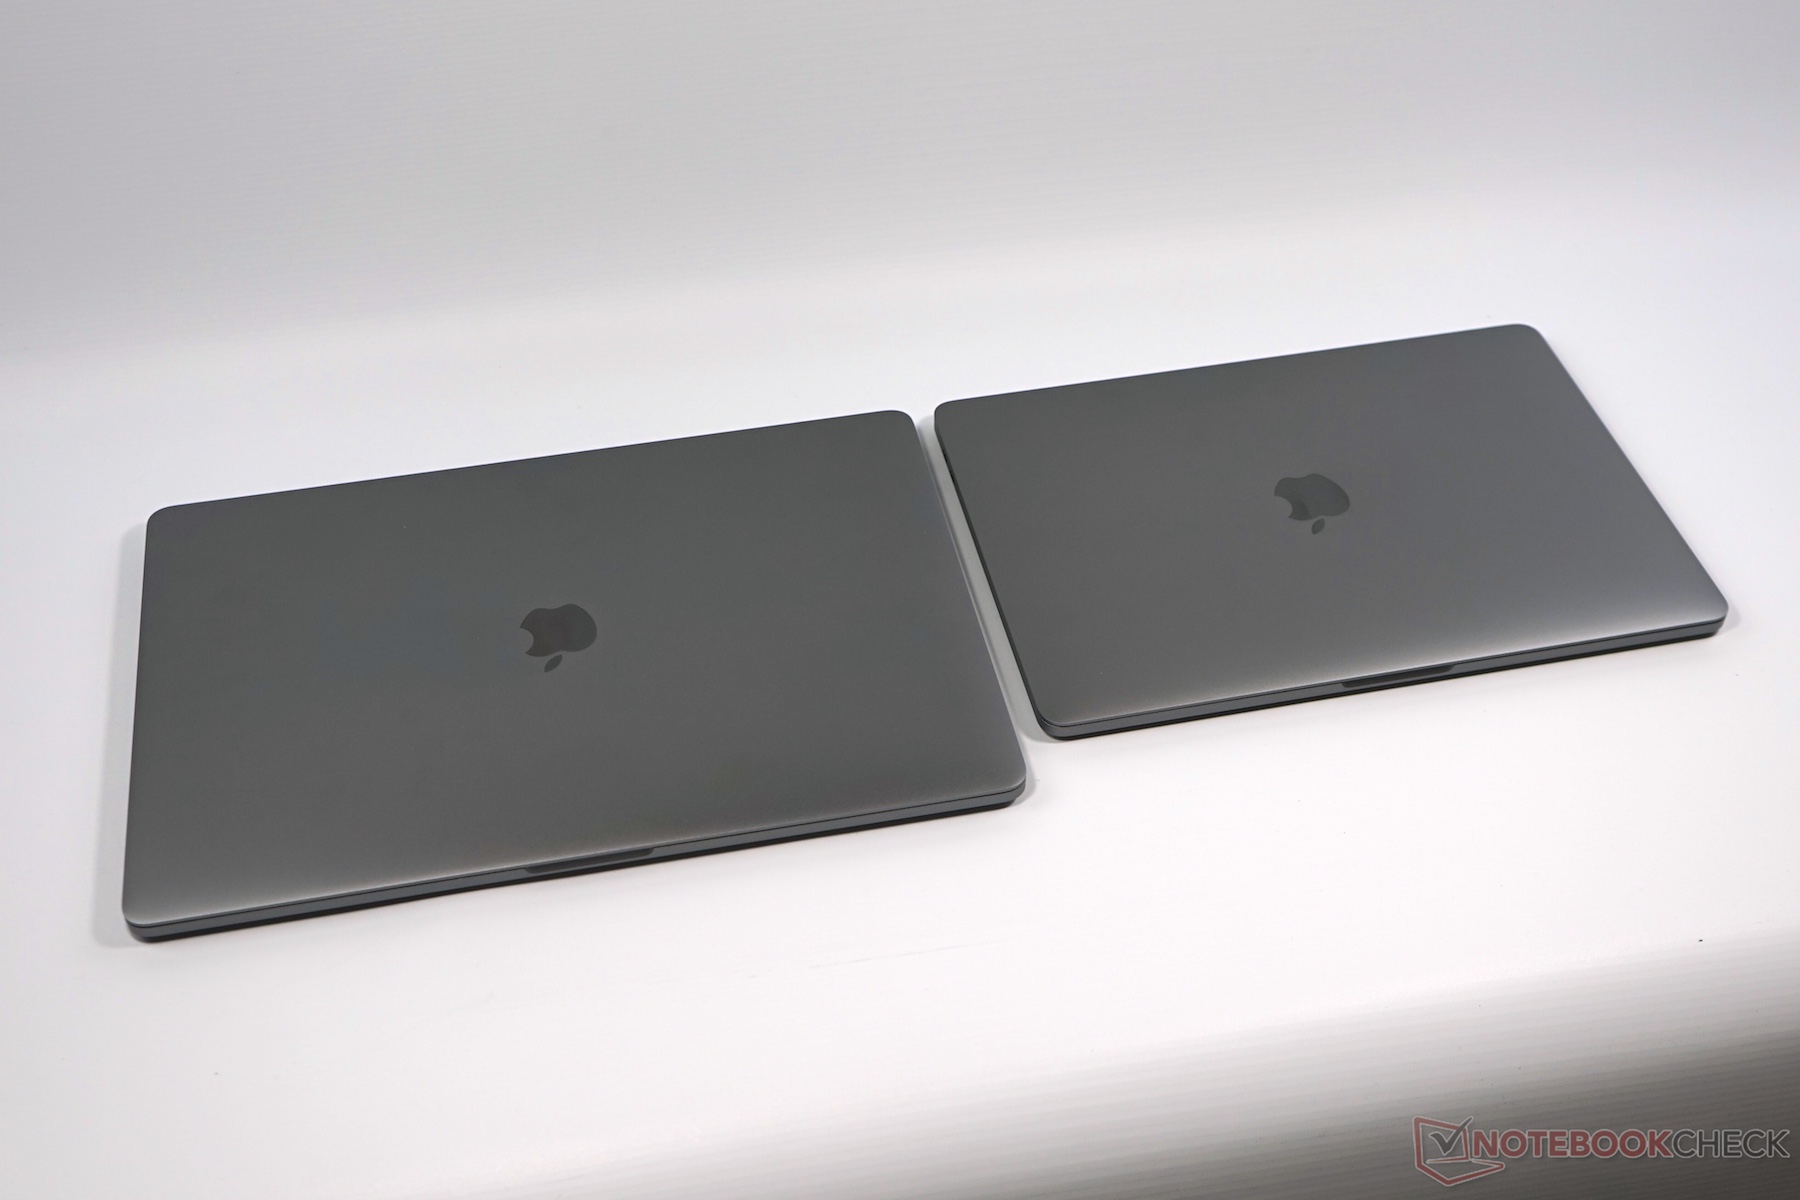
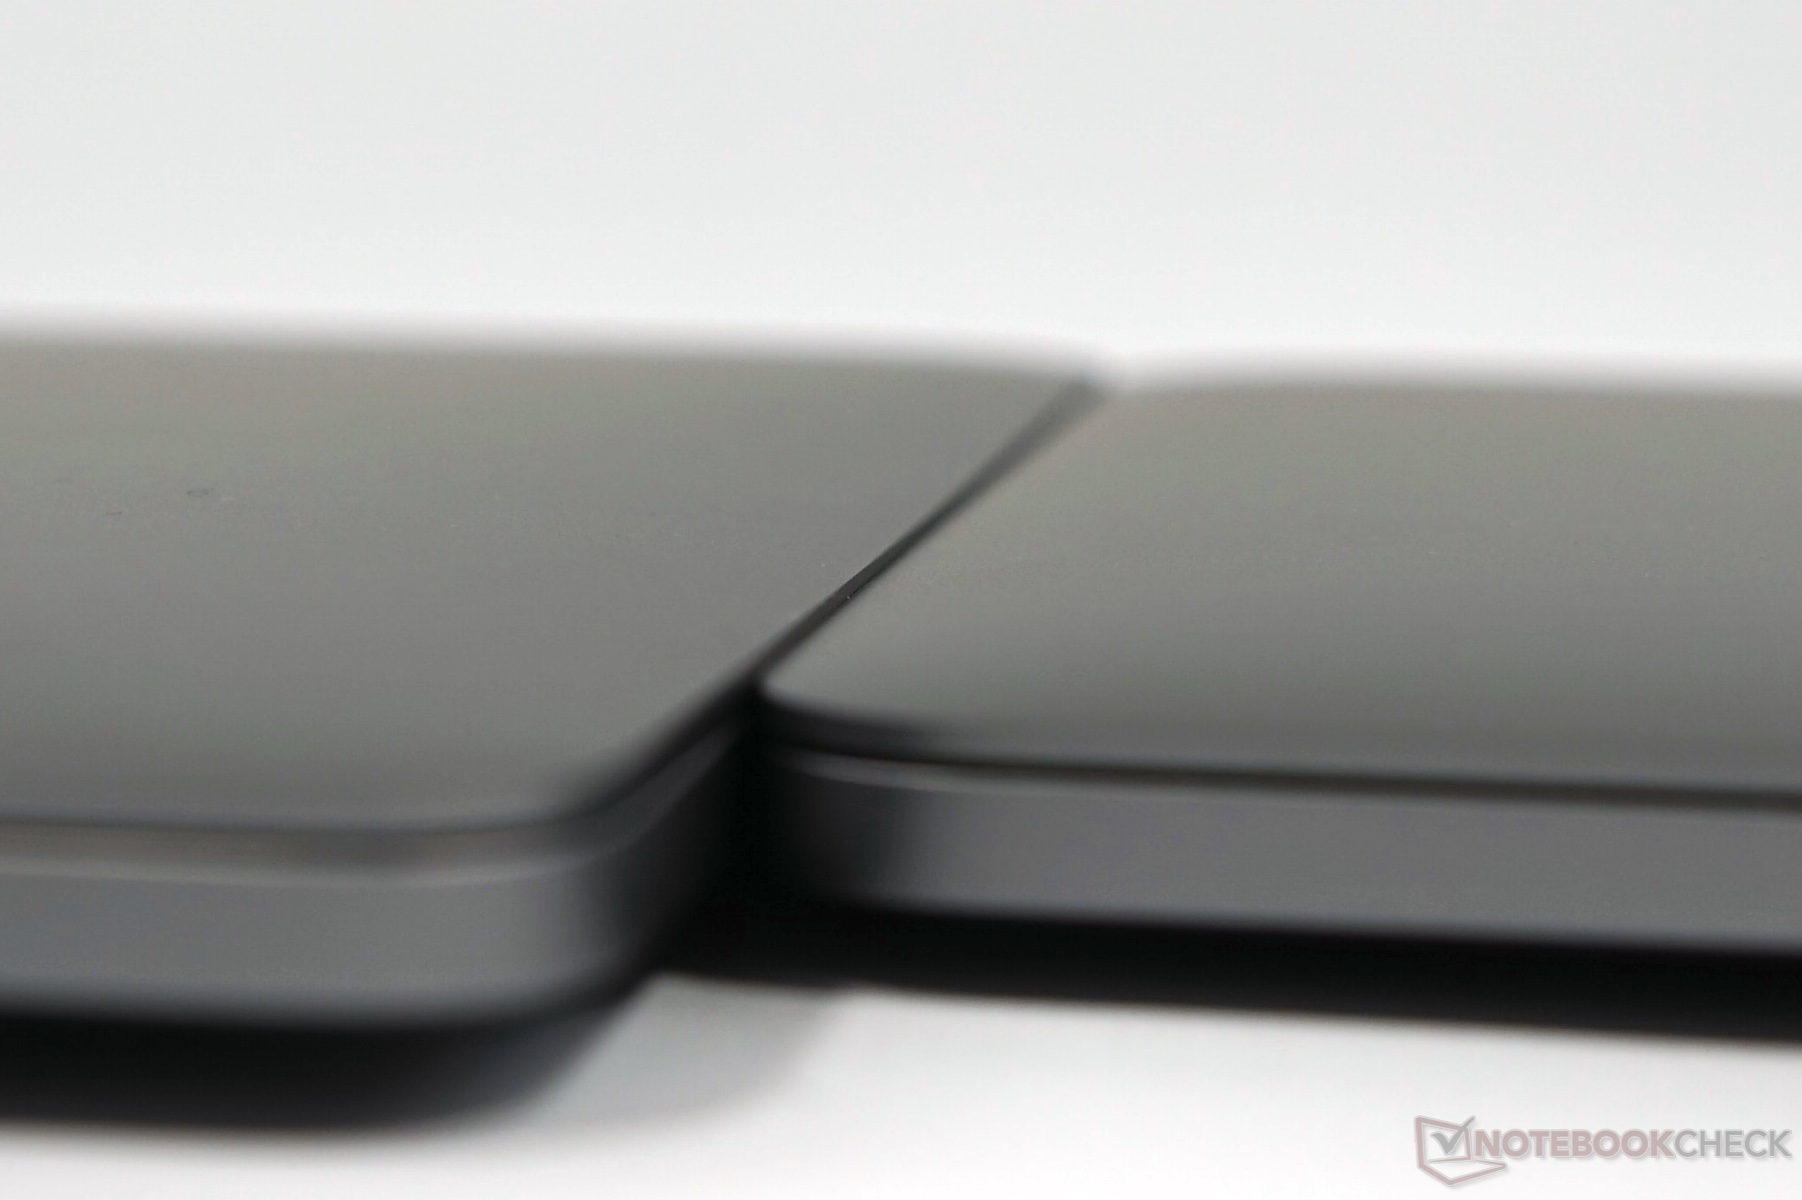
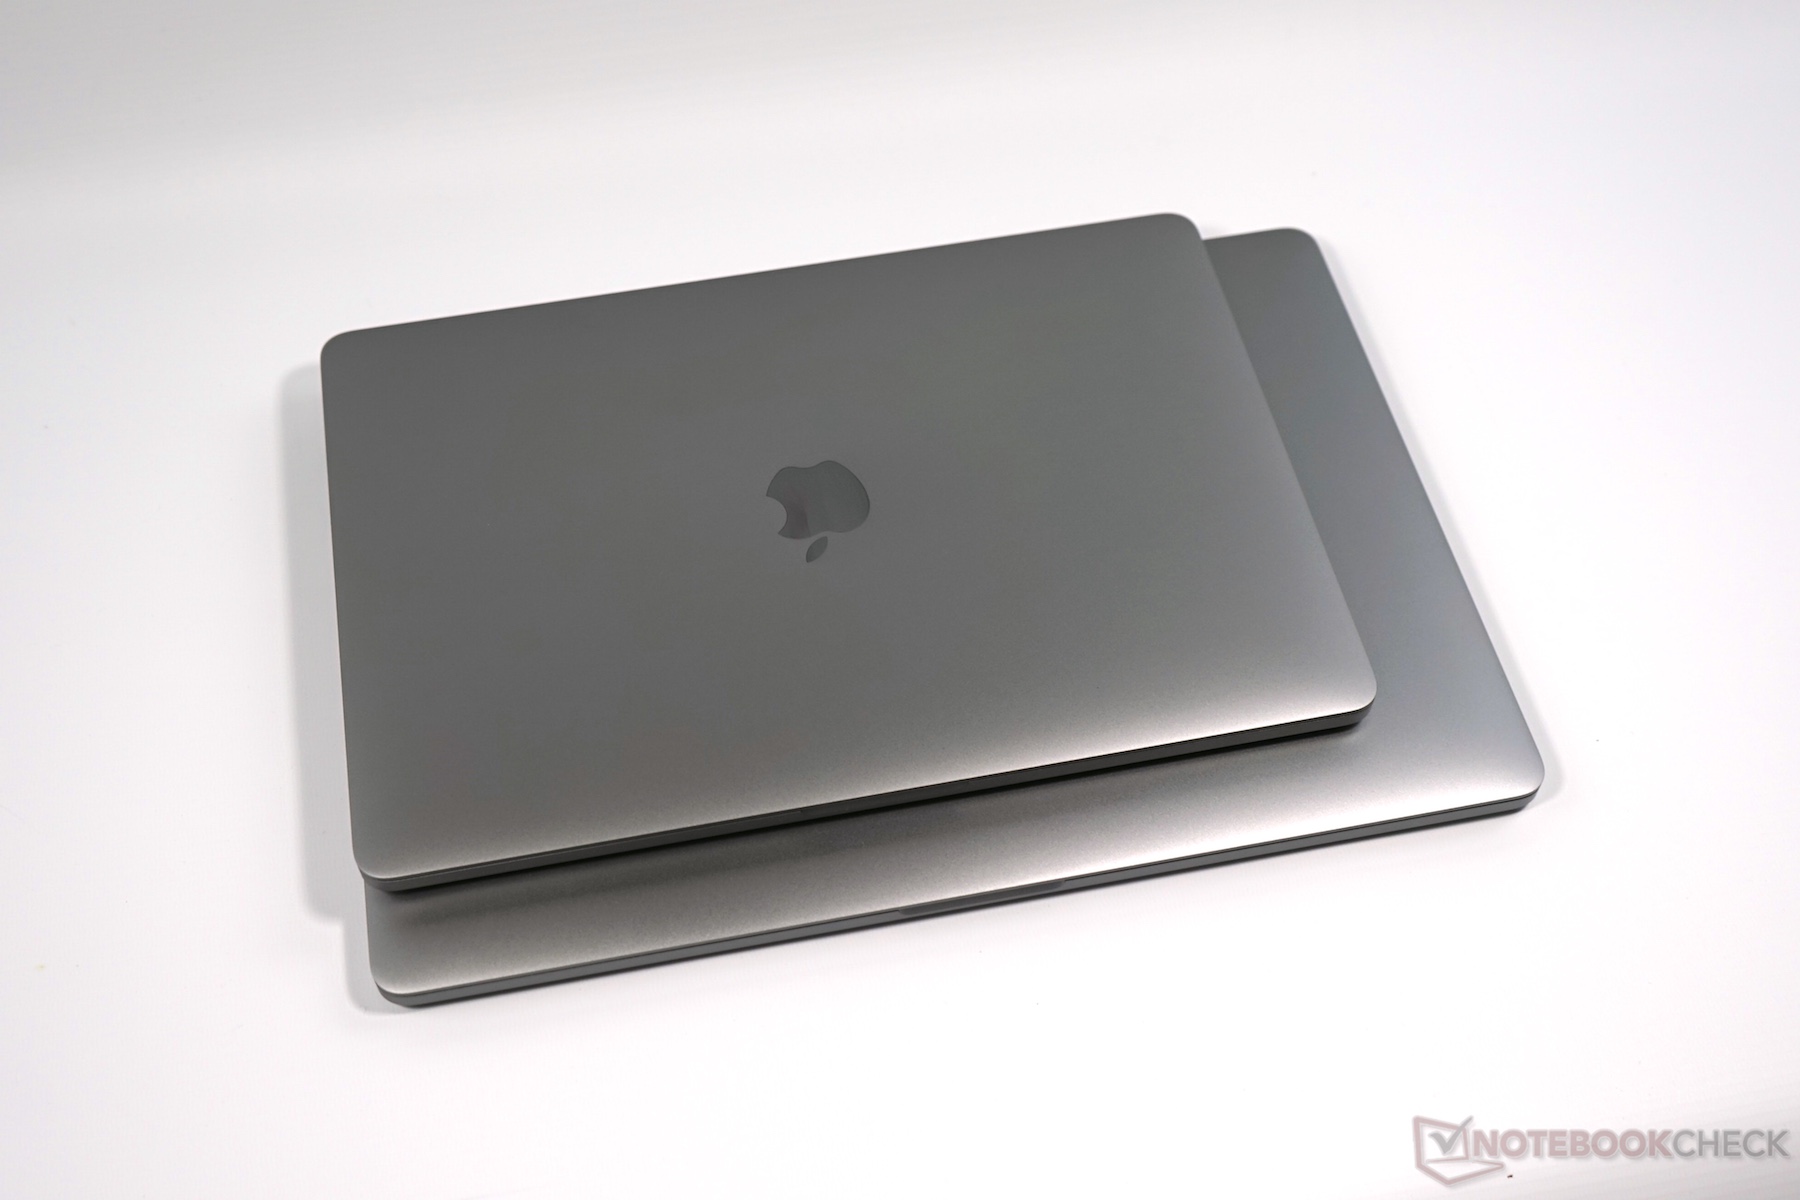
You still notice the age of the case as soon as you start to compare the weight and the dimensions, respectively. The MacBook Pro 13 is hardly a brick at little more than 1.3 kg and not bulky, either, but the competition caught up over the last years and sometimes even surpassed Apple. There are more and more devices with slimmer bezels, which enables larger display, and the weight is going down as well.
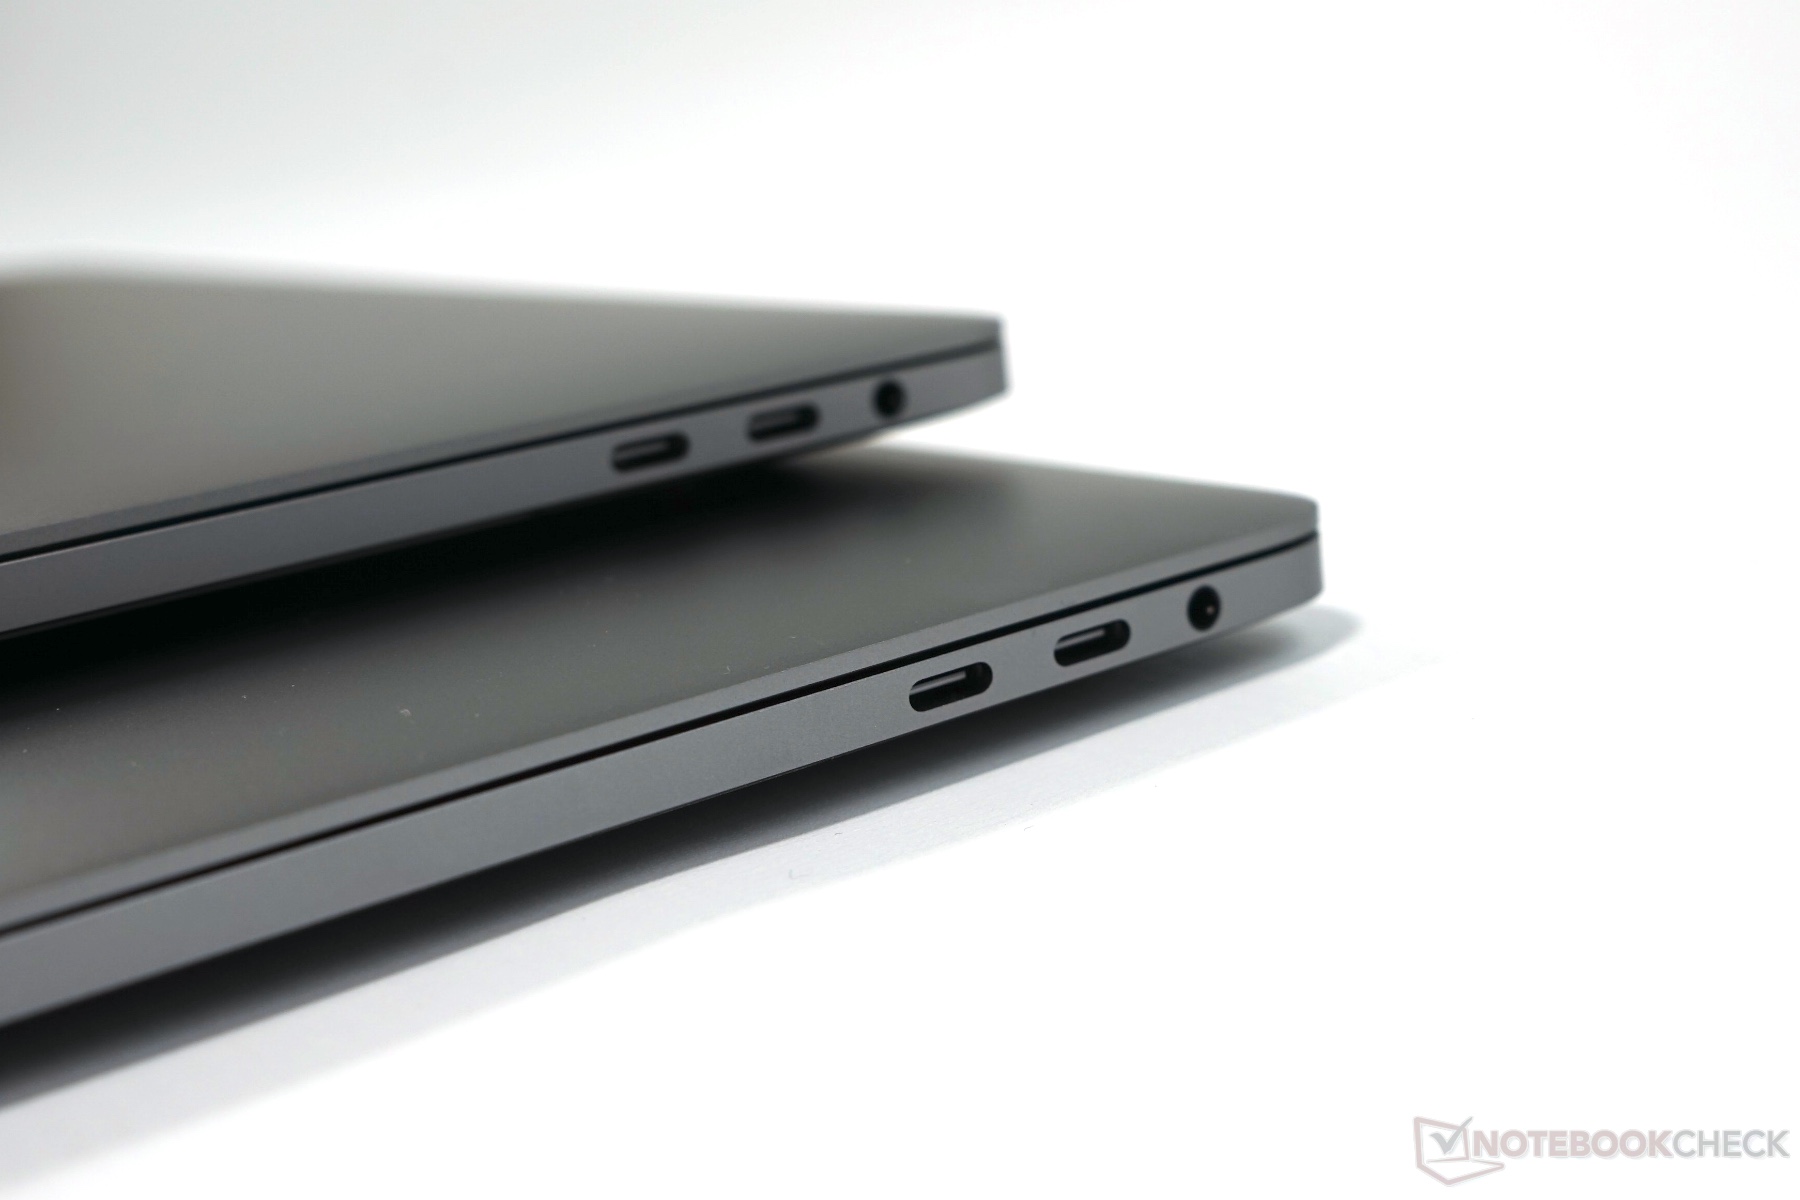
Connectivity
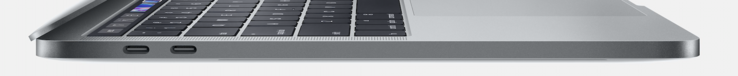
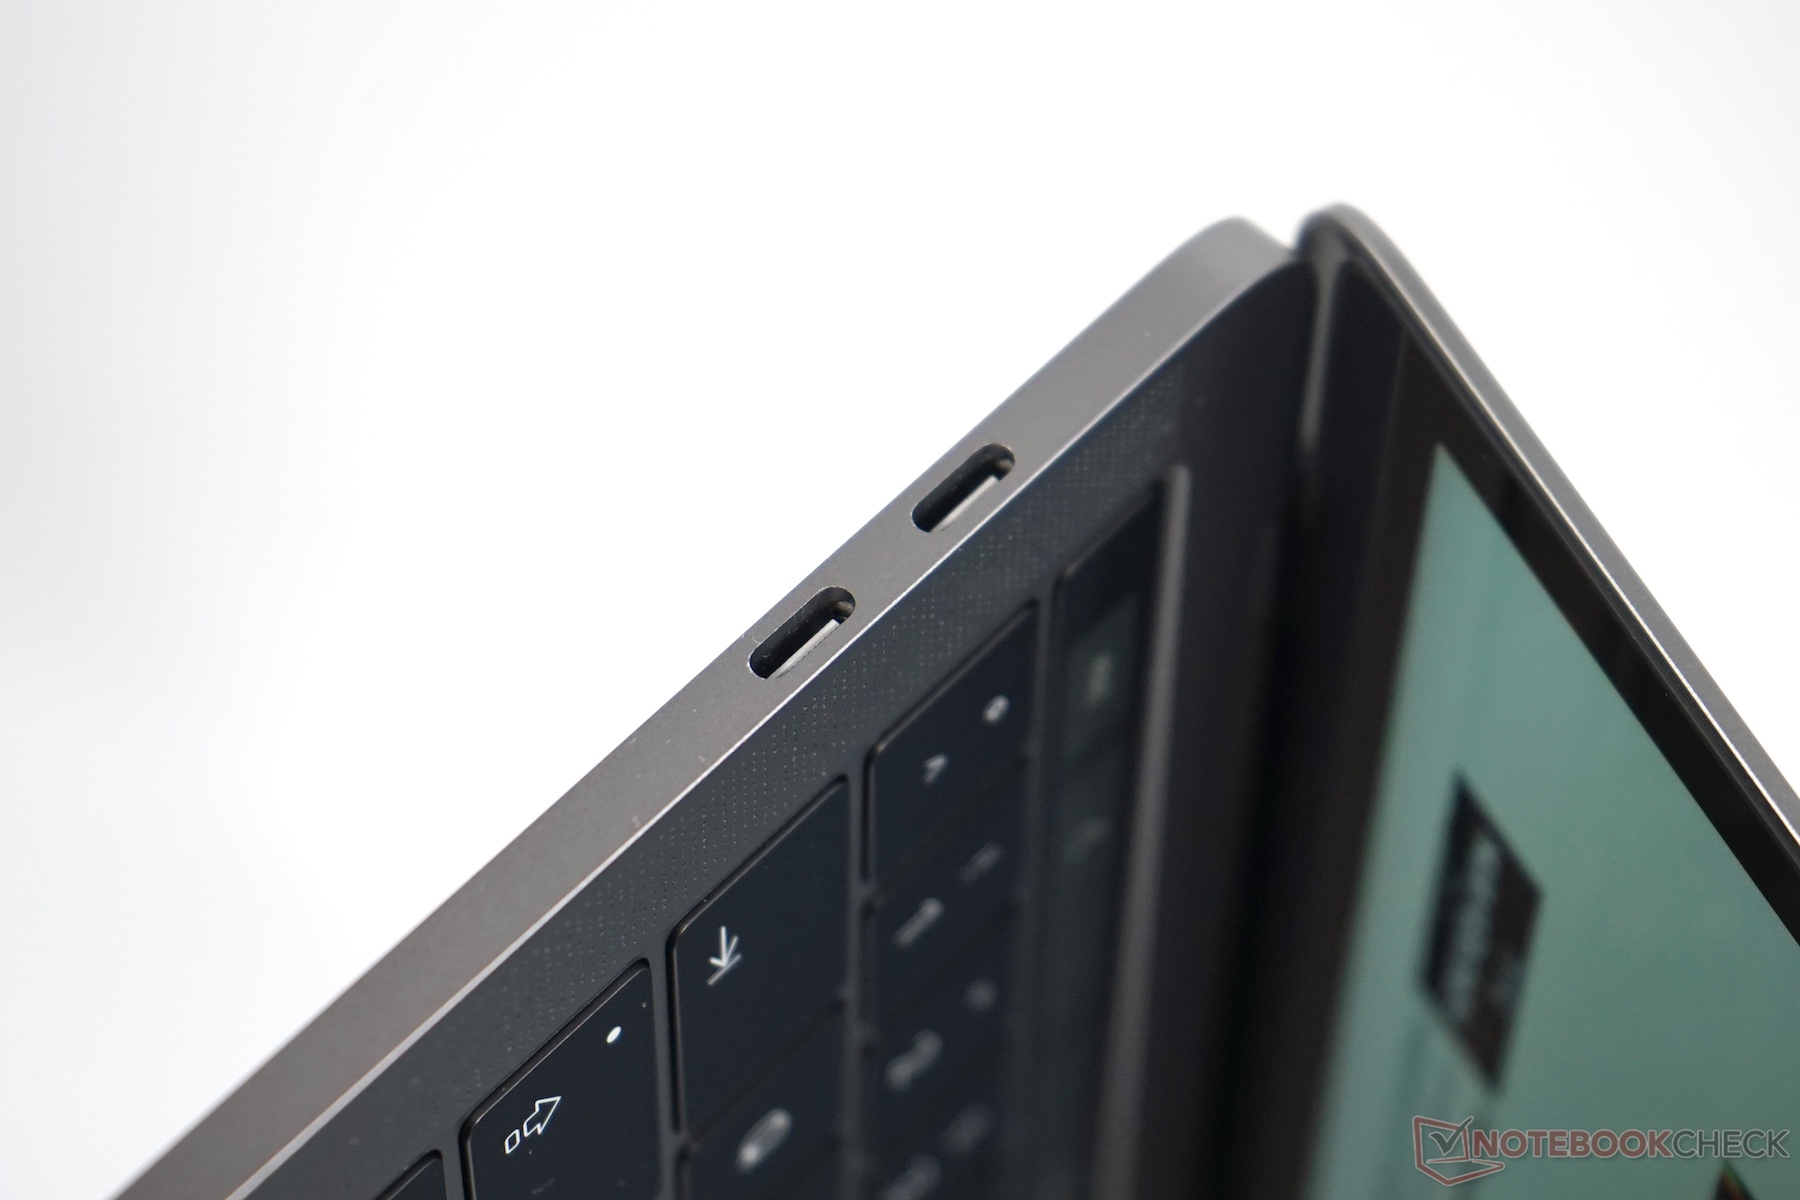
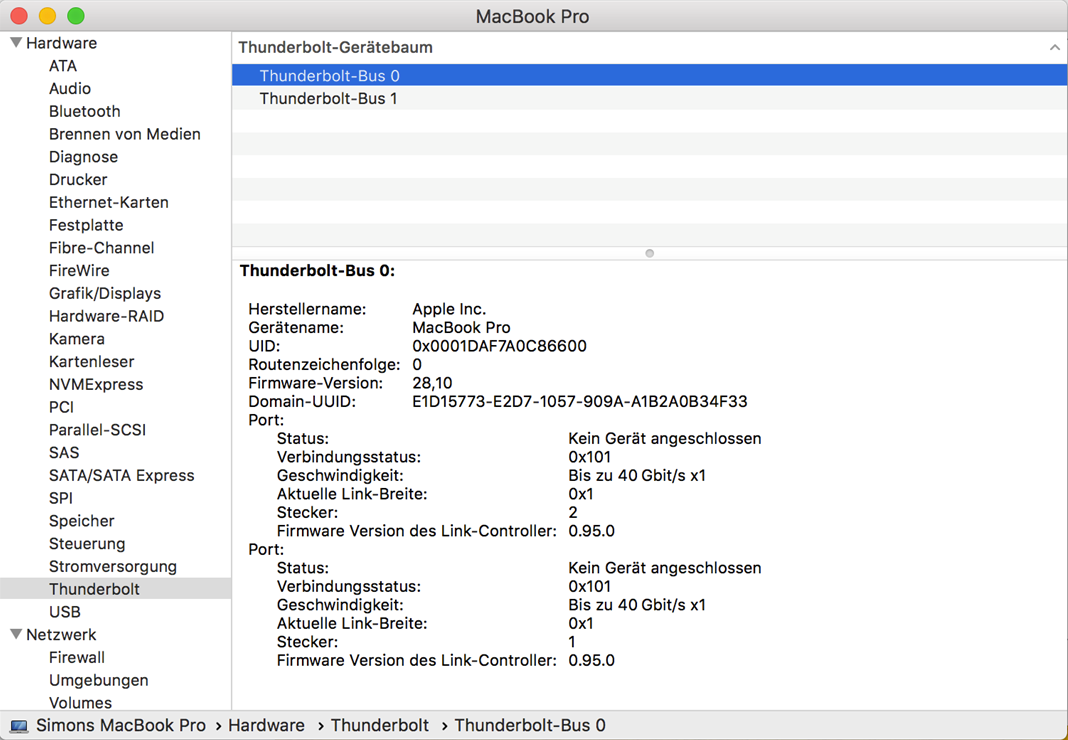
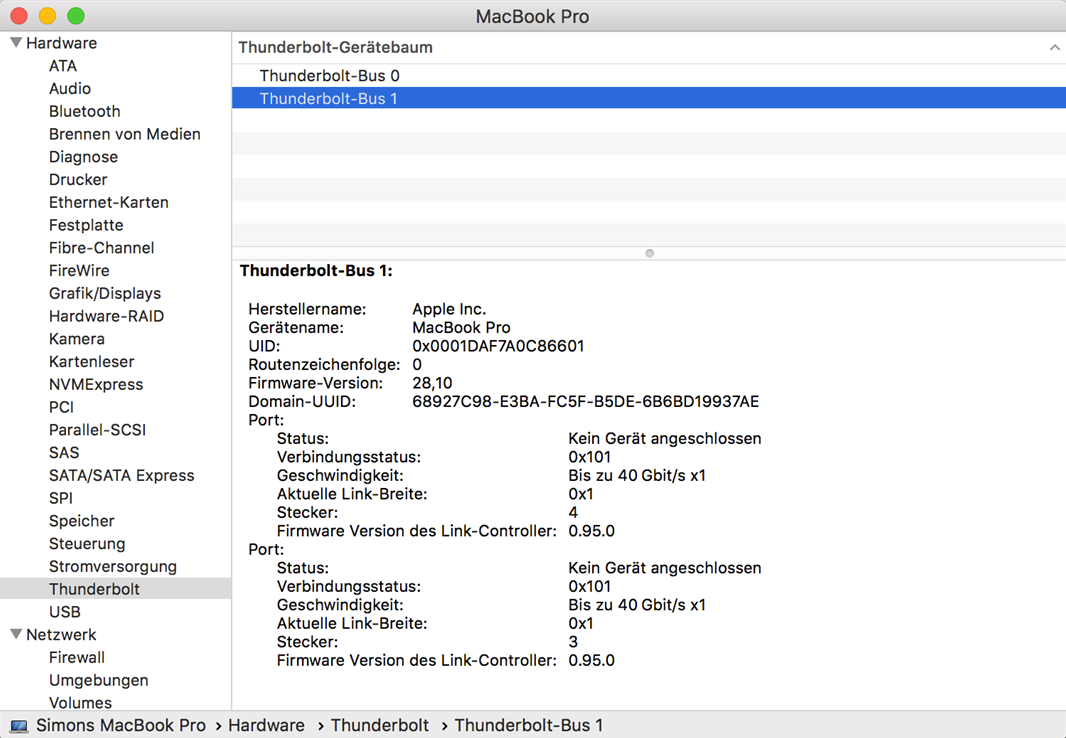
The basic connectivity did not change and you still get 4x Thunderbolt 3 ports with USB Type-C connectors as well as a 3.5 mm stereo jack. The switch to Coffee Lake-U CPUs provides more PCIe lanes though, so all ports are operated with full speed (the two ports on the right side were previously limited to 2x speed). There are more and more USB-C devices, but you will probably still need adapters in practice.
We noticed WLAN connectivity issues in certain scenarios with the previous Apple MacBook Pro models when you attached multiple USB-C devices. We noticed some incidents with lost packages and higher ping times on the 2018 model, but the connection was not interrupted.
Communication
The communication module of the new MacBook Pro was updated as well. The biggest change is the support for Bluetooth 5.0, but the transfer rates of the WLAN module (especially while transmitting data) is worse compared to last year's model.
Apple customers still do not get a WWAN module; Apple focuses on the combination with smartphones instead.
Security
Apple equips the 2018 MacBook Pro with its own T2 chip, which combines several functions including storage encryption and secure boot features. The user does not notice anything though. The access to the laptop is still secured by the Touch-ID fingerprint scanner, which is quick and reliable.
Warranty
Apple only ships its devices with a 12-month warranty, despite the high price. It is possible to extend the warranty to 36 months (Apple Care Protection Plan), which costs 249 Euros. An on-site service, which is available from companies like Dell, HP, or Lenovo, however, is not included. Please see our Guarantees, Return policies and Warranties FAQ for country-specific information.
Input Devices - Butterfly with silicone buffers
Keyboard
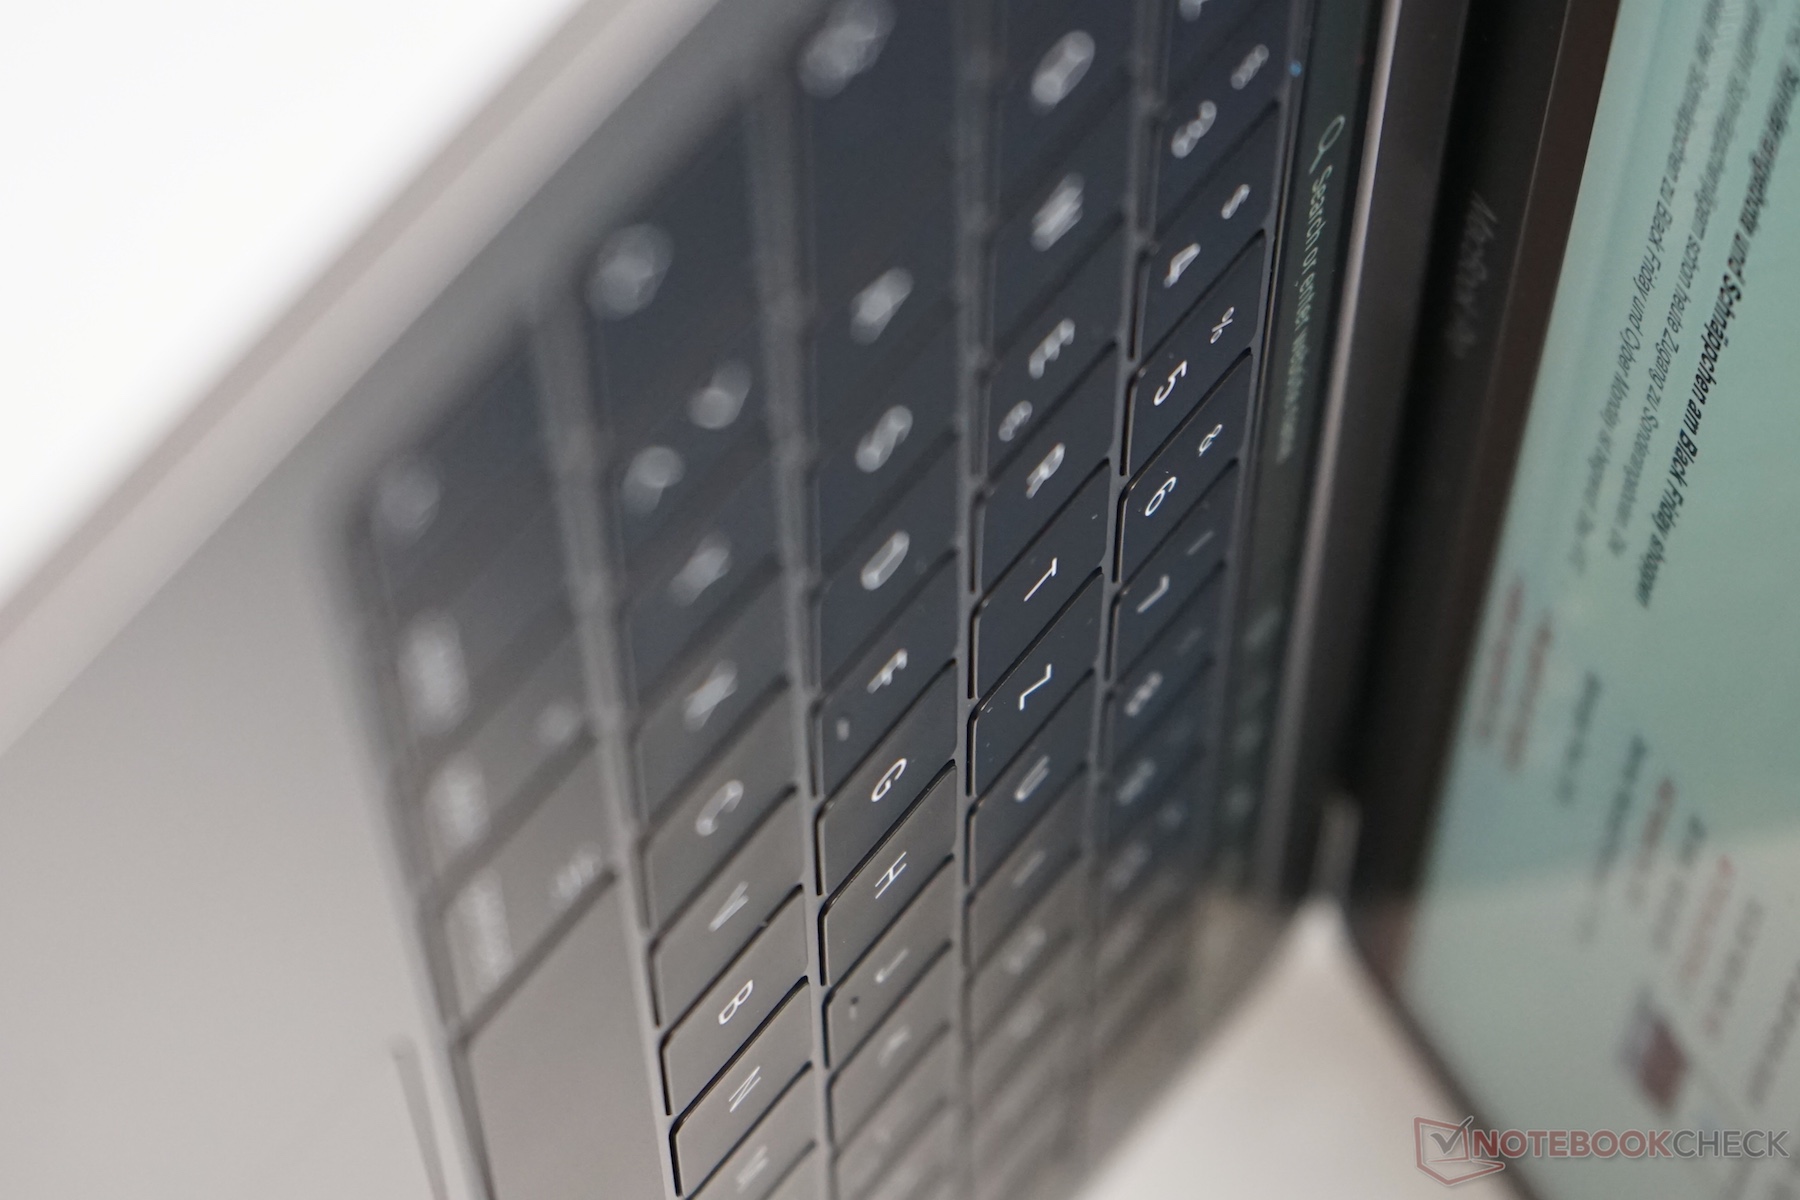
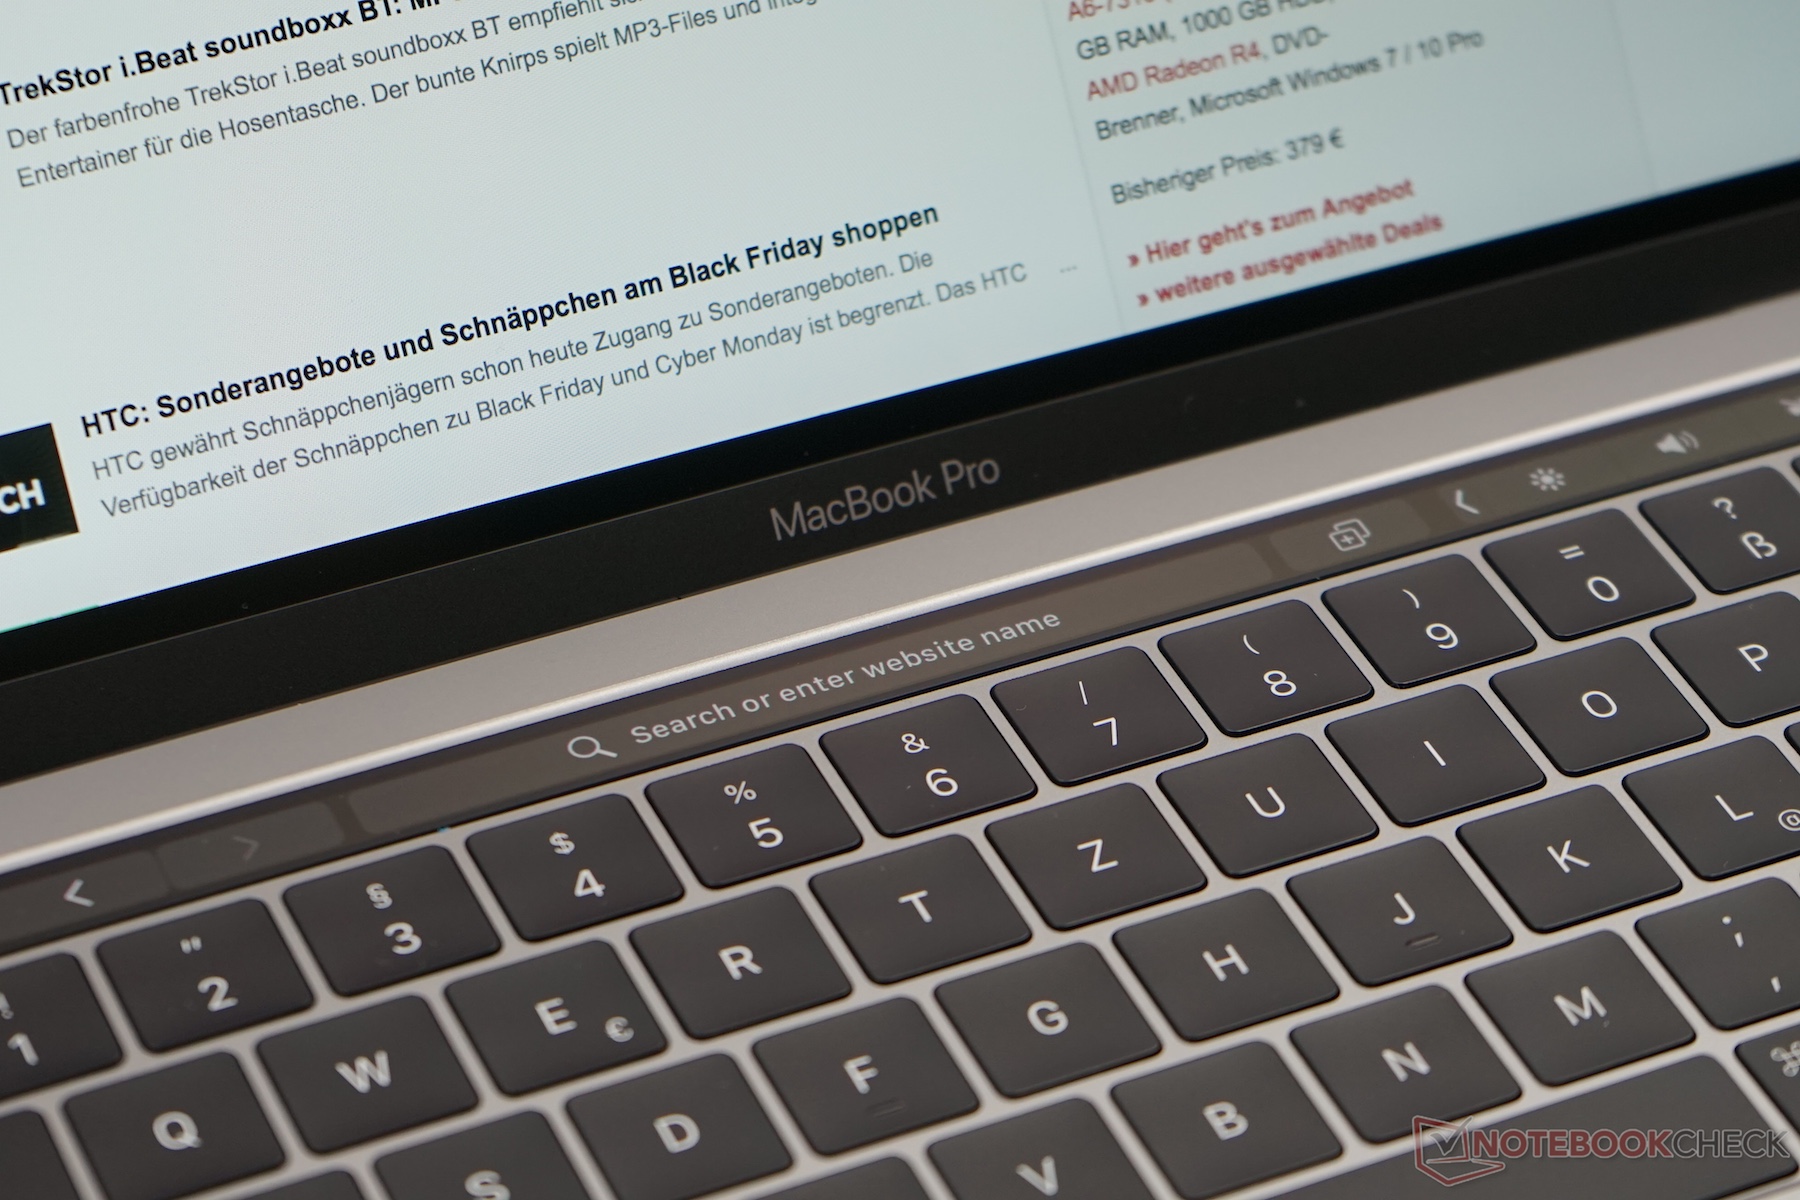
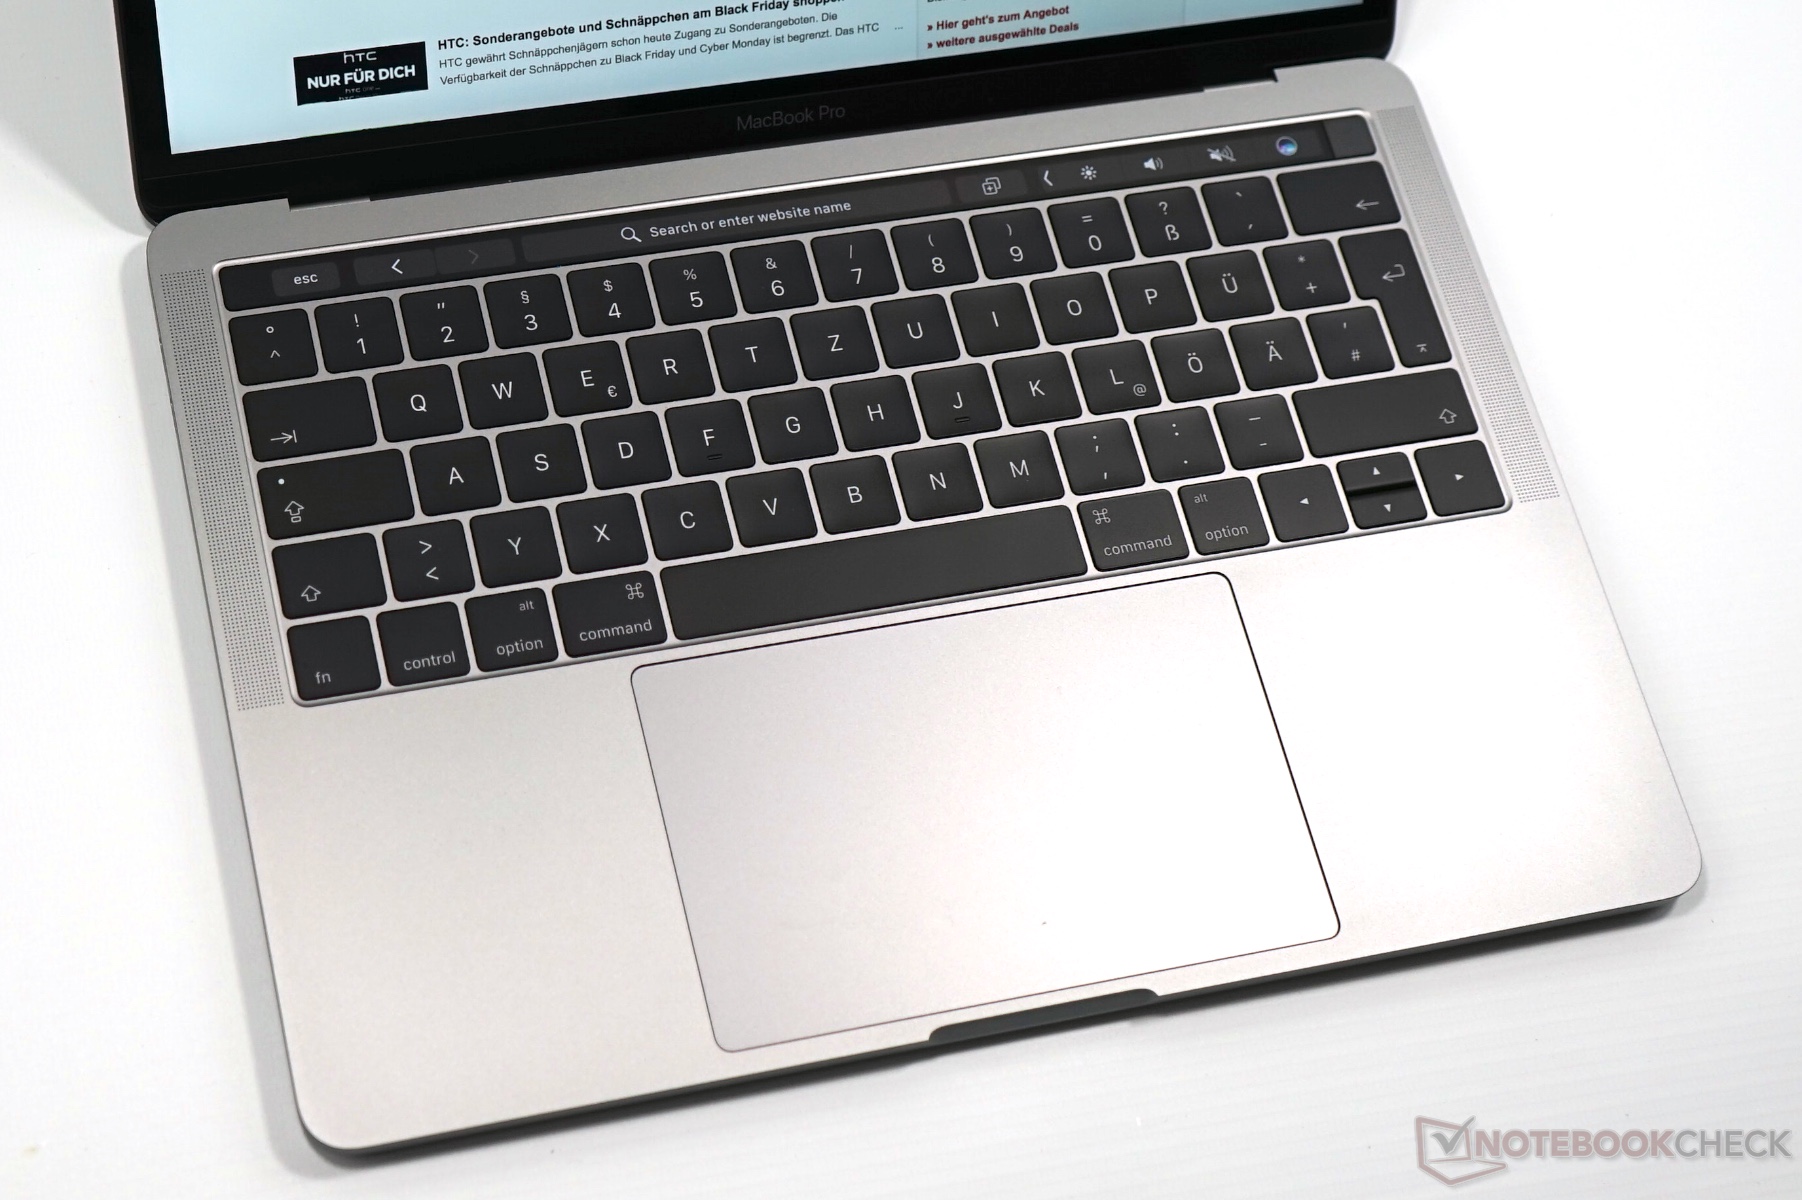
There have been a lot of discussions about the keyboard on the current MacBook Pro lineup. Apple uses keys with a very shallow travel to realize the slim base unit. The manufacturer uses its own Butterfly keys with very precise (and loud) key strokes, but the typing experience is just not comfortable for every user. The integrated background illumination is a major advantage, and its intensity can be adjusted in 15 steps. It is also automatically adjusted to the environment. The latter sounds like nothing special, but it is unfortunately not supported by the majority of Windows laptops.
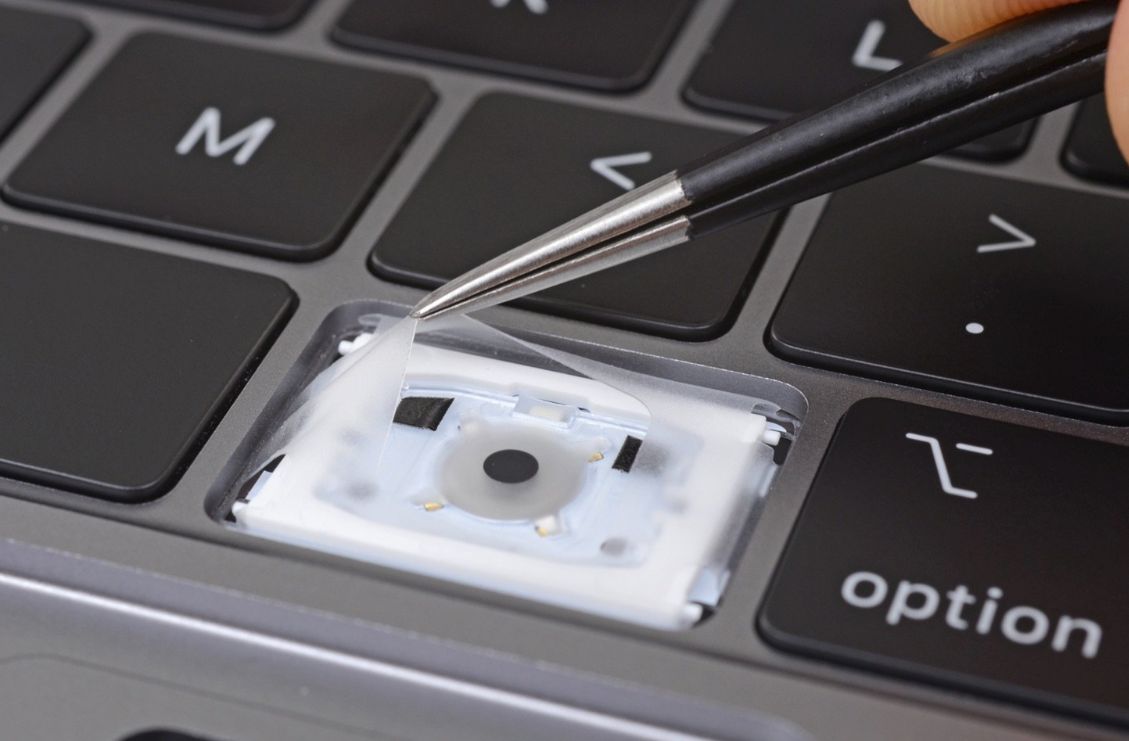
Then there is the problem with defective keyboards on the MacBook Pros, and Apple even introduced a special repair program. Even small objects (dirt, crumbs, etc.) can result in problems (keys won't work anymore). Apple did not mention this issue when they announced the 2018 models, but advertised a quieter keyboard. Our colleagues from iFixit already disassembled a 2018 model and found a new silicone membrane underneath the keys. They ensure a quieter typing noise, but also seem to prevent the intrusion of dirt, so it might be an reaction to the problems after all. We can obviously not check whether this solution works in the long term.
Subjectively, you will notice a distinct difference between the old keyboard (like on the 2017 MacBook Pro 15) and the new one. The key stroke is muffled and not as light as before. The noise difference, however, is only noticeable when you really hammer on the keys. Overall, it is hard to say whether the key stroke is improved, but it will once again take some time before you are used to the new keys.
Update: Internal service documents from Apple confirm that the new membrane is supposed to prevent debris from entering the butterfly keys.
Touchpad & Touch Bar
The big trackpad did not change this year. It is still the benchmark among touchpads and is easy to use. Even gestures with multiple fingers are no problem thanks to the large surface area. Basic controls also work well running on Windows (Bootcamp), but the drivers are not as well optimized as for Apple's own operating system. Drag-&-drop commands in particular are more complicated.
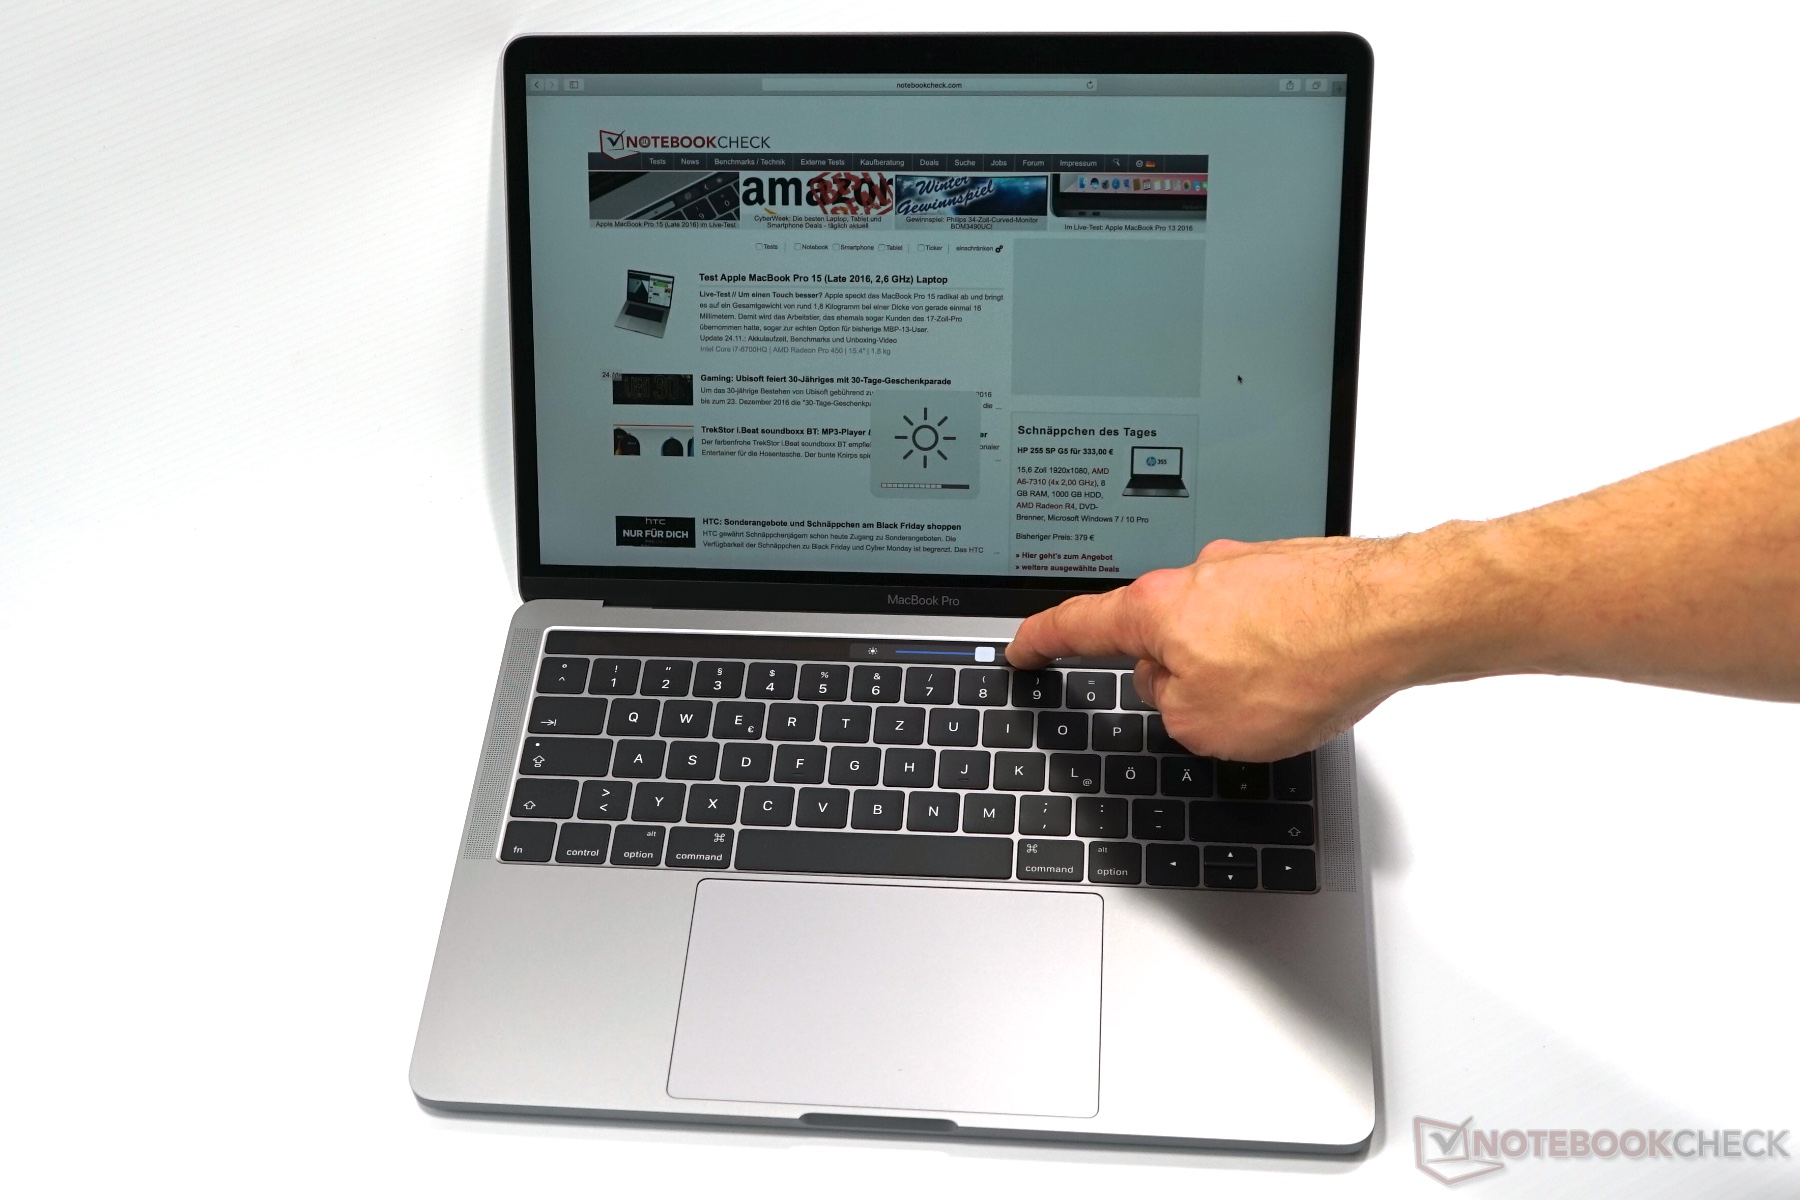
You also still get the Touch Bar above the keyboard, which can show different contents based on the application. It shows basic controls like brightness or volume by default, but you can also display the standard function keys (F1-F12). Whether the Touch Bar improves the productivity mainly depends on the software support.
Display - MacBook Pro 2018 adds TrueTone
The basic specs of the 13.3-inch IPS screen did not change this year: 2560 x 1600 pixels (227 PPI) aka Retina display, 500 nits brightness, and full P3 color gamut. The TrueTone support is the only new feature and we already know it from the iPhone or iPad, respectively. The white balance automatically adjusts according to the color temperature of the ambient light, which is supposed to create a more natural picture. The manual Night Shift mode, which reduces blue color contents, is still available. The latter can also be adjusted in the settings (automatic activation depending on the time, warmer or cooler picture). True Tone is subjectively very pleasant and you get used to it very quickly.
The display carries the designation APPA03E and differs from the two previous panel IDs (APPA033 and APPA034). We do not know if it is just a panel revision or if a new panel was required for the True Tone functionality.
| |||||||||||||||||||||||||
Brightness Distribution: 95 %
Center on Battery: 524 cd/m²
Contrast: 1573:1 (Black: 0.33 cd/m²)
ΔE Color 1.4 | 0.5-29.43 Ø5
ΔE Greyscale 2.2 | 0.57-98 Ø5.3
99.99% sRGB (Argyll 1.6.3 3D)
77.3% AdobeRGB 1998 (Argyll 1.6.3 3D)
87.3% AdobeRGB 1998 (Argyll 2.2.0 3D)
99.9% sRGB (Argyll 2.2.0 3D)
98.5% Display P3 (Argyll 2.2.0 3D)
Gamma: 2.22
| Apple MacBook Pro 13 2018 Touchbar i5 APPA03E, , 2560x1600, 13.30 | Apple MacBook Pro 13 2017 Touchbar i5 APPA034, , 2560x1600, 13.30 | Apple MacBook Pro 13 2017 APPA033, , 2560x1600, 13.30 | Lenovo ThinkPad X1 Carbon 2018-20KGS03900 B140QAN02.0, , 2560x1440, 14.00 | Dell XPS 13 9370 i7 UHD ID: Sharp SHP148B, Name: LQ133D1, Dell P/N: 8XDHY, , 3840x2160, 13.30 | Huawei Matebook X Pro i5 Tianma XM, , 3000x2000, 13.90 | |
|---|---|---|---|---|---|---|
| Display | -0% | 0% | 1% | -17% | -20% | |
| Display P3 Coverage | 98.5 | 98.6 0% | 99.2 1% | 87.7 -11% | 68.9 -30% | 65.9 -33% |
| sRGB Coverage | 99.9 | 100 0% | 99.9 0% | 100 0% | 98.4 -2% | 95.2 -5% |
| AdobeRGB 1998 Coverage | 87.3 | 86.5 -1% | 87.1 0% | 99.9 14% | 69.5 -20% | 67.6 -23% |
| Response Times | -3% | 9% | -19% | -62% | 16% | |
| Response Time Grey 50% / Grey 80% * | 46 ? | 48 ? -4% | 42.8 ? 7% | 59.2 ? -29% | 69.6 ? -51% | 40.4 ? 12% |
| Response Time Black / White * | 32 ? | 33.6 ? -5% | 28.8 ? 10% | 34.4 ? -8% | 44 ? -38% | 25.6 ? 20% |
| PWM Frequency | 118000 ? | 119000 ? 1% | 3759 ? -97% | |||
| Screen | 10% | -6% | -11% | -34% | -63% | |
| Brightness middle | 519 | 551 6% | 588 13% | 578 11% | 478.5 -8% | 442.7 -15% |
| Brightness | 504 | 514 2% | 561 11% | 533 6% | 466 -8% | 428 -15% |
| Brightness Distribution | 95 | 88 -7% | 92 -3% | 84 -12% | 86 -9% | 84 -12% |
| Black Level * | 0.33 | 0.48 -45% | 0.45 -36% | 0.38 -15% | 0.43 -30% | 0.31 6% |
| Contrast | 1573 | 1148 -27% | 1307 -17% | 1521 -3% | 1113 -29% | 1428 -9% |
| Colorchecker dE 2000 * | 1.4 | 0.8 43% | 1.7 -21% | 1.9 -36% | 3.09 -121% | 2.24 -60% |
| Colorchecker dE 2000 max. * | 2.8 | 1.4 50% | 3.5 -25% | 3.8 -36% | 5.94 -112% | 7.19 -157% |
| Greyscale dE 2000 * | 2.2 | 1 55% | 1.9 14% | 3 -36% | 2.4 -9% | 9.7 -341% |
| Gamma | 2.22 99% | 2.16 102% | 2.33 94% | 2.14 103% | 2.063 107% | 1.42 155% |
| CCT | 6908 94% | 6672 97% | 6738 96% | 6377 102% | 6883 94% | 6227 104% |
| Color Space (Percent of AdobeRGB 1998) | 77.3 | 77.92 1% | 88.8 15% | 69.47 -10% | 61.6 -20% | |
| Color Space (Percent of sRGB) | 99.99 | 99.94 0% | 100 0% | 98.36 -2% | 95 -5% | |
| Colorchecker dE 2000 calibrated * | 0.8 | 2.06 | 1.11 | |||
| Total Average (Program / Settings) | 2% /
5% | 1% /
-3% | -10% /
-9% | -38% /
-36% | -22% /
-44% |
* ... smaller is better
Our test model of the MacBook Pro manages an average luminance of little more than 500 nits. This means it meets the advertised value, but our two 2017 test devices (especially the non-Touch Bar MBP 13) were even brighter. However, we also see improvements for the brightness distribution as well as the black value (0.33). Black contents appear richer and the contrast ratio was increased as well (>1573:1).
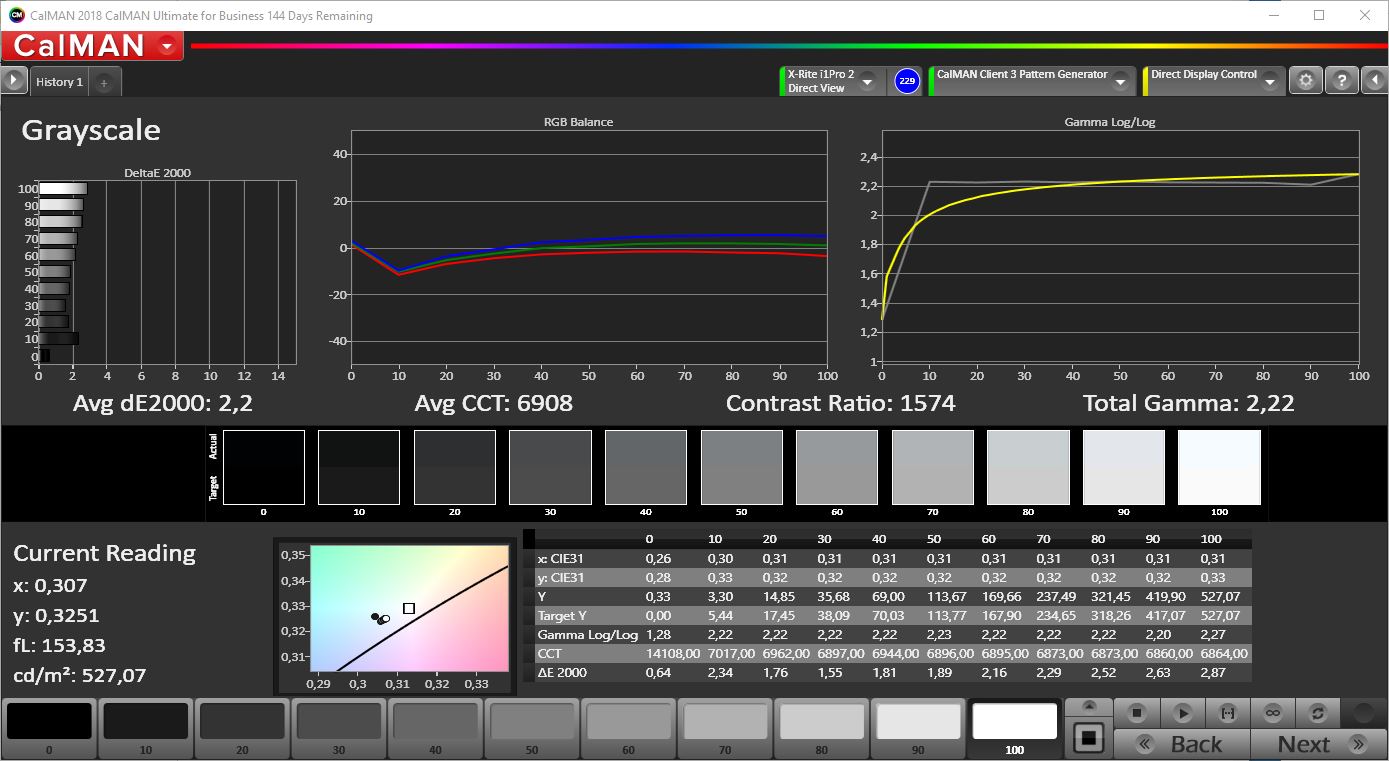
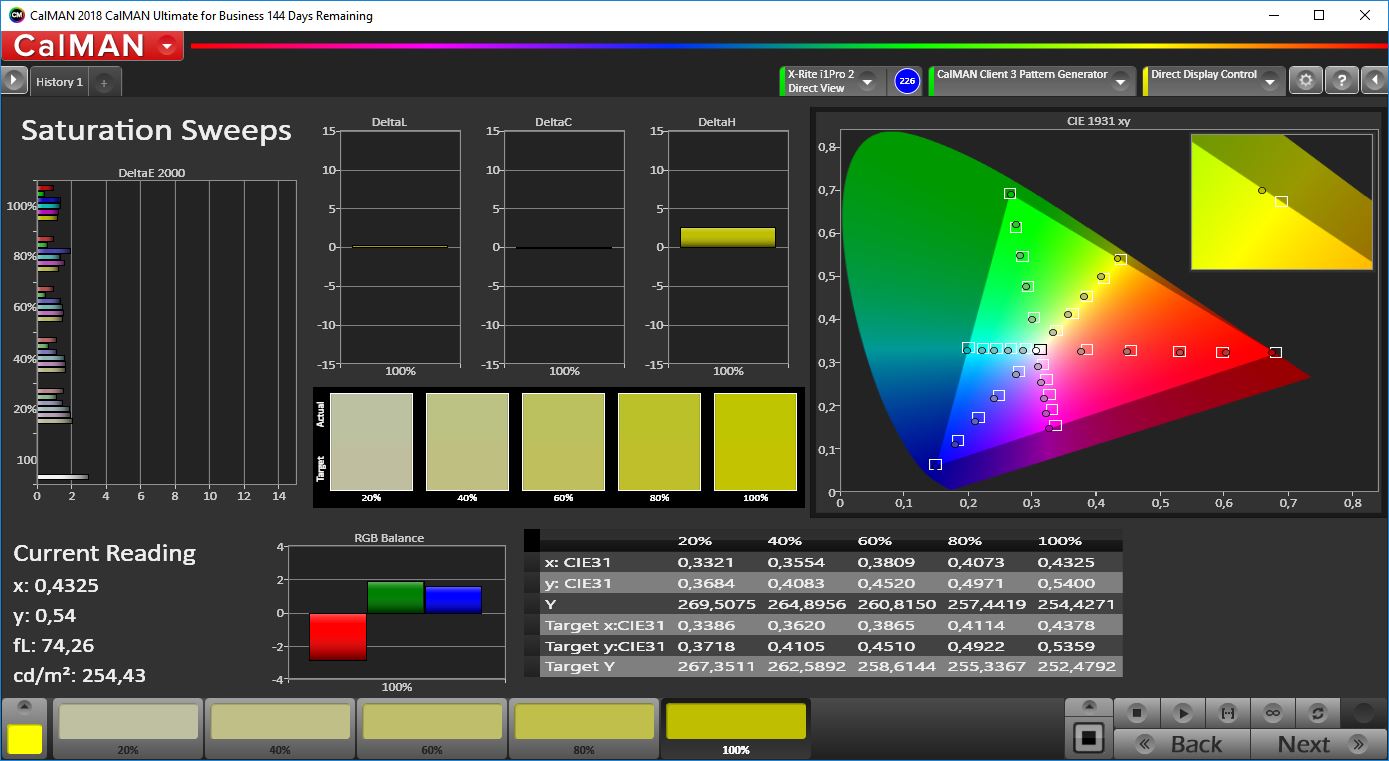
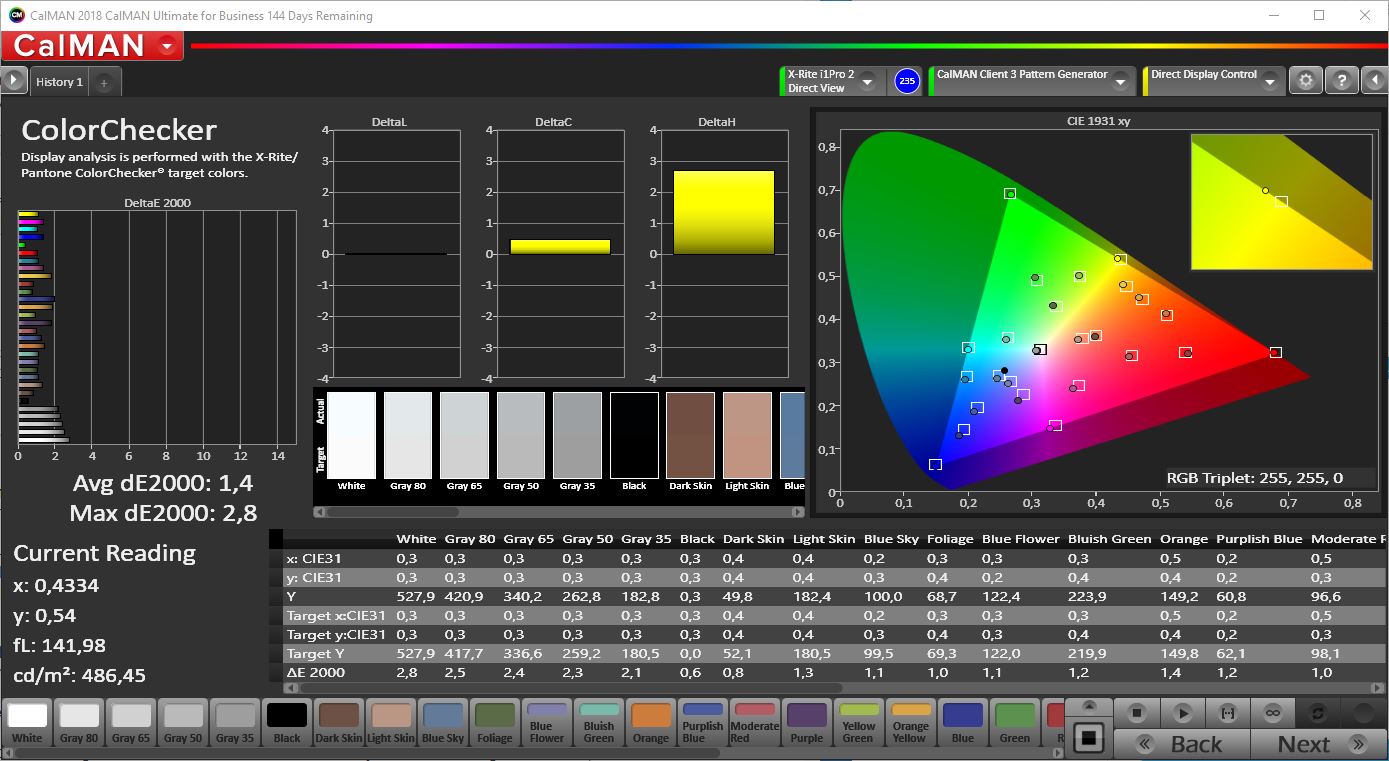
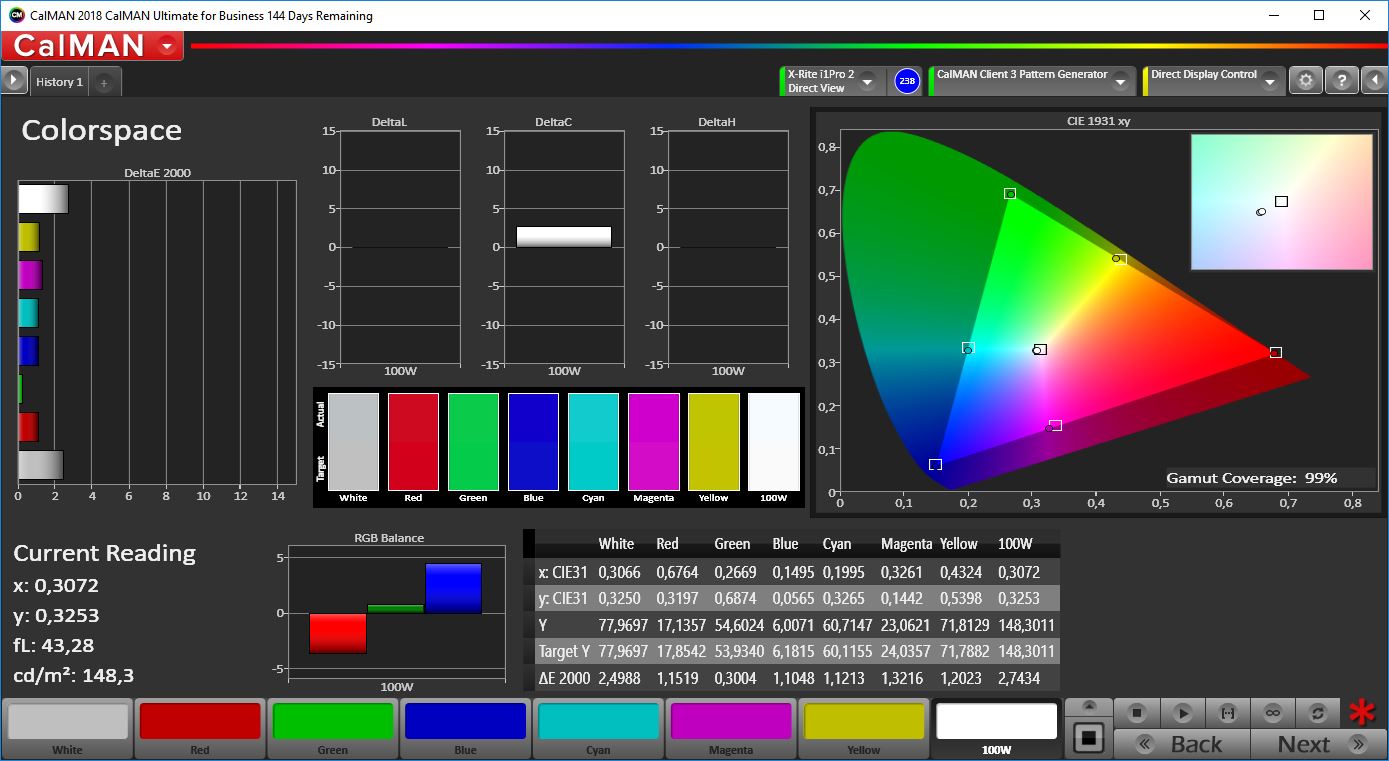
The factory calibration is also a bit worse compared to last year, at least compared to the Touch Bar model. However, we are criticizing on a very high level here, because all the deviations (compared to the P3 reference) are already below the important mark of 3. CalMAN determines 99% P3 coverage. The smaller sRGB gamut is completely covered as well, and the wider AdobeRGB reference by 77 %. These values are similar to last year's model.
Display Response Times
| ↔ Response Time Black to White | ||
|---|---|---|
| 32 ms ... rise ↗ and fall ↘ combined | ↗ 17 ms rise | 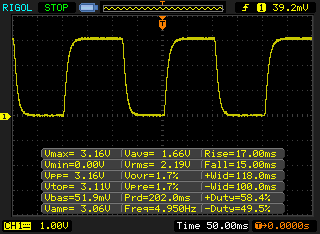 |
| ↘ 15 ms fall | ||
| The screen shows slow response rates in our tests and will be unsatisfactory for gamers. In comparison, all tested devices range from 0.1 (minimum) to 240 (maximum) ms. » 84 % of all devices are better. This means that the measured response time is worse than the average of all tested devices (21.5 ms). | ||
| ↔ Response Time 50% Grey to 80% Grey | ||
| 46 ms ... rise ↗ and fall ↘ combined | ↗ 21 ms rise | 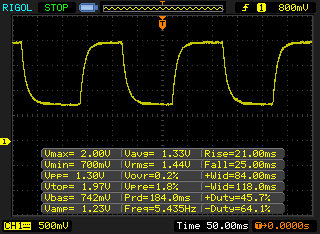 |
| ↘ 25 ms fall | ||
| The screen shows slow response rates in our tests and will be unsatisfactory for gamers. In comparison, all tested devices range from 0.2 (minimum) to 636 (maximum) ms. » 76 % of all devices are better. This means that the measured response time is worse than the average of all tested devices (33.7 ms). | ||
Screen Flickering / PWM (Pulse-Width Modulation)
| Screen flickering / PWM detected | 118000 Hz | ≤ 75 % brightness setting |
| ≤ 150 cd/m² brightness | ||
The display backlight flickers at 118000 Hz (worst case, e.g., utilizing PWM) Flickering detected at a brightness setting of 75 % (150 cd/m²) and below. There should be no flickering or PWM above this brightness setting. The frequency of 118000 Hz is quite high, so most users sensitive to PWM should not notice any flickering. Flickering occurs even at high brightness setting and may have an effect on the user during everyday use. In comparison: 53 % of all tested devices do not use PWM to dim the display. If PWM was detected, an average of 17900 (minimum: 5 - maximum: 3846000) Hz was measured. | ||
Performance - 4 Cores in the MacBook Pro 13
Apple's compact MacBook Pro 13 Touch Bar always used Intel processors with a nominal TDP of 28 Watts, so they had a performance advantage over almost every other subnotebook equipped with the common 15W CPUs. The integrated eDRAM cache is another advantage for the processor, but primarily for the integrated graphics adapter.
This year we get much more performance in multi-thread scenarios thanks to the new quad-core processors. The two available CPUs are also equipped with twice as much eDRAM cache (128 vs. 64 MB), which should improve the performance even further. Apple's devices are usually pretty good in terms of performance utilization, so we are eager to see the results of the new quad-cores.
The Apple MacBook Pro 13 is powerful enough for almost any requirements thanks to the implementation of a native quad-core CPU. Only the GPU performance can be a bottleneck depending on your applications, but it is possible to use external GPUs. We will have a closer look at this topic in the section GPU Performance below.
Apple finally switched to DDR4-RAM in the bigger 15-inch MacBook Pro, but the smaller 13-inch system is still limited to 16 GB LPDDR3-RAM. LPDDR4 is not supported by Coffee Lake-U, and Apple probably did not want to accept the increased power consumption of DDR4-2400.
Processor – Coffee Lake-U disappoints
Almost all new subnotebooks are shipped with Intel's Kaby Lake Refresh CPUs since the end of 2017. They offer four instead of two CPU cores, which improves the multi-core performance dramatically. Apple follows and surpasses the competition thanks to the implementation of Intel's 28W CPUs. However, they are based on the Coffee Lake architecture (Coffee Lake-U), so it is basically a slower Coffee Lake chips instead of a fast Kaby Lake-R model. They also differ in terms of manufacturing process (14nm++ vs. 14 nm+), and the new process already includes updated micro code against Spectre v2.
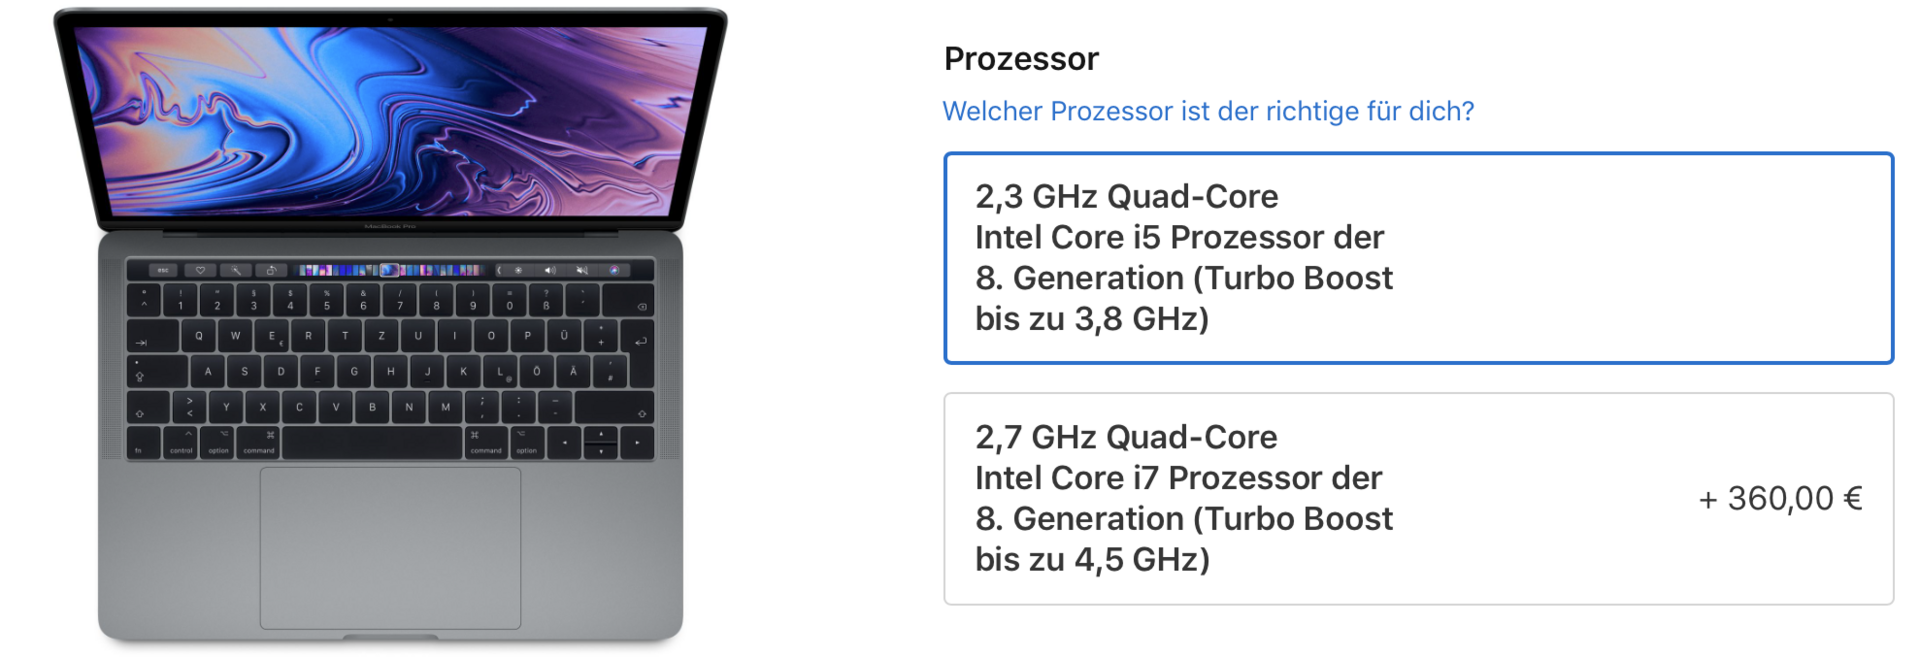
Apple offers two different models from the Coffee Lake-U series: the Intel Core i5-8259U as well as the Core i7-8559U (+360 Euros). The only difference is the clock (CPU and iGPU), because both CPUs are quad-cores including Hyperthreading and without vPro support. Our entry-level spec is equipped with the Core i5 with a base frequency of 2.3 GHz and Turbo speeds of up to 3.8 GHz for two cores (3.6 GHz for four cores). The price is an interesting detail. The difference between the two models is "just" $111 US according to Intel. There are obviously differences for every manufacturer, but the additional charge of 360 Euros for the Core i7 is extremely high.
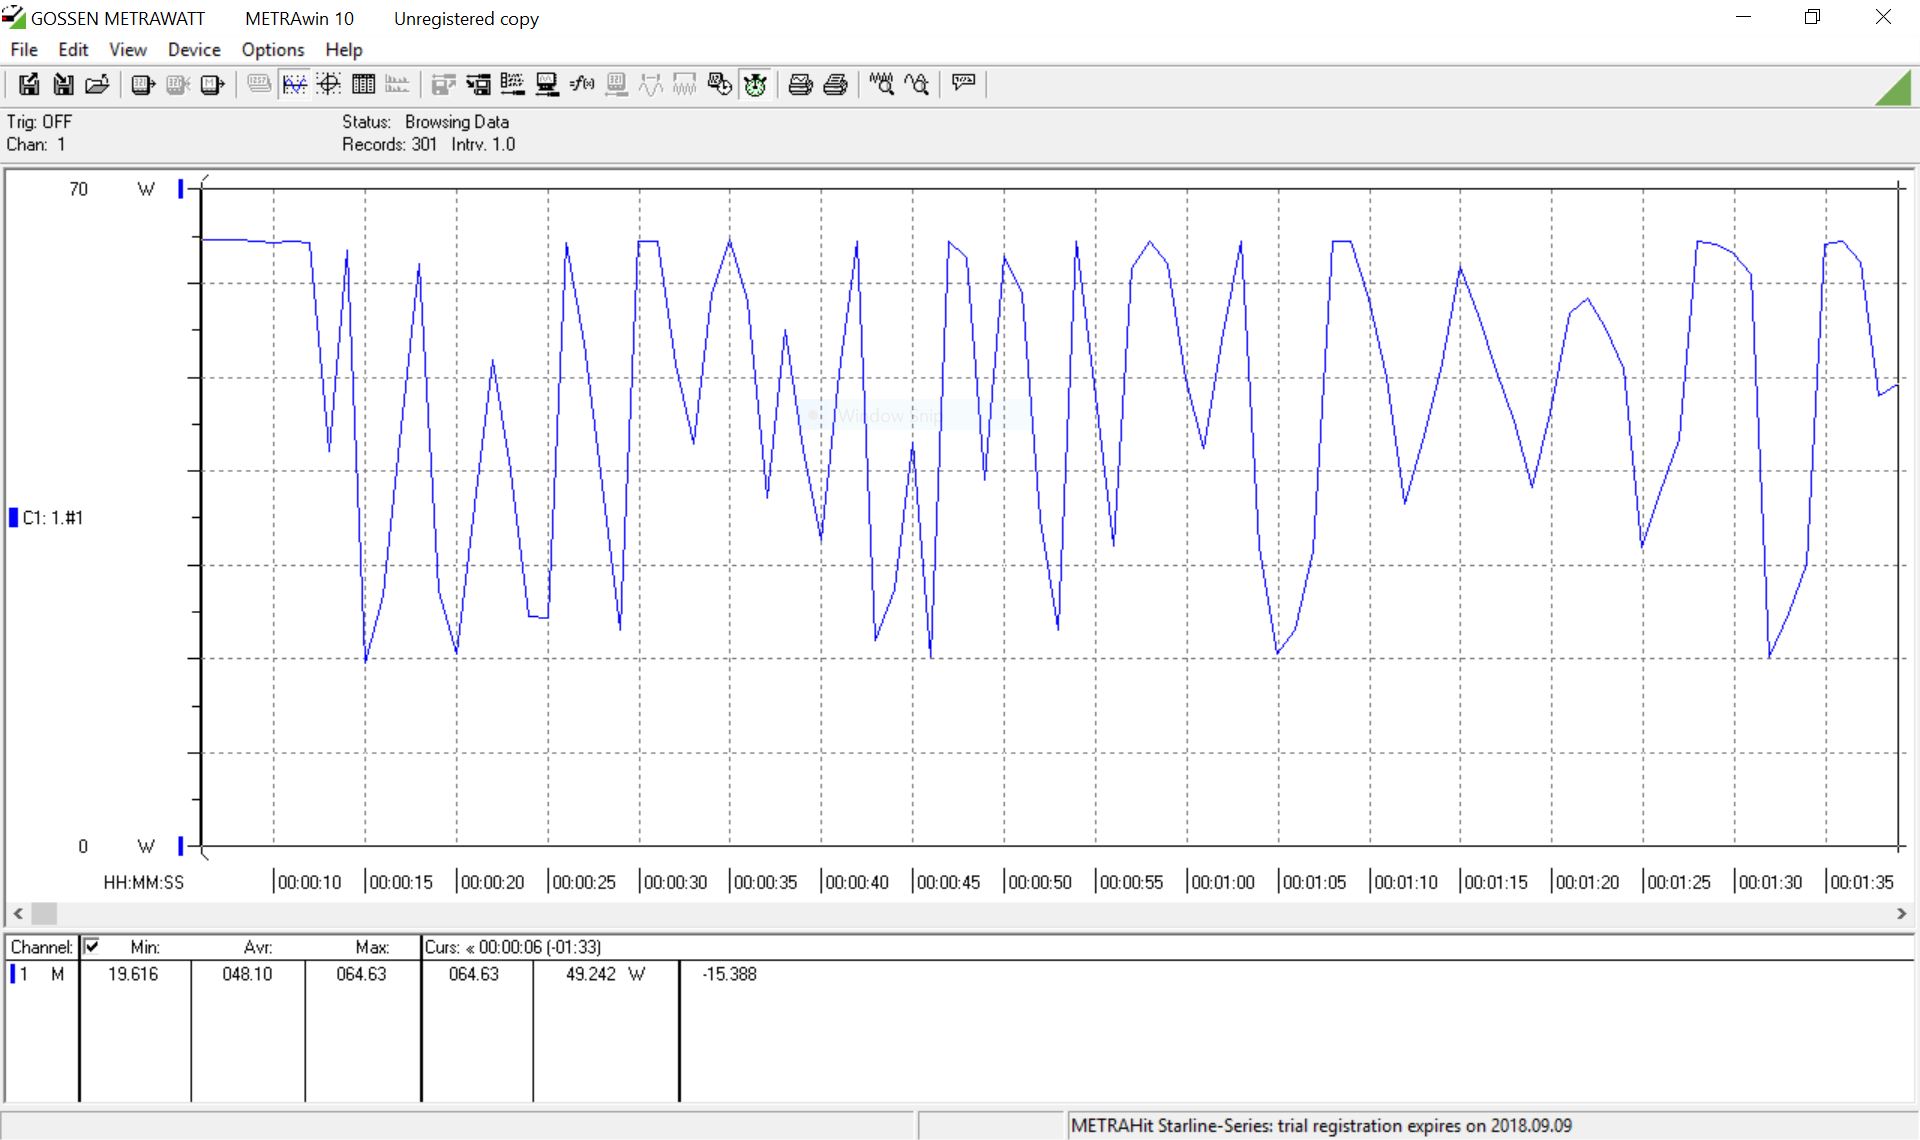
Apple usually removed the TDP limit for Intel processors, so the temperature was the only limiting factor. This is the case here as well, and we can see consumption values of almost 50 Watts. We noticed that the Kaby Lake-R quad-cores get really hot at clocks of more than 3 GHz during all our reviews, and we were obviously eager to see how Coffee Lake-U with the improved 14nm++ process performs.
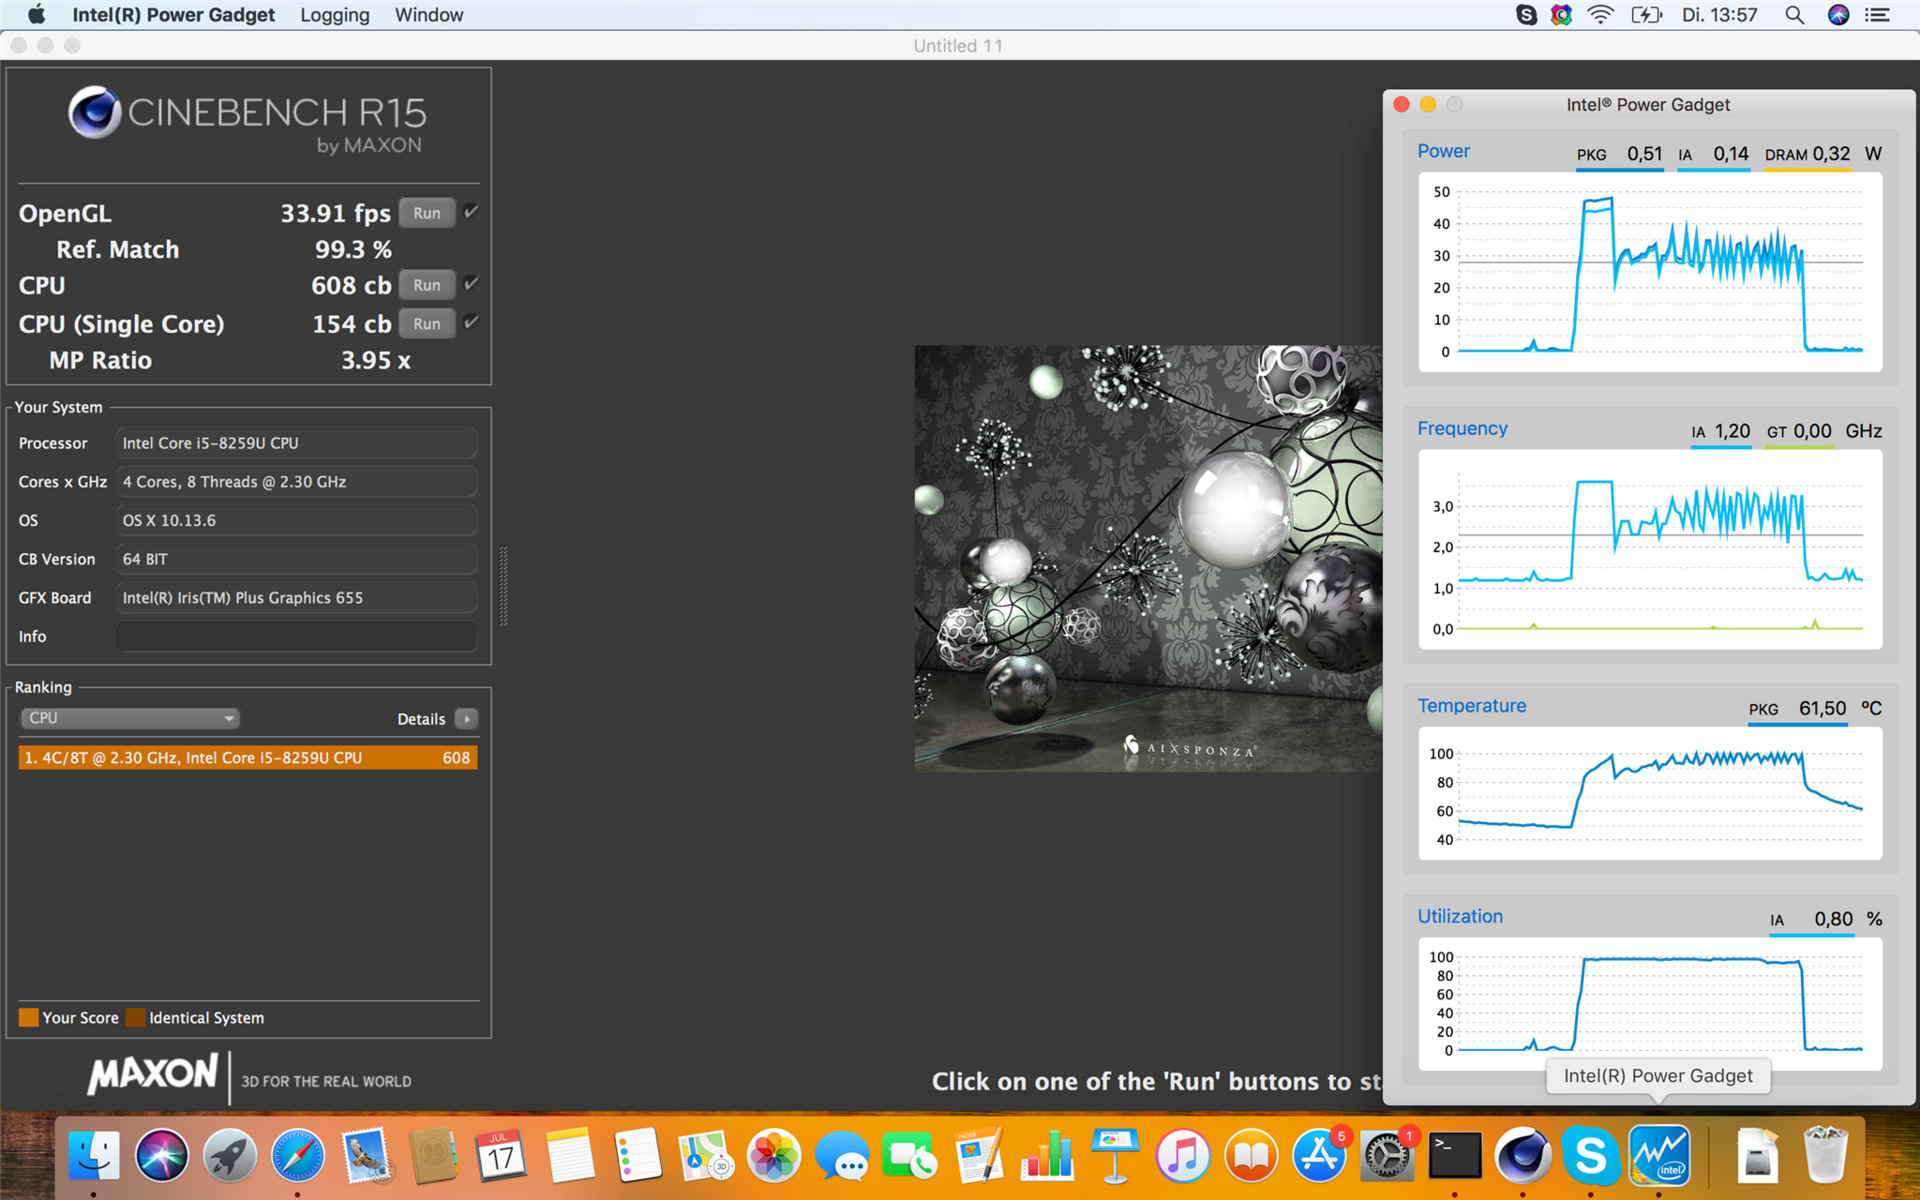
The Cinebench R15 Single score is in the expected range, but we were surprised when we saw the Multi score. Based on our experiences with Kaby Lake-R, we expected more than 700 points, but the MBP 13 only manages 608 points (macOS). This means the test model os beaten by system like the Dell XPS 13 or the ThinkPad X1 Carbon. Many manufacturers adjust the TDP limits dynamically, so a lot of systems with the common Core i5-8250U are faster than the MacBook Pro 13 2018.
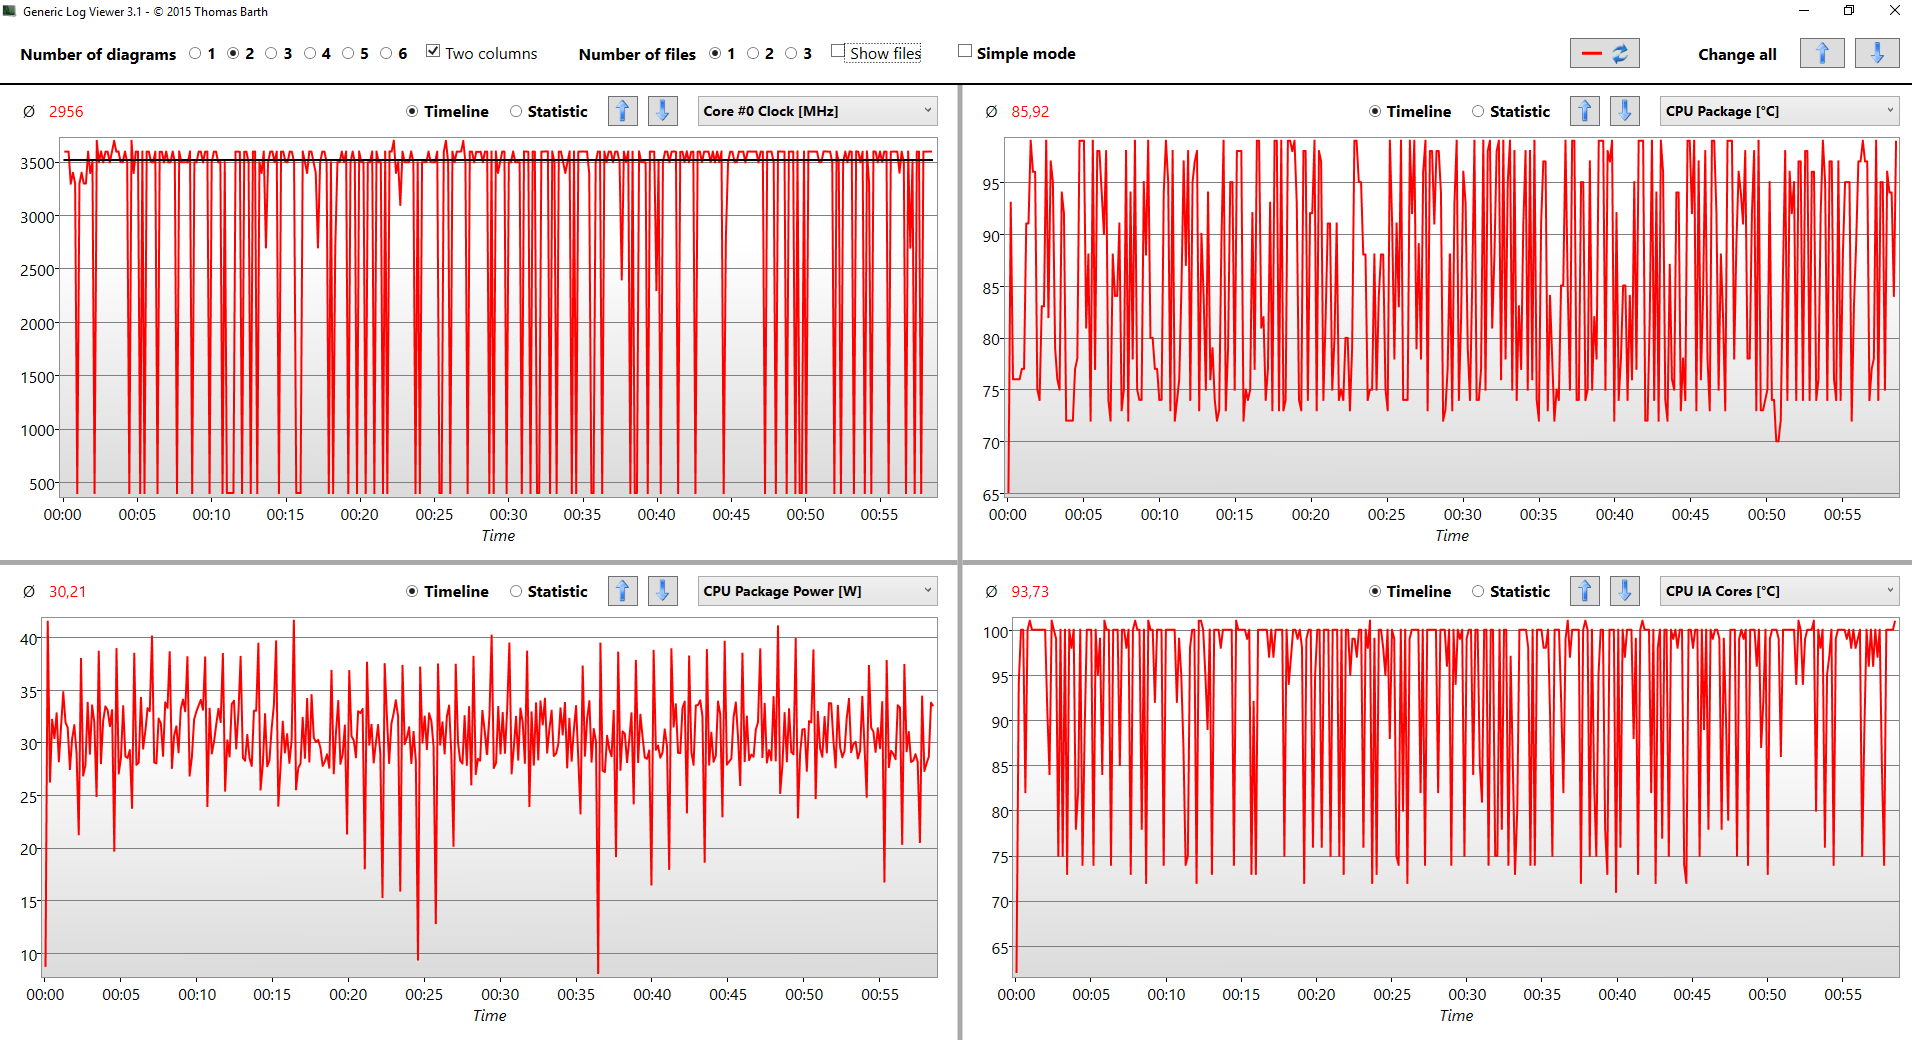
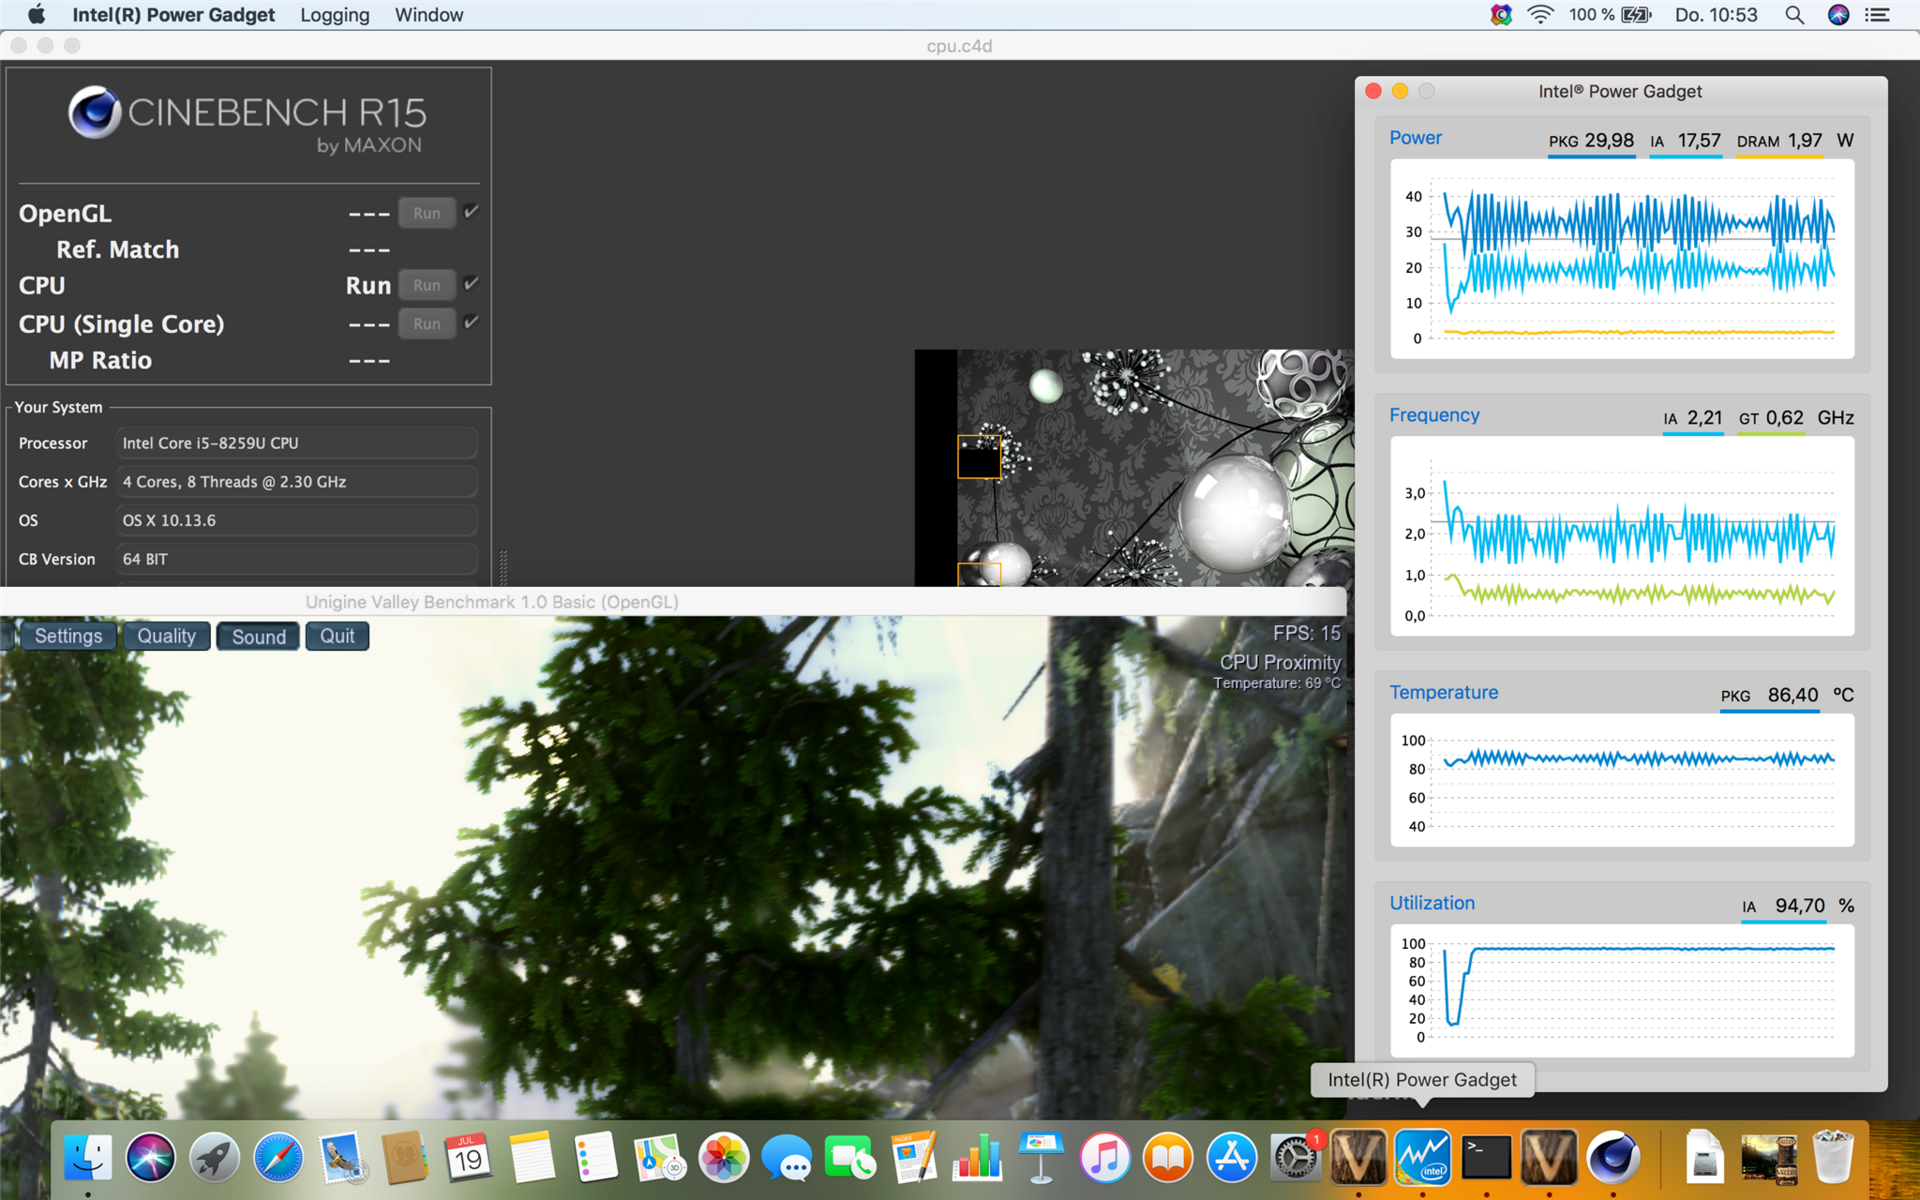
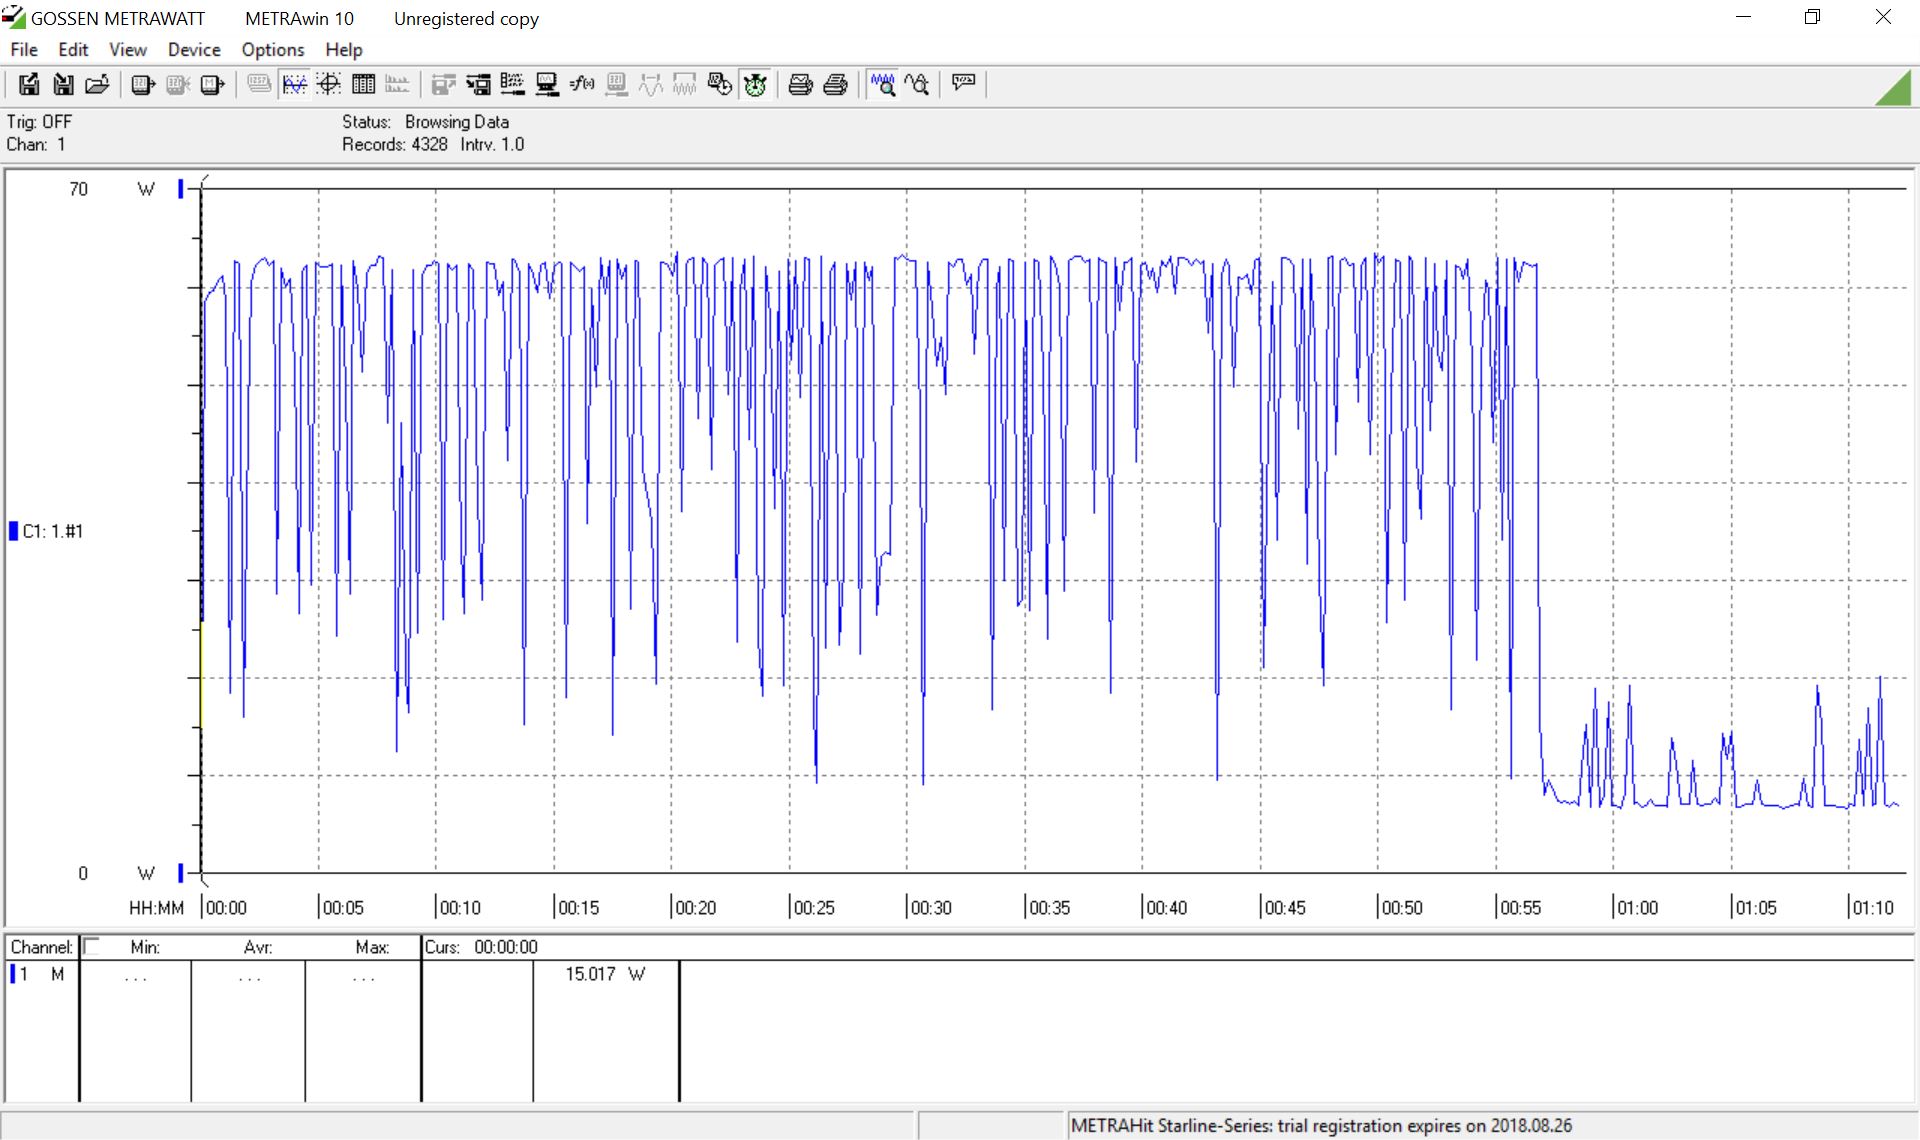
So how is this possible? We observed the clocks and the power consumption of the processor with the tool Intel Power Gadget (macOS). The following screenshot shows the behavior of the CPU during a single CB R15 Multi run. The processor starts with the full 3.6 GHz for about 5 seconds, which corresponds with a consumption of 48-49W. The cooling solution is quickly overpowered and the CPU hits 100 °C, which results in a clock reduction. The consumption fluctuates heavily between after that (between 20-40W), which obviously impacts the clocks. And we are talking about one single run of the Multi test.
Even this performance level cannot be maintained due to the high temperatures. The score levels off at about 580 points during our Cinebench Multi loop, another 5% compared to the original score.
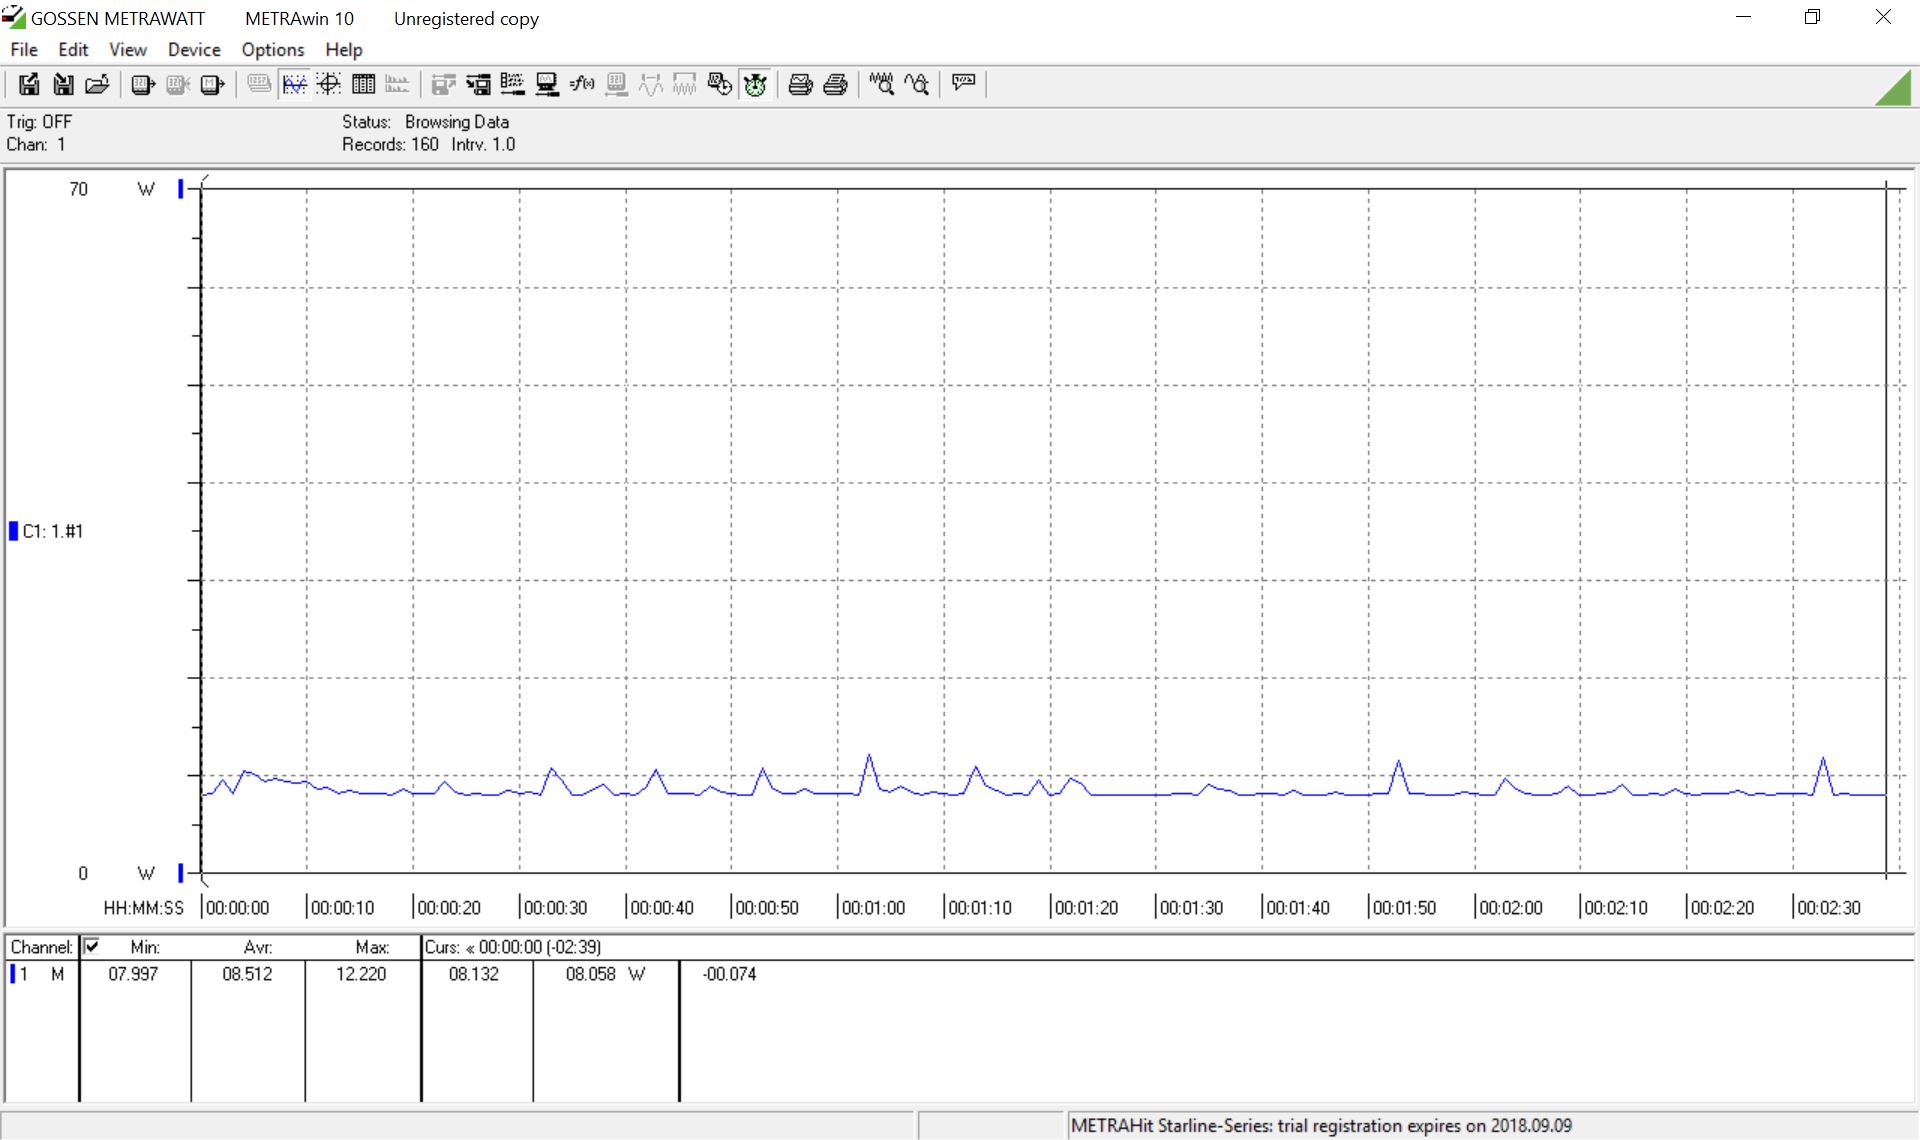
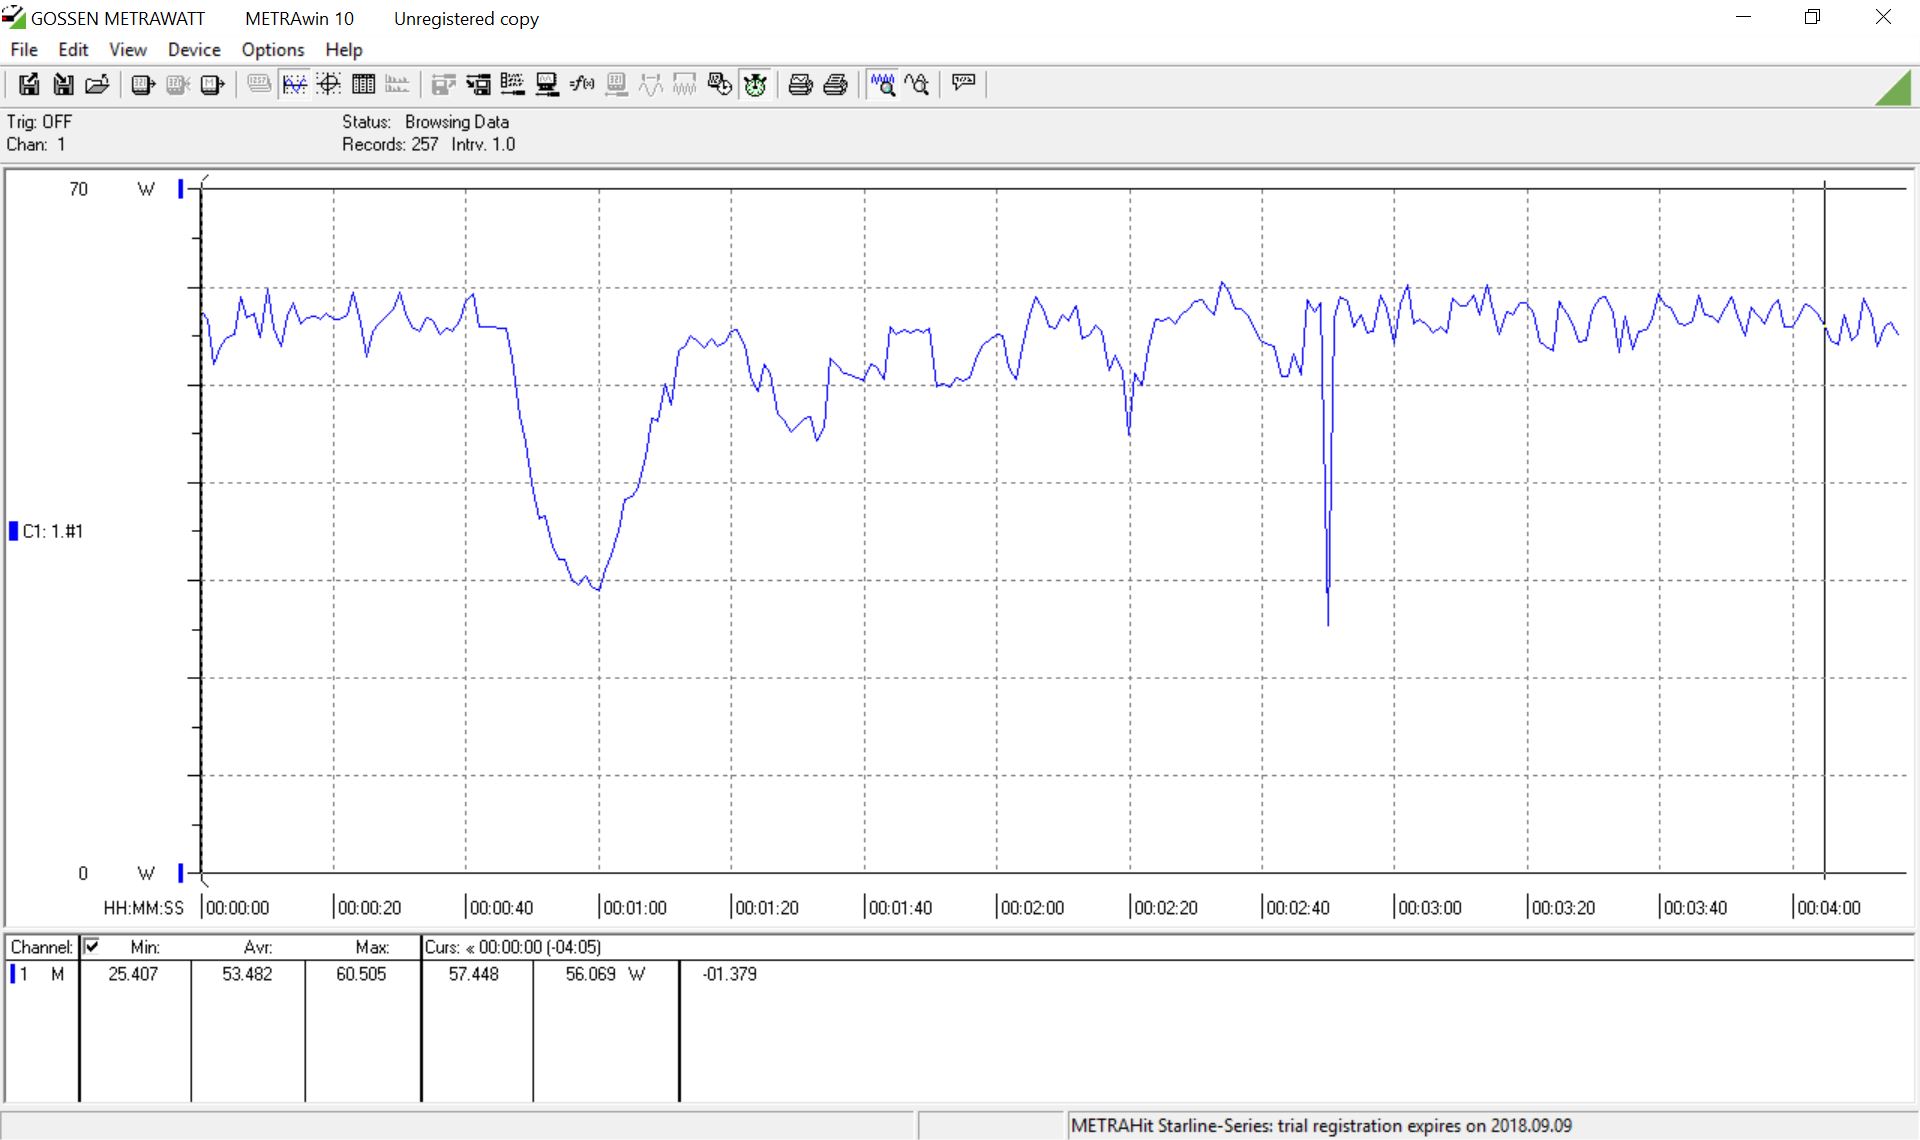
Update: Apple released a software update, which improves the CPU performance significantly. The graph below shows the new results (yellow line) and you can see that the performance is steady during our Cinebench loop.
We are extremely surprised by the supposedly bad efficiency of the Coffee Lake-U processor. We tested the Kaby Lake-R quad-cores extensively over the last couple of months, because they are shipped in almost every subnotebook. The standard Core i5-8250U in the ThinkPad T480s is a good example, because the performance is only limited by the temperature (similar to the MBP 13). It runs at a steady clock of 3.4 GHz at a consumption of about 30W (so even a bit less than the new MBP 13) and scores more than 700 points.
We will investigate further, but it seems Coffee Lake-U is just not as efficient as Kaby Lake-R. This is obviously not just Apple's problem, but Intel is to blame as well. This begs the question why the new 28W models are not based on Kaby Lake-R. All in all, the new MacBook Pro 13 is faster than the old previous 2017 model, but some Windows devices are faster with supposedly slower CPUs. The advantage of the optional Core i7 should be very small, and it might even be slower than the i5 due to higher temperatures (especially under sustained workloads).
Processor Tuning
The comparatively low Cinebench scores baffled us, so we investigated a bit more. One possibility is the fluctuating clock. As soon as there is some headroom, the clock jumps back up, which leads to high temperatures and the chip has to cool down. We wanted to see how the chip performs with a fixed power consumption. This is possible with the Intel XTU tool (many settings, freeware) on Windows, but the situation is more complicated on macOS. We use the tool Volta, even though the settings are much more limited and it is also not free (7-day trial). It is also limited to a TDP of up to 28W. More information including the bigger MacBook Pro 15 is summarized in this article.
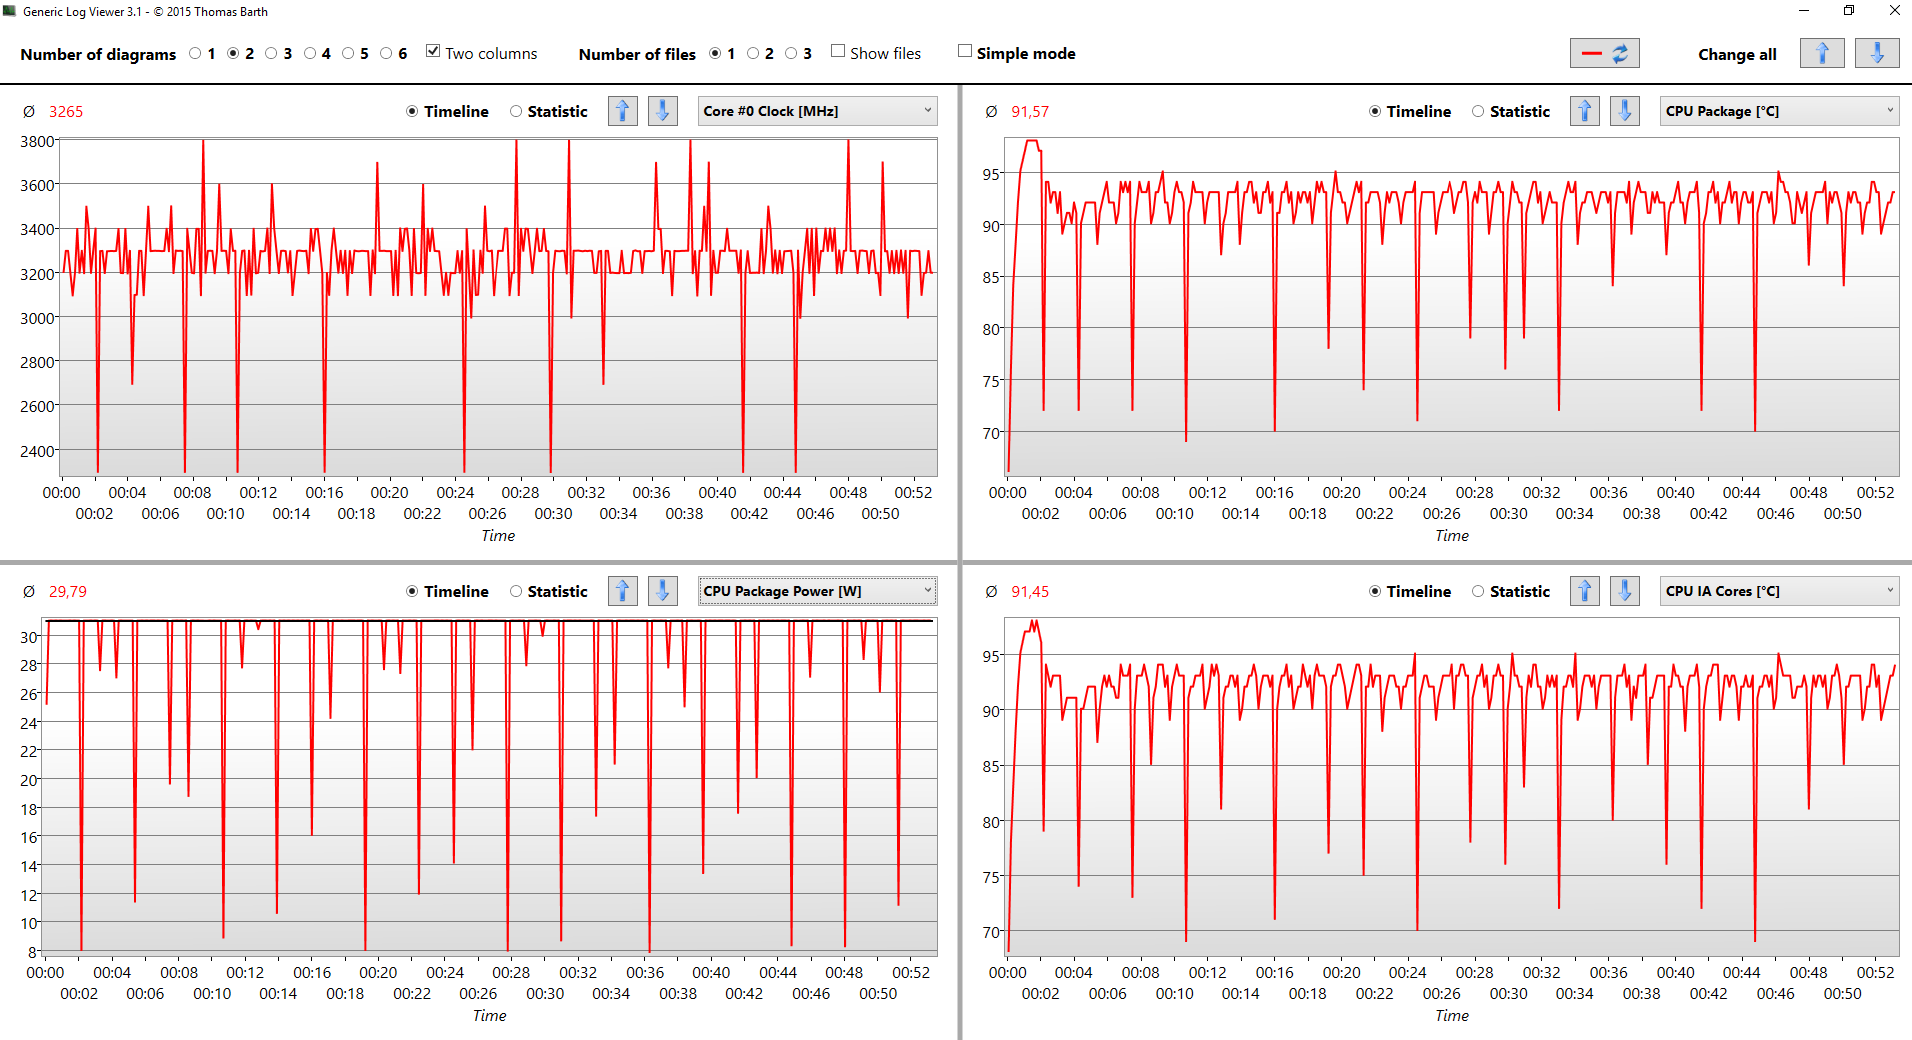
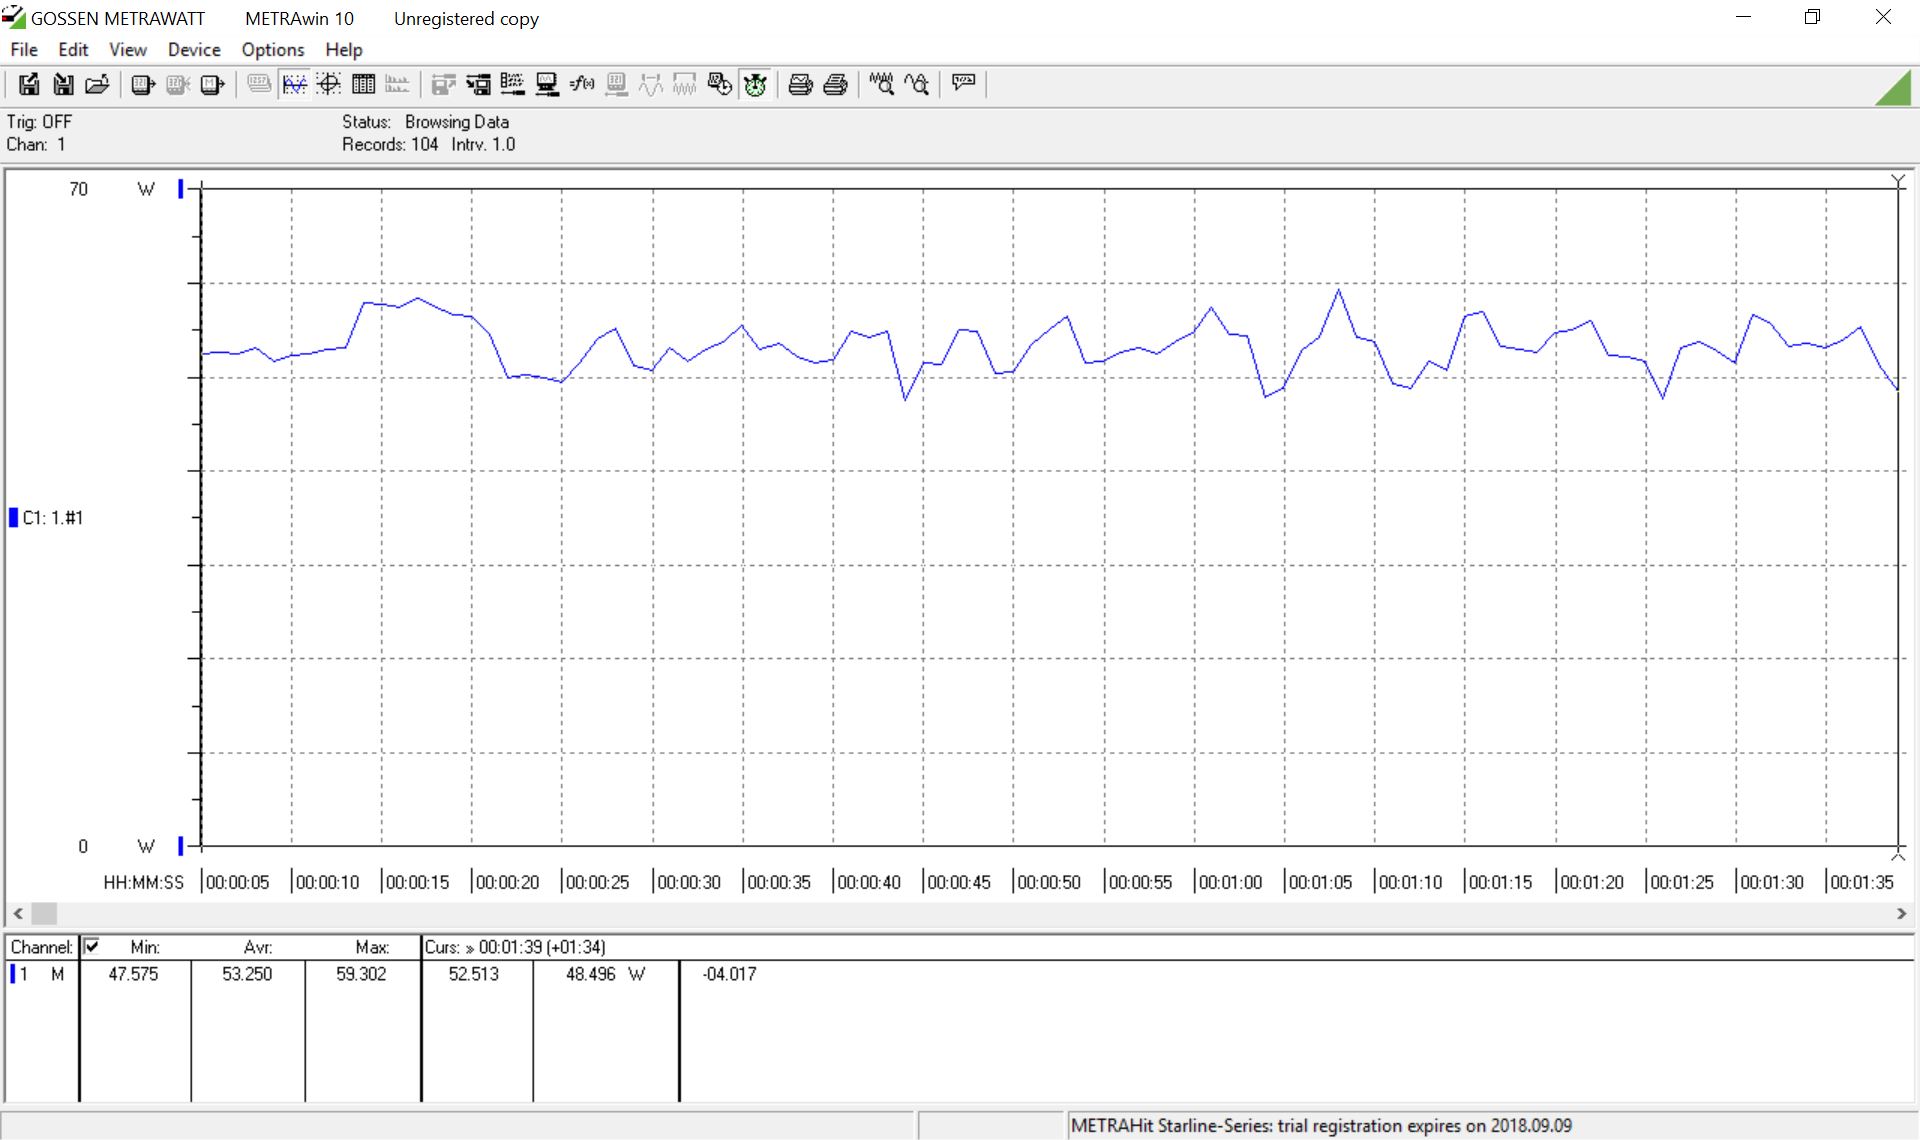
We started with a fixed consumption of 31W since this value is also reached with the default settings. The result is surprisingly good, because the CPU cores are about 300 MHz faster and the Cinebench scores are stable, which is also shown by the yellow line in the chart below. The performance in macOS (blue line) is slightly lower due to the 28W limitation, but still better compared to the default settings. The software update improved the CPU performance and it is stable, which is shown by the green line.
System Performance
The system is very responsive and there are no major loading times thanks to the fast processor, sufficient memory, and a very fast PCIe-SSD. The installation of Windows does not require a USB drive anymore; a Windows image file will suffice. Windows also runs well, but the results in the synthetic benchmarks are not great and our test unit only beats its predecessor in the PCMark 8 Work test, but both old models perform better in the other two scenarios. The mission optimizations of the BootCamp drivers might be the explanation.
| PCMark 8 Home Score Accelerated v2 | 3665 points | |
| PCMark 8 Creative Score Accelerated v2 | 5273 points | |
| PCMark 8 Work Score Accelerated v2 | 4399 points | |
| PCMark 10 Score | 3284 points | |
Help | ||
Storage Devices
The MacBook Pro 13 is only available with fast PCIe storage. Our test model is shipped with a 256 GB drive, and you can select up to 2 TB ex-works (+ 1750 Euros). It is a fast drive, but the exact determination of the performance is a bit tricky since our usual tools either do not work properly or depend on the optimization of the BootCamp drivers. We determine almost 3 GB/s read, so there are no performance issues.

GPU Performance
The integrated graphics adapter of the Apple laptop is a familiar solution, because the Intel Iris Plus Graphics 655 is just a regular Iris Plus Graphics 650 with more L4 cache (128 MB vs. 64 MB RAM). It is still the GT3e model of the Kaby Lake GPU, which reaches a maximum core clock of 1050 MHz in combination with the Core i5-8259U. The optional Core i7 manages a GPU clock of up to 1200 MHz. More technical information about the Iris Plus Graphics 655 is available here.
Thunderbolt solutions, which are natively supported by the current macOS, are interesting if you need more GPU performance. There should not be any significant CPU limitations thanks to the new quad-core processors. Apple sells a Thunderbolt eGPU from BlackMagic with a Radeon Pro 580, for example. We will receive a similar solution from Gigabyte (RX580 Gaming Box) soon and test it with the new MacBooks as well.
The integrated GPU performs well in the synthetic 3DMarks. Our MacBook Pro 13 2018 is about 10% ahead of the predecessor as well as the GeForce MX130 in 3DMark 11, but the MX150 is still faster. The situation changes a bit in the more challenging 3DMark 13 tests Fire Strike or Time Spy, where the predecessor falls between 10-20% behind, but the dedicated GPUs have an advantage. The comparison with the two integrated AMG GPUs Vega 8 and Vega 10 is also interesting, and they beat the Intel iGPU in all tests.
| 3DMark 11 Performance | 3330 points | |
| 3DMark Cloud Gate Standard Score | 11412 points | |
| 3DMark Fire Strike Score | 1898 points | |
| 3DMark Time Spy Score | 707 points | |
Help | ||
Gaming Performance
The integrated Iris Graphics 655 can only handle very simple games, but the performance is steady even after longer gaming sessions (see diagram Witcher 3 Ultra). However, there is no performance advantage over the previous model. We did not experience any driver issues with Windows.
| low | med. | high | ultra | 4K | |
| GTA V (2015) | 61 | 51.8 | 13.7 | 5.5 | |
| The Witcher 3 (2015) | 23.2 | 5.6 | |||
| Dota 2 Reborn (2015) | 87.9 | 64 | 32.4 | 28.1 | 11.6 |
| Rise of the Tomb Raider (2016) | 25.9 | 17.6 | |||
| The Division (2016) | 34.2 | 21.2 | |||
| Overwatch (2016) | 91 | 68 | 29.9 | 18.2 | |
| For Honor (2017) | 0 game wont start | ||||
| Ghost Recon Wildlands (2017) | 20.4 | 10.2 | |||
| Rocket League (2017) | 97 | 40.6 | 32.7 | ||
| Team Fortress 2 (2017) | 128 | 125 | 113 | 57.8 | 34.4 |
| Middle-earth: Shadow of War (2017) | 30 | 18 | 14 | 9 | |
| Assassin´s Creed Origins (2017) | 13 | ||||
| Fortnite (2018) | 51.5 | 21.6 | |||
| Final Fantasy XV Benchmark (2018) | 14.7 | ||||
| Far Cry 5 (2018) | 20 | 10 | |||
| The Crew 2 (2018) | 30.9 | ||||
| F1 2018 (2018) | 45 | 23 | 17 | 12 | |
| Shadow of the Tomb Raider (2018) | 20.5 | ||||
| Forza Horizon 4 (2018) | 25 | 0 | |||
| Assassin´s Creed Odyssey (2018) | 13 | ||||
| Call of Duty Black Ops 4 (2018) | 0 game wont start |
Emissions
System Noise
The cooling solution of the MacBook Pro 13 did not change this year. Two fans dissipate the heat from the processors with seamless adjustments of the fan speed. Both fans are running while idling and under light workloads (1294/1285 rpm), but they are very quiet at 30 dB(A) and only audible when you put your ear directly to the chassis. This changes under load, and the fan speed quickly adjusts to the load scenario and it often fluctuates within a certain range. The maximum speed of the two fans is 6336/6864 rpm, which corresponds with a noise of 46.7 dB(A).
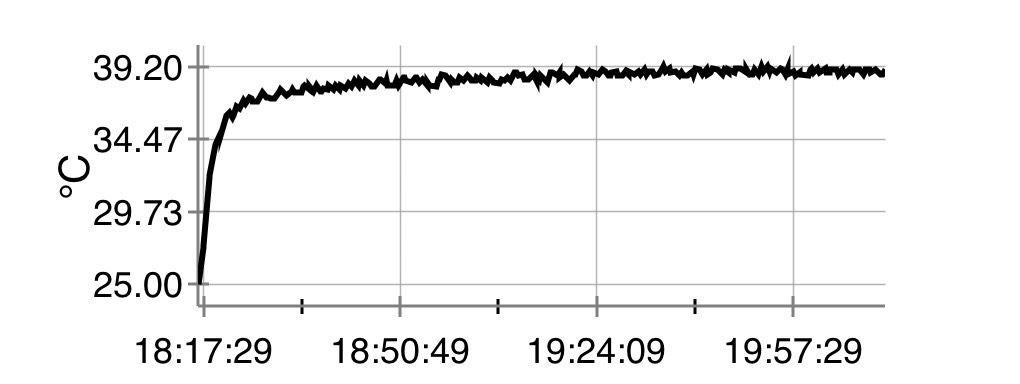
However, we did not reach this value during our testing, but up to 46.2 dB(A) at the beginning of the Windows stress test (Prime95 + FurMark). The fans throttled after a while (35.4 dB(A)) and eventually leveled off at about 38 dB(A). Less demanding scenarios like the first 3DMark 06 scene will increase the fan speed over time (32.7 -> 34.5 -> 36.1 dB(A)). It will be noticeably louder when you play games, which we tried with the title Fortnite. The fans are clearly audible and fluctuate between 5400 and up to 6800 rpm during the game (43-46 dB(A)). The fan characteristics are at least not unnecessary high-pitched.
Our measurements are a bit lower for combined CPU/GPU load in macOS. The test with Cinebench and Unigine Valley results in about 34 dB(A) and is therefore quieter compared to Windows 10. Pure CPU load by Cinebench, however, also speeds up the fans to ~6000 rpm and therefore 43-44 dB(A).
Noise Level
| Idle |
| 29.6 / 29.6 / 29.6 dB(A) |
| HDD |
| 30 dB(A) |
| Load |
| 36.7 / 46.7 dB(A) |
 | ||
30 dB silent 40 dB(A) audible 50 dB(A) loud |
||
min: | ||
Temperature
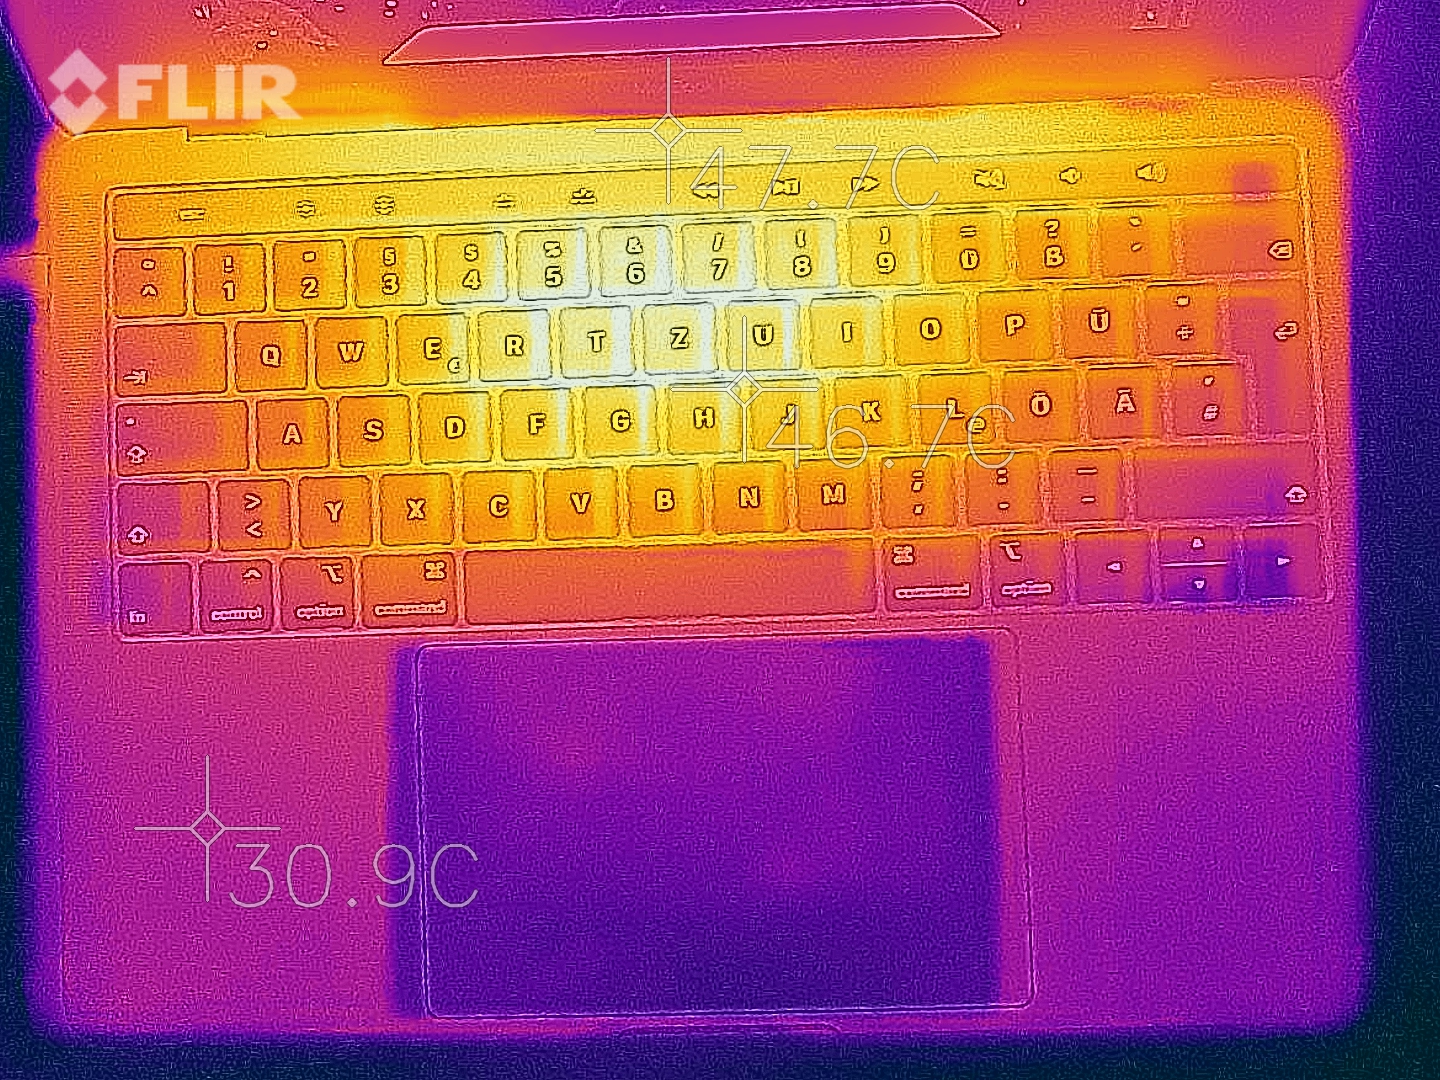
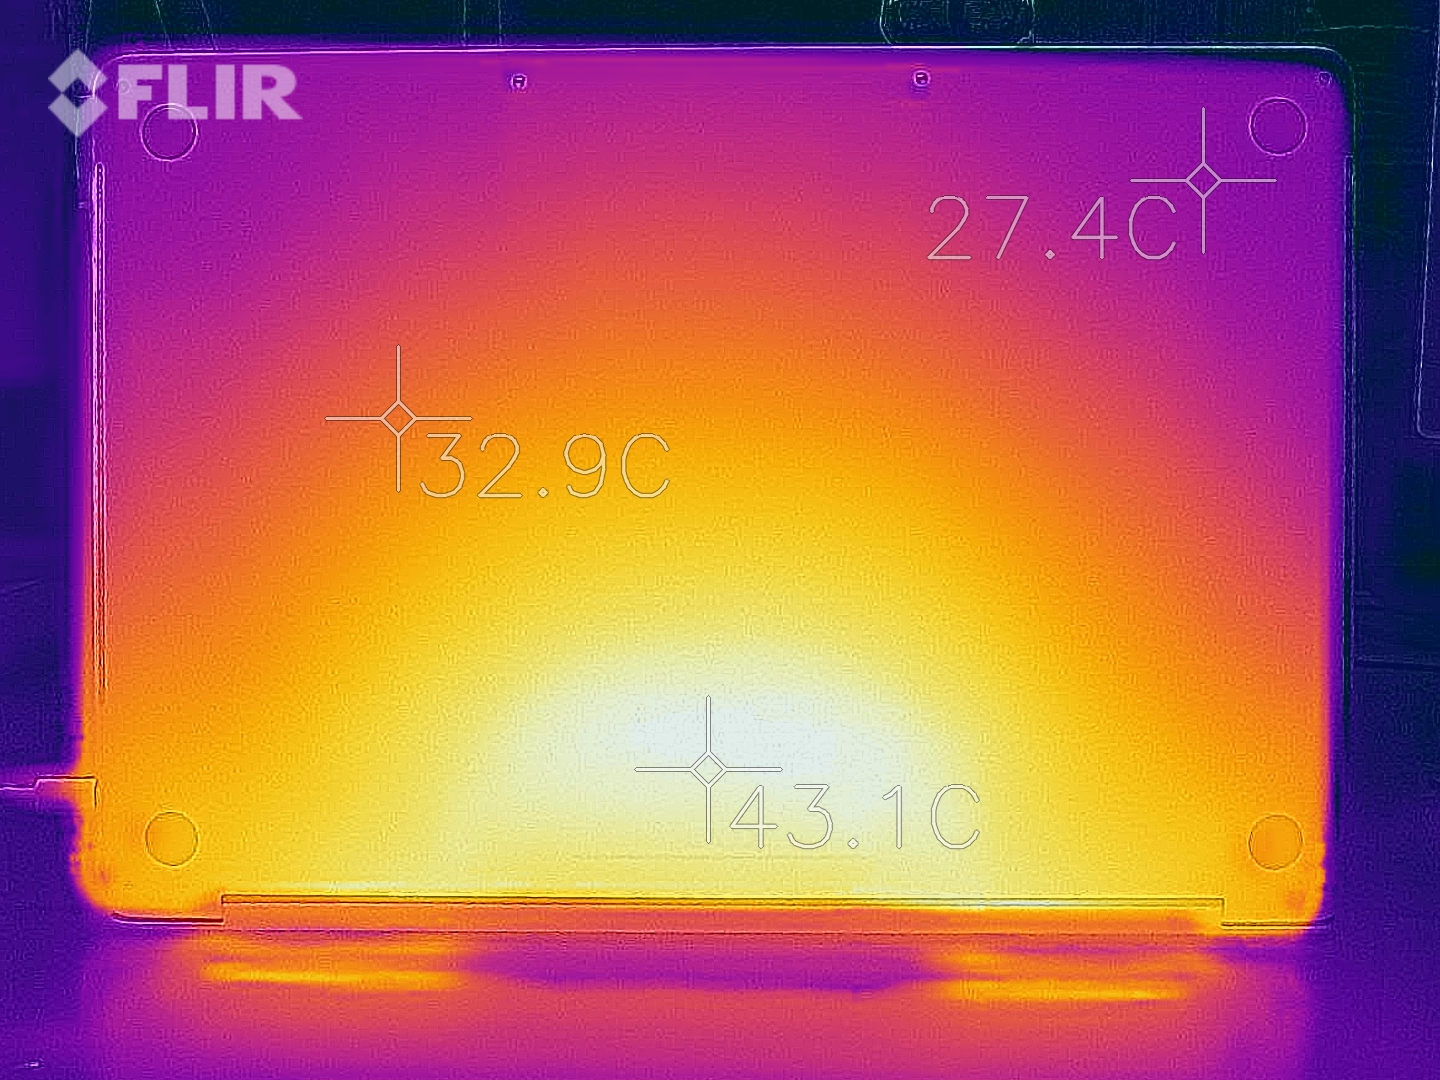
The chassis of the MacBook Pro 13 is comfortably cool while idling and under light workloads. As expected, the rear area of the base unit warms up under load because it is where the components as well as the heat pipes are positioned. It is not critical at 43 °C though and you can even use it on your (although not directly on your skin). The power adapter stays much cooler, especially compared to the bigger MacBook Pro 15.
A look at the components shows the processor temperature during the stress test is a bit lower compared to pure CPU load. The integrated graphics adapter occupies a part of the TDP envelope and does not create as much heat as the processor. The CPU is also running below its nominal clock most of the time and the graphics card only at 600-700 MHz (compared to a maximum clock of 1050 MHz).
Depending on the load scenario, however, the case of the MacBook Pro 13 can warm up even more. The fans are not spinning so fast when the CPU load is lower, which is the case during 3D benchmarks or gaming, for example. We tested it with The Witcher 3 and the temperature development at the bottom is pretty steady, but we now measure up to 48 °C at the left side of the keyboard, which is definitely noticeable.
Speakers
It seems Apple reworked the speakers as well and our measurements show a slightly more linear result. The maximum volume is a bit lower compared to the MacBook Pro 15, but still sufficient. Subjectively, we like music playback on the MBP13 a lot, especially considering the slim chassis.
Apple MacBook Pro 13 2018 Touchbar i5 audio analysis
(+) | speakers can play relatively loud (83.4 dB)
Bass 100 - 315 Hz
(±) | reduced bass - on average 6.9% lower than median
(+) | bass is linear (6.7% delta to prev. frequency)
Mids 400 - 2000 Hz
(+) | balanced mids - only 1.9% away from median
(+) | mids are linear (3.8% delta to prev. frequency)
Highs 2 - 16 kHz
(+) | balanced highs - only 3.6% away from median
(+) | highs are linear (6.3% delta to prev. frequency)
Overall 100 - 16.000 Hz
(+) | overall sound is linear (9.5% difference to median)
Compared to same class
» 3% of all tested devices in this class were better, 2% similar, 96% worse
» The best had a delta of 5%, average was 19%, worst was 53%
Compared to all devices tested
» 3% of all tested devices were better, 1% similar, 97% worse
» The best had a delta of 4%, average was 25%, worst was 134%
Apple MacBook Pro 13 2017 Touchbar i5 audio analysis
(+) | speakers can play relatively loud (86.2 dB)
Bass 100 - 315 Hz
(±) | reduced bass - on average 11.5% lower than median
(±) | linearity of bass is average (10.8% delta to prev. frequency)
Mids 400 - 2000 Hz
(±) | higher mids - on average 5.2% higher than median
(+) | mids are linear (6.4% delta to prev. frequency)
Highs 2 - 16 kHz
(+) | balanced highs - only 2.2% away from median
(+) | highs are linear (5.7% delta to prev. frequency)
Overall 100 - 16.000 Hz
(+) | overall sound is linear (11.9% difference to median)
Compared to same class
» 10% of all tested devices in this class were better, 4% similar, 86% worse
» The best had a delta of 5%, average was 19%, worst was 53%
Compared to all devices tested
» 6% of all tested devices were better, 2% similar, 91% worse
» The best had a delta of 4%, average was 25%, worst was 134%
Apple MacBook Pro 15 2018 (2.6 GHz, 560X) audio analysis
(+) | speakers can play relatively loud (85 dB)
Bass 100 - 315 Hz
(+) | good bass - only 4.7% away from median
(±) | linearity of bass is average (8.3% delta to prev. frequency)
Mids 400 - 2000 Hz
(+) | balanced mids - only 1.8% away from median
(+) | mids are linear (3.5% delta to prev. frequency)
Highs 2 - 16 kHz
(+) | balanced highs - only 2.6% away from median
(+) | highs are linear (5.7% delta to prev. frequency)
Overall 100 - 16.000 Hz
(+) | overall sound is linear (6.4% difference to median)
Compared to same class
» 2% of all tested devices in this class were better, 1% similar, 97% worse
» The best had a delta of 5%, average was 18%, worst was 45%
Compared to all devices tested
» 0% of all tested devices were better, 0% similar, 99% worse
» The best had a delta of 4%, average was 25%, worst was 134%
Energy Management
Power Consumption
Looking at the power consumption, we notice a higher maximum consumption. This is mainly a result of the quad-core processor and the MacBook often consumes more than 61 Watts the power adapter provides, especially under high load. There is still some headroom, but Apple should start to think about a more powerful PSU for the 13-inch model. There is also some room for improvements while idling; the old model without the Touch Bar is much better in this respect.
| Off / Standby | |
| Idle | |
| Load |
|
| Apple MacBook Pro 13 2018 Touchbar i5 i5-8259U, Iris Plus Graphics 655, , IPS, 2560x1600, 13.30 | Apple MacBook Pro 13 2017 Touchbar i5 i5-7267U, Iris Plus Graphics 650, Apple SSD AP0256, IPS, 2560x1600, 13.30 | Apple MacBook Pro 13 2017 i5-7360U, Iris Plus Graphics 640, Apple SSD AP0128, IPS, 2560x1600, 13.30 | Lenovo ThinkPad X1 Carbon 2018-20KGS03900 i5-8550U, UHD Graphics 620, Samsung SSD PM981 MZVLB512HAJQ, IPS, 2560x1440, 14.00 | Dell XPS 13 9370 i7 UHD i5-8550U, UHD Graphics 620, Toshiba XG5 KXG50ZNV512G, IPS, 3840x2160, 13.30 | Huawei Matebook X Pro i5 i5-8250U, GeForce MX150, Samsung PM961 MZVLW256HEHP, IPS, 3000x2000, 13.90 | Asus ZenBook S UX391U i5-8550U, UHD Graphics 620, Samsung PM961 NVMe MZVLW512HMJP, IPS, 1920x1080, 13.30 | Average Intel Iris Plus Graphics 655 | Average of class Subnotebook | |
|---|---|---|---|---|---|---|---|---|---|
| Power Consumption | -7% | 12% | -7% | -9% | -8% | 12% | -24% | -17% | |
| Idle Minimum * | 2.3 | 2.8 -22% | 3.7 -61% | 3.8 -65% | 5 -117% | 3.5 -52% | 3.24 -41% | 5.96 ? -159% | 4.9 ? -113% |
| Idle Average * | 8.7 | 10.9 -25% | 5.2 40% | 8.9 -2% | 8.3 5% | 8.9 -2% | 6.1 30% | 8.44 ? 3% | 8.36 ? 4% |
| Idle Maximum * | 12.2 | 11.4 7% | 7.6 38% | 11.9 2% | 8.8 28% | 12.3 -1% | 9.2 25% | 10.6 ? 13% | 10.4 ? 15% |
| Load Average * | 53.3 | 55.4 -4% | 41.6 22% | 47.5 11% | 46.4 13% | 54.2 -2% | 38.8 27% | 46.5 ? 13% | 45.9 ? 14% |
| Load Maximum * | 64 | 57.5 10% | 50.5 21% | 52.5 18% | 48.6 24% | 52.1 19% | 52.6 18% | 56.2 ? 12% | 66 ? -3% |
| Witcher 3 ultra * | 42.4 |
* ... smaller is better
Battery Runtime
Apple increased the battery capacity from 49.2 to 58 Wh for the 2018 MacBook Pro 13. We performed our WLAN test at an adjusted luminance of 150 nits and we also compared how the results differ when we let the Safari browser run in a window or fullscreen under macOS. However, a difference of 9 minutes is negligible. Thanks to the higher battery capacity, the runtime is one hour longer at more than 9.5 hours compared to the 2017 MBP 13 Touch Bar. This is sufficient to beat the Windows competition, but the MacBook Pro 13 2017 with function keys is still clearly ahead at more than 11 hours. The software update also improved the battery runtime (+40 minutes).
The video runtime is also better compared to last year, which is probably also a result of software optimizations. The 2018 MBP 13 is not quite as good as the 2017 model without the Touch Bar, but 11 hours is not a bad result. The load runtime is about 1.5 hours.
The charging time of the battery is pleasantly quick at 105 minutes, but there is no special quick-charge function. You get 38% after 30 minutes, 55% after 45 minutes, and 71% after 60 minutes.
| Apple MacBook Pro 13 2018 Touchbar i5 i5-8259U, Iris Plus Graphics 655, 58 Wh | Apple MacBook Pro 13 2017 Touchbar i5 i5-7267U, Iris Plus Graphics 650, 49.2 Wh | Apple MacBook Pro 13 2017 i5-7360U, Iris Plus Graphics 640, 54.5 Wh | Lenovo ThinkPad X1 Carbon 2018-20KGS03900 i5-8550U, UHD Graphics 620, 57 Wh | Dell XPS 13 9370 i7 UHD i5-8550U, UHD Graphics 620, 52 Wh | Huawei Matebook X Pro i5 i5-8250U, GeForce MX150, 57.4 Wh | Asus ZenBook S UX391U i5-8550U, UHD Graphics 620, 50 Wh | Average of class Subnotebook | |
|---|---|---|---|---|---|---|---|---|
| Battery Runtime | -24% | 11% | -12% | -20% | -4% | -10% | 15% | |
| H.264 | 651 | 415 -36% | 683 5% | 566 -13% | 621 -5% | 794 ? 22% | ||
| WiFi v1.3 | 581 | 519 -11% | 681 17% | 519 -11% | 465 -20% | 557 -4% | 491 -15% | 629 ? 8% |
| Witcher 3 ultra | 94 |
Verdict - MacBook Pro 13 2018
Pros
Cons
More articles related to this device
Apple MacBook Pro 13 2018 Touchbar i5 (MacBook Pro 13 2018 Series)Related Articles


The announcement of the new 2018 MacBook Pro lead to many headlines. They were mainly focused on the performance of the new processors, which did not meet the expectations. Apple released a software update one week later, which was supposed to improve the performance. At ~1.5 GB, however, it was a major update and we got the impression that the software just was not ready for the launch. We know this problem from other manufacturers, but we did not experience it on any of the previous MacBooks on this level.
The performance of the new quad-core processor is at least stable by now and also much better compared to last year's models, which were still shipped with dual-core CPUs. We still notice two things: The performance could be better with a more powerful cooling system, but the latter has not been changed and has to take of two additional cores this year. It also looks like the Coffee Lake processor is not as efficient as the Kaby Lake-R chips, where we have already seen better results at similar consumption values. The cooling, which is usually pleasantly quiet, can also become very loud under load. The power adapter is also just sufficient at 61 Watts.
Besides the higher performance, the Coffee Lake CPU also provides more PCIe lanes, so all four Thunderbolt 3 ports are attached with the full bandwidth. The WLAN module is also new and supports Bluetooth 5.0, but the WLAN transfer rates are a bit lower than before and the WLAN connectivity issues with attached USB-C devices are not as bad as before. Apple also reworked the keyboard. Besides the actual reason, the protection against dust and dirt particles, the stroke is now a bit more muffled and quieter. The limited key travel is still a matter of taste.
More performance and longer battery runtime, but otherwise much of the same. The 2018 MacBook Pro 13 is once again a very good Ultrabook, but the design including the cooling solution is slowly reaching the limit.
Otherwise, Apple once again delivers a very good Ultrabook and the manufacturer implements some things the competition cannot offer. Besides the high-quality chassis, the very good 16:10 panel, and the excellent trackpad, we are also talking about smaller things like the automatic brightness control of the keyboard illumination or the TrueTone feature of the display.
Whether the Touch Bar really adds value still depends on the software support and cannot be generalized. It is unfortunate that Apple only updates the more expensive Touch Bar model and not the more affordable Function Key model. The latter will probably be discontinued at some point.
Apple MacBook Pro 13 2018 Touchbar i5
-
08/16/2018 v6(old)
J. Simon Leitner, Andreas Osthoff
Pricecompare
