Apple MacBook Air 2018 (i5, 256 GB) Laptop Review

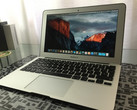
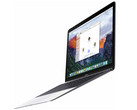
Apple's MacBook Air was once the lightest and most compact MacBook on the market, but the basic design remained identical since 2012 and the manufacturer only updated some of the components. Our last review of the MacBook Air was in mid 2017, and it appeared very outdated, especially compared to Apple's own MacBook 12. Neither the comparatively large footprint nor the low-resolution TN panel could keep up with the Windows competition anymore, either.
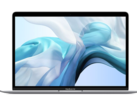
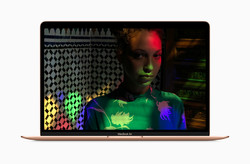
The new Apple MacBook Air gets a new chassis, which looks almost identical to the MacBook Pro and shares the same footprint. However, the front of the MacBook Air is once again tapered and only measures 0.41 cm at its slimmest spot. The weight was reduced by about 100 grams compared to the old model and the new Air sits between the MacBook 12 and the MacBook Pro 13.
The announcement of the new MacBook Air also shows why Apple did not refresh the less-expensive MacBook Pro 13 (function keys) this year with Intel's latest quad-core chips. The new MacBook Air targets a very similar group of customers and is not that much more affordable than the "smallest" Pro model, either. We believe there is a good chance Apple will completely remove the less-expensive MacBook Pro 13 from its lineup with the next major update. By the way, Apple still sells the old MacBook Air (starting from 1099 Euros, ~$1249), but it is hard to recommend it due to the outdated hardware.
Update 2019/07/23: Retested a second model with the brightness update
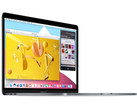
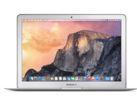
| MacBook Air 2017 (old model) |
MacBook Air 2018 (new model) |
MacBook Pro 13 2017 (Function keys) |
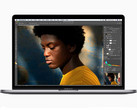
MacBook Pro 13 2018 (Touch Bar) |
|
|---|---|---|---|---|
| CPU | Core i5 1.8 GHz Core i7 2.2 GHz |
Core i5 1.6 GHz | Core i5 2.3 GHz Core i7 2.5 GHz |
Core i5 2.3 GHz Core i7 2.7 GHz |
| Broadwell 15 W Dual-Core |
Amber Lake-Y 7 W Dual-Core |
Kaby Lake 15 W Dual-Core |
Coffee Lake-U 28 W Quad-Core |
|
| GPU | HD Graphics 6000 | UHD Graphics 617 | Iris Plus Graphics 640 | Iris Plus Graphics 655 |
| Display | 13.3-inch TN 1440 x 900 pixels |
13.3-inch IPS 2560 x 1600 pixels |
13.3-inch IPS 2560 x 1600 pixels |
13.3-inch IPS 2560 x 1600 pixels |
| RAM | 8 GB LPDDR3-1600 | 8/16 GB LPDDR3-2133 | 8/16 GB LPDDR3-2133 | 8/16 GB LPDDR3-2133 |
| PCIe-SSD | 128/256/512 GB | 128/256/512 GB & 1.5 TB | 128/256/512 GB & 1 TB | 256/512 GB & 1/2 TB |
| Dimensions | 32.5 x 22.7 x 0.3-1.7 cm | 30.41 x 21.24 x 0.41-1.56 cm | 30.41 x 21.24 x 1.49 cm | 30.41 x 21.24 x 1.49 cm |
| Weight | starting at 1.35 kg | starting at 1.25 kg | starting at 1.37 kg | starting at 1.37 kg |
| Price | starting at 1099 € | starting at 1349 € | starting at 1499 € | starting at 1999 € |
Apple only offers the new MacBook Air with one processor, the Intel Core i5-8210Y. The designation can be confusing since almost all the other mobile 8th generation Core-i chips are quad-cores. This CPU, however, is only a dual-core with a low TDP of 4.5 Watt (cTDP up 7 W). We will cover all the differences and details in the corresponding sections below. We review the mainstream model with 256 GB PCIe-SSD storage and 8 GB RAM for 1599 Euros (~$1817).
We will obviously compare the new MacBook Air with Apple's other 13-inch offerings, and we are particularly interested in the performance difference compared to the Pro models. There are also numerous Windows alternatives, mainly the Dell XPS 13. Other comparison devices include the Microsoft Surface Laptop 2, Asus ZenBook S UX391, HP Envy 13, and the Huawei MateBook X Pro.
Case
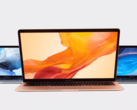
The design of the new Apple MacBook Air is almost identical to the current MacBook Pro lineup and the only difference is the tapered front. Apple states the chassis is made from 100% recycled aluminum for the first time, but you do not notice that and the quality impression is just as good as on the Pro models. The build quality is impeccable and the stability is excellent for such a slim device. We also like the haptic impression of the metal surfaces, and it just feels like you are using a high-quality product. Based on our own experiences with Apple devices we can say that the surfaces still look great after a few years of use, and the new MacBook Air should not be an exception. Besides the two familiar color choices of silver and space gray, the new Air is also available in gold, which was previously reserved for the smaller MacBook 12. Apple also reduced the bezels compared to the previous generation, but there is still room for optimizations (compare with the XPS 13, for example).
The central hinge is well-adjusted and can prevent bouncing of the screen. It is not easy to open the lid with one hand due to the light base unit. The maximum opening angle is 135-140 degrees.
The bottom panel is secured by multiple Pentalobe screws. It is easy to remove when you have the corresponding tool, but pretty much all the components are either glued into the chassis or soldered, so there is not much to do.
We already mentioned the identical footprint between the new MacBook Air and the MacBook Pro 13. The rear of the Air is even slightly thicker, but it is much slimmer at the front in return. It appears a bit more compact when you use or carry it, but the difference is not big and it would not be a decisive factor in our personal purchase decision. The 12-inch MacBook remains the most portable Apple laptop.
Both the MacBook 12 and the old MacBook Air stand out from the size comparison, but all the other laptops are very similar and the Dell XPS 13 is even a bit more compact in terms of footprint. All in all, however, all the current laptops here are very portable and it is no problem to transport them. The weight of the new MacBook Air is slightly higher compared to some of the rivals (XPS 13, ZenBook S, HP Envy 13), but sometimes only by a very small margin.
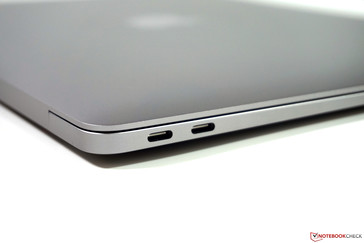
Connectivity – 2x Thunderbolt 3
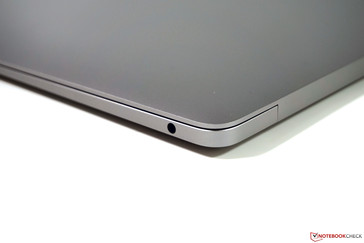
The port situation is identical to the MacBook Pro 13 2017 with function keys. This means you get 2x Thunderbolt 3 ports with USB-C connectors at the left side (40 GB/s), which can also be used to charge the battery or attach external monitors. Thanks to Intel's UHD Graphics 617, the video output is identical to the more powerful Pro siblings. You can either attach one external 5K screen (5120x2880 pixels) at 60 Hz or two 4K screens (up to 4096x2304 pixels) at 60 Hz in addition to the internal display. This makes the new MacBook Air very future-proof, but one of the ports is often blocked by the power adapter. Then there is the issue with USB-C accessories, and you will probably need adapters. Apple fortunately did not get rid of the stereo jack, which is located at the right rear.
Communication
The comparison of the WLAN modules shows another difference compared to the current MacBook Pro 13. The new MacBook Air supports all the common Wi-Fi standards including the fast 802.11 ac, but Bluetooth connections are limited to the older 4.2 standard. The 2018 MBP 13 already supports Bluetooth 5.0 with more range and lower power consumption.
We did not notice any issues with the stability of the connection in practice, but the transfer rates in our standardized WLAN test with the router Linksys EA8500 are at the bottom of our comparison group. We repeated the test multiple times (both in macOS and Windows) to rule out measurement errors, but the results stayed on a comparable level.
Security – Apple T2
Similar to the current MacBook Pro, Apple also equips the MacBook Air with its own T2 Security chip. It combines multiple functions, including storage encryption and secure boot features. We refer to the official release from Apple (White Paper) for more technical information. You can now login via Touch-ID fingerprint scanner. It is a hybrid solution from both MacBook Pro models. The Touch-ID sensor is combined with the power button (similar to the MBP 13 Touch Bar), but in combination with regular function keys. The sensor is very quick and reliable.
Accessories
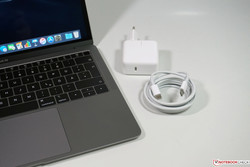
The box of the MacBook Air only includes the laptop itself, the USB-C power adapter (30 Watts), a 2 m USB-C cable, as well as some service brochures. The manufacturer does not offer any specific accessories for the MacBook Air, but there are numerous adapters, docking stations, and even external graphics cards (eGPUs) for the Thunderbolt 3 port.
Warranty
Apple still sells its laptops with a one-year manufacturer's warranty, which also includes a 90-day premium phone support. You can also extend the service with Apple CarePlus, either during the purchase or within 60 days after purchase. This additional service retails for 249 Euros (~$283) and extends the warranty to three years. It also covers two accidental damages within this time, although you will have to pay a service fee depending on the damage (99 Euros, ~$112, for damages to the display or the outer shell of the case, or 259 Euros, ~$294, for all other damages). Please see our Guarantees, Return policies and Warranties FAQ for country-specific information.
Input Devices – Butterfly v3
Keyboard
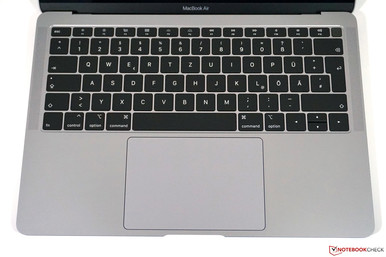
Apple equips the new MacBook Air with the familiar Butterfly keyboard. Similar to the current 2018 MBP 13 (Touch Bar), it is the third generation of Butterfly switches with silicon membranes. This is supposed to prevent dirt from entering the switches, which resulted in defective keyboards in the past. It is an advantage over the less-expensive MacBook Pro 13 as well as the MacBook 12.
The typing experience is therefore identical to the current MacBook Pro 13 (Touch Bar) and is defined by the extremely shallow travel in combination with the very precise pressure point. The key stroke is significantly more muffled compared to the older versions, but the typing noise is still quite loud. Especially the shallow key travel is still a point of controversy and we recommend you try the keyboard before you purchase the laptop. There will definitely be a learning period.
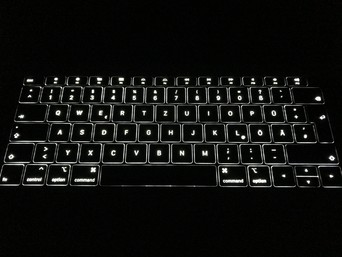
Apple still has the edge over many competitors when it comes to the keyboard illumination. You can adjust the intensity of the white illumination very precisely and it even turns on/off automatically thanks to the ambient light sensor.
Touchpad
A direct comparison between the old and new MacBook Air shows how massive the new trackpad is. Similar to the keyboard, there is no perceptible difference to the more-expensive MacBook Pro and even though the Windows competition closed the gap over the last couple of years, the MacBook touchpads are still the benchmark. The handling is extremely precise and multi-touch gestures are easy thanks to the large surface. It is a so-called Force Touch trackpad, so the clicking feedback is identical independent of the spot you click and the touchpad recognizes different pressure levels (harder click for context menu, for example).
Display – Retina Light
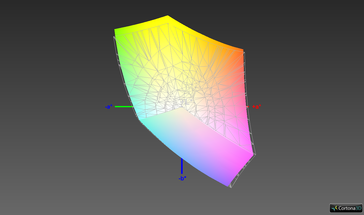
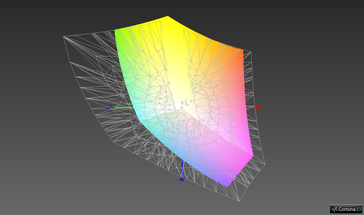
The display was probably the biggest drawback of the old MacBook Air, because the 13.3-inch screen was still based on the TN technology with limited viewing angles and a low resolution of 1440x900 pixels. This was far away from Apple's own standards ("Retina") and is supposed to change with the redesigned model. Similar to the current MacBook Pro 13, you now get a 13.3-inch screen with 2560x1600 pixels (16:10, 227 ppi). A closer look at the specs, however, suggests quality differences. Apple advertises the MacBook Pro 13 with a 500 nit panel and full P3 coverage, but only "48% more colors compared to the old generation" for the new MacBook Air. We determined about 60% sRGB during our review of the last MacBook Air, so the new Air should target full sRGB gamut. Apple does not specify the brightness at all.
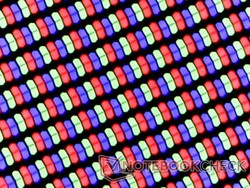
Subjectively, you will instantly notice the difference compared to the old TN panel of the last-generation MacBook Air. The content is extremely crisp, but the colors are not as vivid as on the – admittedly very good – screens of the MacBook Pro devices. The luminance cannot keep up with the Pro models, either. We determine an average value of 315 nits for the panel with the designation APPA039. Only the two 1080p competitors from Asus and HP are slightly darker, but all the other comparison devices with high-resolution panels are much brighter. The 2017 MacBook Pro in particular clearly has the edge over the new Air. The brightness is usually sufficient indoors, but the combination of bright environments and the glossy screen can be a challenge. The contrast ratio is also lower compared to many rivals, and the only good aspect so far is the very even brightness distribution (95%) with almost no backlight bleeding. The TrueTone functionality from the current MacBook Pro laptops is not supported.
| |||||||||||||||||||||||||
Brightness Distribution: 95 %
Center on Battery: 321 cd/m²
Contrast: 1103:1 (Black: 0.29 cd/m²)
ΔE Color 1.2 | 0.5-29.43 Ø5, calibrated: 0.5
ΔE Greyscale 0.8 | 0.57-98 Ø5.3
96% sRGB (Argyll 1.6.3 3D)
62.1% AdobeRGB 1998 (Argyll 1.6.3 3D)
69.8% AdobeRGB 1998 (Argyll 2.2.0 3D)
96.1% sRGB (Argyll 2.2.0 3D)
67.8% Display P3 (Argyll 2.2.0 3D)
Gamma: 2.2
| Apple MacBook Air 2018 APPA039, , 2560x1600, 13.30 | Apple MacBook Pro 13 2017 APPA033, , 2560x1600, 13.30 | Dell XPS 13 9370 i5 UHD ID: Sharp SHP148B, Name: LQ133D1, Dell P/N: 8XDHY, , 3840x2160, 13.30 | Asus ZenBook S UX391U AUO B133HAN04.9, , 1920x1080, 13.30 | HP Envy 13-ah0003ng M133NVF3 R0, , 1920x1080, 13.30 | Huawei Matebook X Pro i5 Tianma XM, , 3000x2000, 13.90 | Microsoft Surface Laptop 2-LQN-00004 VVX14T092N00, , 2256x1504, 13.50 | Apple MacBook 12 2017 APPA027, , 2304x1440, 12.00 | |
|---|---|---|---|---|---|---|---|---|
| Display | 25% | 1% | -6% | -17% | -2% | -1% | ||
| Display P3 Coverage | 67.8 | 99.2 46% | 68.9 2% | 64.4 -5% | 54.8 -19% | 65.9 -3% | 68 0% | |
| sRGB Coverage | 96.1 | 99.9 4% | 98.4 2% | 90.5 -6% | 82.5 -14% | 95.2 -1% | 94.7 -1% | |
| AdobeRGB 1998 Coverage | 69.8 | 87.1 25% | 69.5 0% | 65.2 -7% | 56.6 -19% | 67.6 -3% | 69.2 -1% | |
| Response Times | -6% | -72% | -9% | -21% | 4% | -71% | -2% | |
| Response Time Grey 50% / Grey 80% * | 39.6 ? | 42.8 ? -8% | 67.2 ? -70% | 44.8 ? -13% | 31 ? 22% | 40.4 ? -2% | 69.2 ? -75% | 40.8 ? -3% |
| Response Time Black / White * | 28 ? | 28.8 ? -3% | 41.6 ? -49% | 29.2 ? -4% | 24 ? 14% | 25.6 ? 9% | 46.4 ? -66% | 29.2 ? -4% |
| PWM Frequency | 113600 ? | 2500 ? -98% | 1000 ? -99% | 116000 2% | ||||
| Screen | -4% | -58% | -143% | -25% | -124% | -73% | ||
| Brightness middle | 320 | 588 84% | 496.4 55% | 299 -7% | 289 -10% | 442.7 38% | 392 23% | |
| Brightness | 315 | 561 78% | 469 49% | 300 -5% | 310 -2% | 428 36% | 390 24% | |
| Brightness Distribution | 95 | 92 -3% | 84 -12% | 92 -3% | 85 -11% | 84 -12% | 89 -6% | |
| Black Level * | 0.29 | 0.45 -55% | 0.5 -72% | 0.26 10% | 0.23 21% | 0.31 -7% | 0.24 17% | |
| Contrast | 1103 | 1307 18% | 993 -10% | 1150 4% | 1257 14% | 1428 29% | 1633 48% | |
| Colorchecker dE 2000 * | 1.2 | 1.7 -42% | 2.9 -142% | 5.6 -367% | 1.64 -37% | 2.24 -87% | 3.2 -167% | |
| Colorchecker dE 2000 max. * | 3.2 | 3.5 -9% | 5.26 -64% | 9.1 -184% | 3.31 -3% | 7.19 -125% | 6.3 -97% | |
| Colorchecker dE 2000 calibrated * | 0.5 | 2.6 -420% | 0.99 -98% | 1.11 -122% | 1.4 -180% | |||
| Greyscale dE 2000 * | 0.8 | 1.9 -138% | 3.9 -388% | 5.5 -588% | 1.71 -114% | 9.7 -1113% | 4.5 -463% | |
| Gamma | 2.2 100% | 2.33 94% | 2.066 106% | 2.47 89% | 2.32 95% | 1.42 155% | 2.2 100% | |
| CCT | 6548 99% | 6738 96% | 7169 91% | 7533 86% | 6291 103% | 6227 104% | 7556 86% | |
| Color Space (Percent of AdobeRGB 1998) | 62.1 | 77.92 25% | 63.9 3% | 58.9 -5% | 52 -16% | 61.6 -1% | 63.9 3% | |
| Color Space (Percent of sRGB) | 96 | 99.94 4% | 98.2 2% | 90.3 -6% | 82 -15% | 95 -1% | 95 -1% | |
| Total Average (Program / Settings) | 5% /
2% | -43% /
-50% | -53% /
-100% | -21% /
-23% | -41% /
-85% | -48% /
-59% | -2% /
-2% |
* ... smaller is better
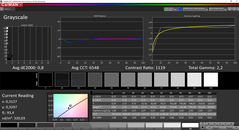
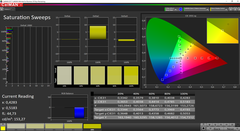
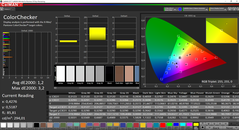
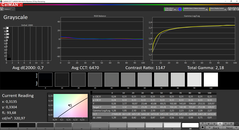
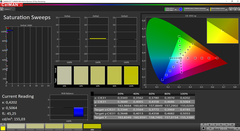
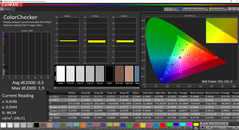
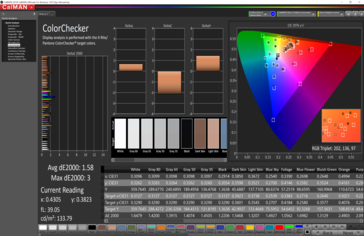
There is absolutely no criticism for the colors and the grayscale performance out of the box. There is not much to improve here, because the average DeltaE-2000 deviation of the grayscale is just 0.8 (compared to sRGB) and there is no color cast. Almost all the colors are below the important mark of 3 as well, only orange just misses the mark at 3.2. Calibration by the user is therefore not really necessary and the new MacBook Air is a very good device for picture and video-editing, at least if you are working in the sRGB color space.
It is still worth the effort if you can calibrate the panel. We used our X-Rite i1 Pro 2 for the profiling and the corresponding profile is linked in the display box above and can be downloaded for free. The grayscale performance did not really change since the default results were already good. The color performance on the other hand is improved with a maximum deviation of 1.9 (blue), with an excellent average value of just 0.5. We already suspected the panel covers sRGB almost completely, and the wider AdobeRGB gamut by 62.1%.
There is no PWM in the traditional sense, but we determine a flickering of the background illumination when the brightness drops to 75% or lower. However, the frequency is extremely high at 113 kHz, so even very-sensitive users should not have any issues with the panel of the new MacBook Air.
Screen Flickering / PWM (Pulse-Width Modulation)
| Screen flickering / PWM detected | 113600 Hz | ≤ 75 % brightness setting | |
The display backlight flickers at 113600 Hz (worst case, e.g., utilizing PWM) Flickering detected at a brightness setting of 75 % and below. There should be no flickering or PWM above this brightness setting. The frequency of 113600 Hz is quite high, so most users sensitive to PWM should not notice any flickering. In comparison: 53 % of all tested devices do not use PWM to dim the display. If PWM was detected, an average of 17942 (minimum: 5 - maximum: 3846000) Hz was measured. | |||
Display Response Times
| ↔ Response Time Black to White | ||
|---|---|---|
| 28 ms ... rise ↗ and fall ↘ combined | ↗ 15.6 ms rise | |
| ↘ 12.4 ms fall | ||
| The screen shows relatively slow response rates in our tests and may be too slow for gamers. In comparison, all tested devices range from 0.1 (minimum) to 240 (maximum) ms. » 67 % of all devices are better. This means that the measured response time is worse than the average of all tested devices (21.5 ms). | ||
| ↔ Response Time 50% Grey to 80% Grey | ||
| 39.6 ms ... rise ↗ and fall ↘ combined | ↗ 20.8 ms rise | |
| ↘ 18.8 ms fall | ||
| The screen shows slow response rates in our tests and will be unsatisfactory for gamers. In comparison, all tested devices range from 0.2 (minimum) to 636 (maximum) ms. » 55 % of all devices are better. This means that the measured response time is worse than the average of all tested devices (33.8 ms). | ||
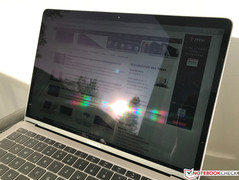
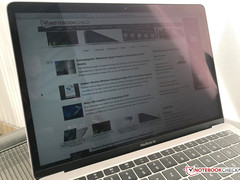
Apple now uses a glossy panel surface compared to the old MacBook Air and the degree of reflection is similar to the other current MacBooks. However, the panel of the Air is not as bright, so you are basically limited to the shade when you want to work outdoors. You definitely have to adjust the angle of the screen to avoid reflections from light sources or bright surfaces. The IPS panel with its wide viewing angles certainly helps in this respect.
400 cd/m² Update
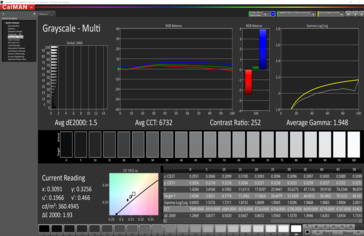
In April Apple released a software update for the MacBook Air that enables a higher peak brightness. We now had the chance to test a second model with the newest software version. And indeed the maximum brightness was 13% higher than in our first test with 360 cd/m² versus 320 cd/m². This is still not 400 cd/m² but definitely better and could be noticeable in bright environments. The color accuracy however was slightly worse for ColorChecker and Grayscale but still very good.
Performance
The performance is an interesting topic for the new MacBook Air, because the designation of the processor suggests a higher performance level for many customers. Contrary to almost all other Core i5-8xxx CPUs with four native CPU cores, Apple only implements a dual-core processor. Thanks to fast PCIe-storage, the subjective performance impression with everyday tasks is still very good. Most users who do not know if they need a dual-core or a quad-core should be fine with the less-powerful model. The memory (either 8 or 16 GB LPDDR3-2133) is soldered onto the motherboard and cannot be upgraded.
Processor – Amber Lake-Y
Intel's current nomenclature can make it very tricky to assess the level processor performance. Apple uses an 8th generation Core processor with the designation Core i5-8210Y. The "Y" at the end indicates a very efficient processor, which can usually be cooled passively. The architecture is called Amber Lake-Y, which is based on Kaby Lake-Y used in the small MacBook 12. In short, it is a slightly beefed-up version of the MacBook 12 processor and one of the slowest chips based on Intel's current 14 nm++ manufacturing process. The big difference to the MacBook 12, however, is the additional fan. This is unusual for this type of processor and should improve the performance, especially during sustained workloads. We will have another look at the cooling solution, but it looks like there is no heatpipe, so the fan is not directly connected to the heat sink.
Intel specifies the TDP for the Core i5-8210Y with just 4.5 W, which can be increased up to 7 W by the manufacturer. Apple usually removes all the TDP limitations though, at least as the CPU temperature and the cooling solution, respectively, allows it. The base frequency of the Core i5 is just 1.6 GHz with a maximum Turbo Boost of up to 3.6 GHz for one core and 3.0 GHz for two cores. Hyper-Threading is supported as well, so the chip can execute four threads simultaneously. More technical information about the Core i5-8210Y is available here.
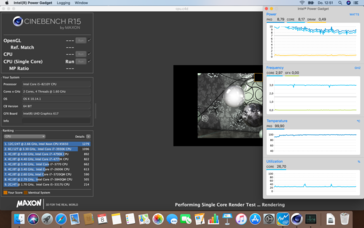
The CPU runs at up to 3.0 GHz in the Cinebench Single test, which corresponds with a power consumption of around 10 Watts. The maximum value of 3.6 GHz is clearly missed, but the CPU temperature still reaches about 100 °C. The CB score is 131 points, which is just 10% slower than the 2017 MacBook Pro 13 but also just 9% faster than the MacBook 12 and 12% faster than the old-generation MacBook Air.
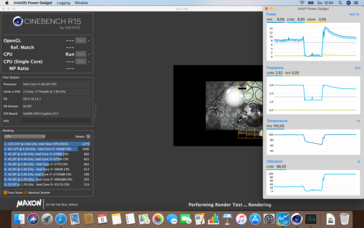
We see the maximum Turbo of 2x 3.0 GHz during the Cinebench Multi test for the first ~10 seconds at a consumption of almost 15 Watts. However, this drops to just 2x 2.5 GHz (10 W) after another 20 seconds. The results can fluctuate a bit depending on whether the fan is already running or not. We got scores between 267 and 285 points. Both the old MacBook Air with the 5th generation Core i5 and the MacBook 12 with the Core m3 are not or just slower in one Cinebench run. This basically means the new MacBook Air only has a performance advantage for about 10 seconds compared to these two laptops, because the fan control is very slow. This improves the noise levels but not the performance. The old 2017 MacBook Pro with the Core i5 is almost 30% faster and all other competitors with modern quad-core chips are between 80 and 140% faster. The CPU performance of the MacBook Air is not reduced on battery power.
Our Cinebench Multi loop shows an interesting behavior. The first run benefits from the higher initial performance, but the score drops a bit in the second and third run. The fan slowly increases its speed during this time and reaches its full speed after 4-5 minutes. The result then stabilizes and improves again. The power consumption of the CPU levels off at 10.3 up to 10.4 Watts with a core clock of 2.6 GHz. Apple once again accepts high CPU core temperatures, and the chip always hovers at 98-99 °C.
What does this mean? Well, the new MacBook Air can handle short peak load scenarios (which are common in practice) very well, or it needs a few minutes under sustained workloads to reach the maximum fan speed to ensure a steady performance. The latter will suffer a bit until this time. However, one thing is absolutely certain: The fan is just way too loud for this performance class or the cooling solution is just not very effective, respectively. We will add the exact numbers in one of the next updates.
The passively cooled MacBook 12 suffers from performance drops with time, while the old 2017 MacBook Pro 13 (function keys) is about 25% faster. The current MacBook Pro 13 with the quad-core ULV-chip is not listed in this diagram, because it is in a completely different performance class at around 700 points.
System Performance
Synthetic benchmarks are one thing, but the majority of users primarily want to know how fast the machine is during everyday tasks. The subjective performance impression is influenced by the processor and the storage solution in particular. Apple equips the new MacBook Air with modern components, so there should not be any issues. However, we can only confirm that for light/moderate workloads. We noticed occasional lags/hiccups especially during multitasking (multiple apps launched, multiple browser tabs), something you do not expect from such an expensive machine.
All of our tested synthetic benchmarks of the PCMark series produced very low scores. They are even significantly lower compared to the predecessor or the smaller MacBook 12, respectively. We had to repeat some of the tests due to crashes, so we think the Boot Camp drivers still lack optimization. Windows itself still ran well on the new Air.
| PCMark 8 Home Score Accelerated v2 | 2484 points | |
| PCMark 8 Creative Score Accelerated v2 | 3285 points | |
| PCMark 8 Work Score Accelerated v2 | 3209 points | |
| PCMark 10 Score | 2174 points | |
Help | ||
Storage Devices – PCIe-SSD
Apple only uses fast PCIe-SSD storage soldered directly onto the motherboard, so you cannot upgrade it. Our test unit for 1599 Euros (~$1817) is equipped with a 256 GB drive, but the entry-level SKU only gets a 128 GB drive. This results in a massive additional charge of 250 Euros (~$284) for the 256 GB drive. 512 GB will cost another 250 Euros (~$284) and the 1.5 TB option even 1250 Euros (~$1421). Apple always charged a lot for memory/storage upgrades, but we believe the entry-level SKU should come with the 256 GB option by default. A quick comparison with some retail prices for M.2 SSDs (e.g. Samsung 970 EVO 1 TB for ~260 Euros, ~$295) also shows the overpriced upgrades.
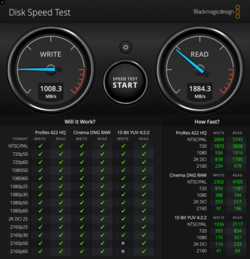
The performance of the SSD (Apple AP0256) is decent, but other drives are much faster. The write performance in particular is not very good with sequential transfer rates of around 1000 MB/s and the larger drives with 512 GB or even 1.5 TB should have an advantage. Please see our comprehensive SSD/HDD list for more comparisons with other drives.
| Apple MacBook Air 2018 Apple SSD AP0256 | Apple MacBook Pro 13 2017 Apple SSD AP0128 | Apple MacBook 12 2017 Apple SSD AP0256 | Dell XPS 13 9370 i5 UHD Toshiba XG5 KXG50ZNV256G | Asus ZenBook S UX391U Samsung PM961 NVMe MZVLW512HMJP | HP Envy 13-ah0003ng SK Hynix BC501 HFM512GDJTNG | Microsoft Surface Laptop 2-LQN-00004 SK Hynix BC501 NVMe 256 GB | Average Apple SSD AP0256 | |
|---|---|---|---|---|---|---|---|---|
| CrystalDiskMark 5.2 / 6 | 12% | 2% | 16% | 23% | -4% | -8% | 9% | |
| Write 4K | 118 | 16.02 -86% | 95.7 -19% | 121.4 3% | 98.9 -16% | 112.9 -4% | 87.3 -26% | 63 ? -47% |
| Read 4K | 29.97 | 22.9 -24% | 22.8 -24% | 33.42 12% | 38.33 28% | 38.69 29% | 36.52 22% | 25.3 ? -16% |
| Write Seq | 1000 | 722 -28% | 867 -13% | 385.3 -61% | 1414 41% | 654 -35% | 716 -28% | 1118 ? 12% |
| Read Seq | 1218 | 1807 48% | 940 -23% | 1958 61% | 1051 -14% | 642 -47% | 1009 -17% | 1308 ? 7% |
| Write 4K Q32T1 | 232.1 | 416.5 79% | 342 47% | 375.7 62% | 370.7 60% | 305.9 32% | 324.1 40% | 296 ? 28% |
| Read 4K Q32T1 | 254 | 538 112% | 437.5 72% | 364.1 43% | 251.4 -1% | 351.6 38% | 249 -2% | 454 ? 79% |
| Write Seq Q32T1 | 1001 | 733 -27% | 1085 8% | 1069 7% | 1606 60% | 869 -13% | 811 -19% | 1155 ? 15% |
| Read Seq Q32T1 | 2555 | 3121 22% | 1634 -36% | 2564 0% | 3218 26% | 1683 -34% | 1631 -36% | 2344 ? -8% |
GPU Performance – UHD Graphics 617
All the graphics calculations are handled by the Intel UHD Graphics 617. It is the direct successor to the UHD Graphics 615 (Kaby Lake-Y). The GT2 version of the integrated graphics adapter has 24 execution units clocked at up to 1050 MHz in the case of the MacBook Air. Contrary to the Iris GPUs of the MacBook Pro models, the UHD Graphics is not equipped with its own storage or eDRAM cache, respectively, so it shares the memory with the rest of the system.
The biggest advantage of the UHD Graphics 617 is the integrated video decoder, which takes off load from the processor when you watch high-resolution videos. Even 4K movies are no problem and the playback is completely smooth. This means the MacBook Air is well-equipped for common multimedia apps like YouTube, Netflix, or Amazon Prime, but the iGPU is not powerful enough for more complex tasks (like heavy video-editing).
Apple's new MacBook Air is not very good in the synthetic benchmarks, even though this is not surprising considering the specs. The predecessor with the old Intel HD Graphics 6000 is just beaten by 6% in 3DMark 11. It is also ahead of the small MacBook 12 in the new 3DMark, but the Air is otherwise at the bottom of our comparison group.
| 3DMark 06 Standard Score | 8662 points | |
| 3DMark 11 Performance | 1711 points | |
| 3DMark Cloud Gate Standard Score | 4841 points | |
| 3DMark Fire Strike Score | 845 points | |
| 3DMark Time Spy Score | 322 points | |
Help | ||
Gaming Performance
The gaming benchmark caused some issues, because we could not test Fortnite. It repeatedly crashed during the loading screen (both macOS as well as Windows). Every potential buyer should know the new MacBook Air is no gaming laptop, and you are also limited to low details when you play older games like BioShock Infinite or eSports titles like Rocket League.
You can increase the graphics performance with an external GPU attached to one of the Thunderbolt 3 ports. We only had the Thunderbolt 3 Graphics Dock from Lenovo for testing purposes, which is equipped with a GeForce GTX 1050. The docking station was recognized in macOS, but we could not use the graphics card. Unfortunately, we cannot show any Windows results, either, because there were massive problems despite the installation of the corresponding drivers. The GPU was either not recognized or the system crashed. We even had to delete Windows and install it once again because it did not work anymore.
We also think you will be better off with a MacBook Pro if you plan on using an external GPU to avoid performance bottlenecks due to the slow processor. Otherwise, you would just slow down the expensive eGPU.
| low | med. | high | ultra | |
| BioShock Infinite (2013) | 47.6 | 27.9 | 25 | 8.4 |
| Rise of the Tomb Raider (2016) | 16.1 | |||
| Rocket League (2017) | 61.2 | 26 | 18.3 |
Emissions
System Noise
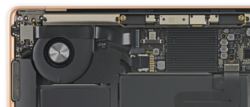
The MacBook Air 2018 is a passively cooled device in the first place, just like the small MacBook 12. There is a heat sink on top of the processor with small cooling fins. However, Apple still integrates a small fan at the right rear to ensure performance sustainability, which we saw in the CPU section. There is no heat pipe from the processor to the fan, so it is only supposed to improve air circulation inside the chassis.
So what does all this mean for your everyday work? The fan is usually deactivated and does not spin up in most everyday situations. The fan will start spinning under load after about 15-20 seconds but is still hardly audible. The fan speed is seamlessly increased after this and it takes a couple of minutes before you can hear the full fan noise. Our Cinebench R15 Multi loop (macOS) is a good example. The fan starts spinning after about 15 seconds at 29 dB(A) but is only audible when you hold your ears against the fan exhaust. We measure 30 dB(A) after 2 minutes, 32 dB(A) after 4 minutes, 35 dB(A) after 6 minutes, 39 dB(A) after 8 minutes, and finally 41.8 dB(A) after 10 minutes. This behavior applies for mains, battery power, and for Windows via Boot Camp, even though the fan speed ramps up slightly faster on the latter. The fan speed also fluctuates a bit (~0.3 dB(A)) on its highest setting, which is a bit annoying. The noise characteristic itself is a rather deep murmur and not very disturbing, but we can also hear a slight high-frequency sound at 37 dB(A) and higher. The fan will stop within 1.2 minutes after the load period.
Benchmarks are one thing, but you might also be confronted with the loud fan in more common situations. We experienced it during the installation of Fortnite, for example. The fan reached its maximum noise (41.8 dB(A)) after a few minutes during the download/installation of the game and stayed like this for the remaining 30 minutes or so. This will not happen every day, but we still think this is just too loud when you consider the low performance level of the laptop. You will also reach this noise level when you play games.
We did not hear electronic sounds or coil whine.
Noise Level
| Idle |
| 28.5 / 28.5 / 28.5 dB(A) |
| Load |
| 30 / 41.8 dB(A) |
 | ||
30 dB silent 40 dB(A) audible 50 dB(A) loud |
||
min: | ||
Temperature
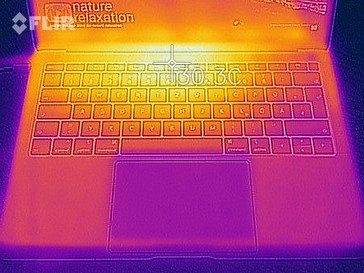
The temperature development on a passively cooled device is always interesting, but we could not measure critical surface temperatures on the new MacBook Air. However, we will start with the idling scenario or low workloads like text editing, respectively. The metal chassis stays comfortably cool in these scenarios (less than 24 °C) and there are no hotspots.
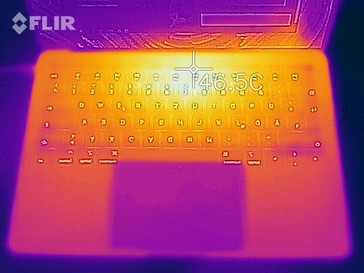
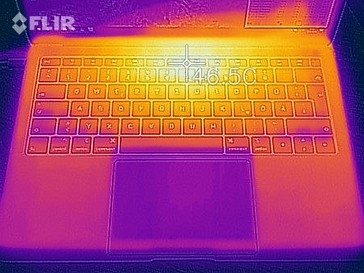
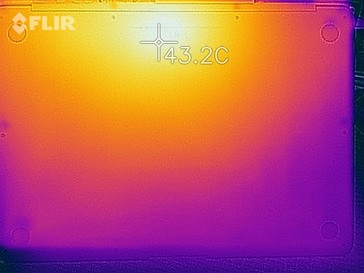
The playback of YouTube videos is certainly another important scenario for the Air, so we checked the temperature development there as well. The fan is idling after 30 minutes (Safari, YouTube 4K), but the central upper keyboard area gets noticeably warmer at around 30 °C. That Apple's new MacBook Air does not have much headroom in terms of performance is also visible during the installation of Fortnite. The combined download/installation process in the Epic Launcher results in the maximum fan speed and the surface temperatures are comparable to our synthetic stress test scenario. We measure around 45 °C and the hot spot is directly above the keyboard, while the bottom stays a bit cooler due to the passive cooling unit between the CPU and the case. You will notice the high temperatures during typing and direct contact with the metal surfaces is not very comfortable.
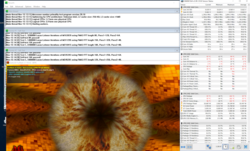
The CPU tests already showed that the processor maintains a consumption of little more than 10 W under sustained workloads. This is also the case in our stress test with the two tools Prime95 and FurMark, so the low performance level can be maintained, but the CPU once again reaches a temperature of almost 100 °C. The GPU now utilizes a part of the TDP envelope, so the CPU clock drops from 2.5-2.6 GHz (Cinebench) to just 1.4 GHz. The Windows tools unfortunately did not show the GPU clock.
(±) The maximum temperature on the upper side is 44.4 °C / 112 F, compared to the average of 35.9 °C / 97 F, ranging from 21.4 to 59 °C for the class Subnotebook.
(±) The bottom heats up to a maximum of 41.2 °C / 106 F, compared to the average of 39.4 °C / 103 F
(+) In idle usage, the average temperature for the upper side is 22.7 °C / 73 F, compared to the device average of 30.7 °C / 87 F.
(+) The palmrests and touchpad are cooler than skin temperature with a maximum of 28.4 °C / 83.1 F and are therefore cool to the touch.
(±) The average temperature of the palmrest area of similar devices was 28.3 °C / 82.9 F (-0.1 °C / -0.2 F).
Speakers
The two speakers of the Apple MacBook Air 2018 are located next to the keyboard and direct the sound towards the user. The maximum volume is not as high as on the MacBook 12, but the subjective audio performance is still very rich and powerful. There is even some bass and it is no problem to listen to some music or watch videos. Our measurements also confirm the good results and the overall performance is even ahead of the MacBook 12.
Apple MacBook Air 2018 audio analysis
(±) | speaker loudness is average but good (75 dB)
Bass 100 - 315 Hz
(±) | reduced bass - on average 8.1% lower than median
(±) | linearity of bass is average (10% delta to prev. frequency)
Mids 400 - 2000 Hz
(+) | balanced mids - only 2.9% away from median
(+) | mids are linear (5.6% delta to prev. frequency)
Highs 2 - 16 kHz
(+) | balanced highs - only 2.2% away from median
(+) | highs are linear (4.5% delta to prev. frequency)
Overall 100 - 16.000 Hz
(+) | overall sound is linear (12.3% difference to median)
Compared to same class
» 13% of all tested devices in this class were better, 3% similar, 84% worse
» The best had a delta of 5%, average was 19%, worst was 53%
Compared to all devices tested
» 8% of all tested devices were better, 2% similar, 90% worse
» The best had a delta of 4%, average was 25%, worst was 134%
Energy Management – New MBA is enduring
Power Consumption
The new Apple MacBook Air is a very efficient laptop and only consumes more power than its rivals in the idle max scenario. The keyboard illumination is also very economic, because the difference between the deactivated illumination and maximum intensity is just ~1 W. This difference can be much higher on other notebooks. We measure a maximum power consumption of around 30 W for the first couple of seconds under maximum load, which is also the maximum output of the power adapter. The consumption eventually levels out at 22 Watts over the course of the stress test.
We also tried a more powerful USB-C power adapter (65 W), which resulted in a maximum consumption of 52.1 Watts, but this value also quickly drops below 30 Watts. This means a more powerful PSU would have a positive effect on short peak load and the charging time in particular (also see next chapter).
| Off / Standby | |
| Idle | |
| Load |
|
| Apple MacBook Air 2018 i5-8210Y, UHD Graphics 617, Apple SSD AP0256, IPS, 2560x1600, 13.30 | Apple MacBook Air 13.3" 1.8 GHz (2017) 5350U, HD Graphics 6000, Apple SSD SM0128G, TN LED, 1440x900, 13.30 | Apple MacBook Pro 13 2017 i5-7360U, Iris Plus Graphics 640, Apple SSD AP0128, IPS, 2560x1600, 13.30 | Apple MacBook 12 2017 m3-7Y32, HD Graphics 615, Apple SSD AP0256, LED IPS, 2304x1440, 12.00 | Apple MacBook Pro 13 2018 Touchbar i5 i5-8259U, Iris Plus Graphics 655, , IPS, 2560x1600, 13.30 | Dell XPS 13 9370 i5 UHD i5-8250U, UHD Graphics 620, Toshiba XG5 KXG50ZNV256G, IPS, 3840x2160, 13.30 | Asus ZenBook S UX391U i5-8550U, UHD Graphics 620, Samsung PM961 NVMe MZVLW512HMJP, IPS, 1920x1080, 13.30 | HP Envy 13-ah0003ng i5-8550U, GeForce MX150, SK Hynix BC501 HFM512GDJTNG, IPS, 1920x1080, 13.30 | Huawei Matebook X Pro i5 i5-8250U, GeForce MX150, Samsung PM961 MZVLW256HEHP, IPS, 3000x2000, 13.90 | Average Intel UHD Graphics 617 | Average of class Subnotebook | |
|---|---|---|---|---|---|---|---|---|---|---|---|
| Power Consumption | -20% | -32% | 20% | -59% | -52% | -33% | -52% | -63% | 0% | -73% | |
| Idle Minimum * | 2.2 | 3.4 -55% | 3.7 -68% | 2 9% | 2.3 -5% | 4.3 -95% | 3.24 -47% | 5.3 -141% | 3.5 -59% | 2.2 ? -0% | 4.9 ? -123% |
| Idle Average * | 5.7 | 6.3 -11% | 5.2 9% | 5.4 5% | 8.7 -53% | 8 -40% | 6.1 -7% | 7.3 -28% | 8.9 -56% | 5.7 ? -0% | 8.36 ? -47% |
| Idle Maximum * | 10.3 | 7 32% | 7.6 26% | 6.6 36% | 12.2 -18% | 8.1 21% | 9.2 11% | 9.3 10% | 12.3 -19% | 10.3 ? -0% | 10.4 ? -1% |
| Load Average * | 25.6 | 34.5 -35% | 41.6 -63% | 22 14% | 53.3 -108% | 46.6 -82% | 38.8 -52% | 39 -52% | 54.2 -112% | 25.6 ? -0% | 45.9 ? -79% |
| Load Maximum * | 30.6 | 40 -31% | 50.5 -65% | 20 35% | 64 -109% | 49.8 -63% | 52.6 -72% | 46 -50% | 52.1 -70% | 30.6 ? -0% | 66 ? -116% |
| Witcher 3 ultra * | 42.4 |
* ... smaller is better
Battery Runtime
Compared to the old MacBook Air and the 2017 MacBook Pro 13, Apple had to reduce the battery capacity a bit due to the slimmer front area of the base unit. Instead of 54 Wh, the new Air only gets a 50.3 Wh model.
Our runtime tests show very good results and the MacBook Air beats all of the comparison devices. We determine a little more than 12 hours in our WLAN test with the default Safari browser. Google's Chrome is another popular browser, so we tested it as well with macOS. The result is about 50 minutes shorter, but more than 11 hours is still a very good result. The stamina benefits from the Amber Lake-Y CPU, even though the MacBook Pro 13 2017 is not far behind, either. Our video test with the short movie Big Buck Bunny (H.264, 1080p, 150 nits) runs for 12:20 hours and confirms the good stamina. The minimum runtime is a little more than two hours (2:11 hours).
You also need some stamina when you want to recharge the MacBook Air. macOS shows an estimated charging time of 3:25 hours when the battery is completely empty (0%), but it does not take that long. We see 20% after 30 minutes, 43% after 60 minutes, and 90% after 2 hours. The last 10% takes another ~30 minutes, so the total charging time is 2.5 hours. The macOS estimate with a 65 W power adapter is 2:33 hours, but this is once again a bit too long. We see 35% after 30 minutes, 71% after 60 minutes, 90% after 90 minutes and 100% after 110 minutes.
| Apple MacBook Air 2018 i5-8210Y, UHD Graphics 617, 50.3 Wh | Apple MacBook Pro 13 2017 i5-7360U, Iris Plus Graphics 640, 54.5 Wh | Apple MacBook Air 13.3" 1.8 GHz (2017) 5350U, HD Graphics 6000, 54 Wh | Apple MacBook 12 2017 m3-7Y32, HD Graphics 615, 41.4 Wh | Dell XPS 13 9370 i5 UHD i5-8250U, UHD Graphics 620, 52 Wh | Asus ZenBook S UX391U i5-8550U, UHD Graphics 620, 50 Wh | Microsoft Surface Laptop 2-LQN-00004 i5-8250U, UHD Graphics 620, 45 Wh | HP Envy 13-ah0003ng i5-8550U, GeForce MX150, 53.2 Wh | Huawei Matebook X Pro i5 i5-8250U, GeForce MX150, 57.4 Wh | Average of class Subnotebook | |
|---|---|---|---|---|---|---|---|---|---|---|
| Battery Runtime | -19% | -4% | -19% | -29% | -19% | -22% | -20% | -8% | -9% | |
| WiFi v1.3 | 668 | 681 2% | 638 -4% | 540 -19% | 408 -39% | 491 -26% | 543 -19% | 481 -28% | 557 -17% | 629 ? -6% |
| Load | 131 | 78 -40% | 106 -19% | 115 -12% | 98 -25% | 116 -11% | 133 2% | 115.4 ? -12% |
Verdict – MacBook Air 2018
Pros
Cons
After our time with the new MacBook Air, we are still struggling with the verdict. Besides the device itself, you also have to consider Apple's other laptops, especially the two 13-inch MacBook Pro models. But let's start with the new Air first.
Many customers have waited years for a new MacBook Air. The highlight of the redesign is obviously the screen, which features a high resolution compared to the old Air. However, the quality is not as good as the screen on the more expensive MacBook Pro, neither in terms of luminance nor color gamut. Apple still deserves praise for the great calibration out of the box, because basically all measurements are already in the target range. The new Air also has a glossy screen, which is not surprising, but it is still noticeable compared to the previous generation.
The processor does not leave a good impression after the initial benchmarks, because the performance hardly improved over the small MacBook 12 and the old MacBook Air. The new Air can sustain the (low) level of performance even after longer periods, but you are confronted with a loud fan in return. The latter cannot be justified at this performance level. So is the performance sufficient for many daily tasks? Yes, at least for now. The competition uses much faster CPUs, though, and they are better equipped for the future.
Our initial battery runtime tests determine long results between 11 and 12 hours in the Wi-Fi test, but it also takes quite a while before the battery is charged again. The touchpad is still the benchmark in the notebook segment and the keyboard features a precise stroke, but the typing experience is a matter of taste and you should definitely try it out before you buy the laptop. Overall, the new MacBook Air is still a very good, although very expensive, subnotebook.
The new MacBook Air is better than its predecessor in pretty much every regard, but this is not surprising considering the age of the old model. We like the display, and the performance is sufficient for everyday tasks. If you are looking for a slim laptop with macOS and you don't mind the high price, the new Air is a good choice. However, it is neither without competition nor very innovative.
The comparison with the MacBook Pro 13, more precisely the less-expensive model without the Touch Bar, gives us a bit of a headache though. The new case is certainly very good, but there is not a huge mobility advantage over the MacBook Pro 13. The footprint is identical and the rear of the Air is even slightly thicker compared to the Pro. The weight difference is not crucial, either, at just 100 grams, and it should not influence the purchase decision. The MacBook 12 is still the best choice if you want the most compact Apple laptop.
"MacBook Air" is a very popular brand name, so it makes a lot of sense to continue the series for Apple. The Air used to be the best MacBook for many customers. However, the new Air is much more expensive, and we think it is too expensive, especially considering the comparatively low CPU performance. This is a problem for customers, because Apple holds back a better laptop: the "cheaper" 13-inch MacBook Pro with an 8th Gen. Intel processor, the improved keyboard including Touch-ID and maybe even a TrueTone display. This device would have been an easy recommendation. But Apple could not have justified the new MacBook Air or its high price, respectively. It looks like the marketing department won in this case and we expect Apple will discontinue the MacBook Pro 13 with Function Keys pretty soon. An updated 2018 MacBook Pro 13 with Function Keys would have been the better product for customers.
Due to the higher price, the new MacBook Air competes with the "smaller" MacBook Pro 13. Apple obviously knew that for a while and decided not to update the MacBook Pro 13 with Function keys this year. Even the 2017 model is still faster and has a better display, so it should still be the better choice for many users.
Apple MacBook Air 2018
-
12/23/2018 v6(old)
Andreas Osthoff


 Deutsch
 English
 Español
 Français
 Italiano
 Nederlands
 Polski
 Português
 Русский
 Türkçe
 Svenska
 Chinese
 Magyar


