Notebookcheck Logo

Qualcomm Adreno 725 vs Qualcomm Adreno 720

Qualcomm Adreno 725

► remove from comparison Qualcomm Adreno 725

The Qualcomm Adreno 725 is an integrated graphics unit for smartphones and tablets, which is used in the Snapdragon 7+ Gen. 2 and is designed for smartphones as well as tablets. The associated SoC (system-on-a-chip) was introduced at the beginning of 2023. 

Qualcomm promises a performance increase of up to 100 percent compared with the predecessor Adreno 644.

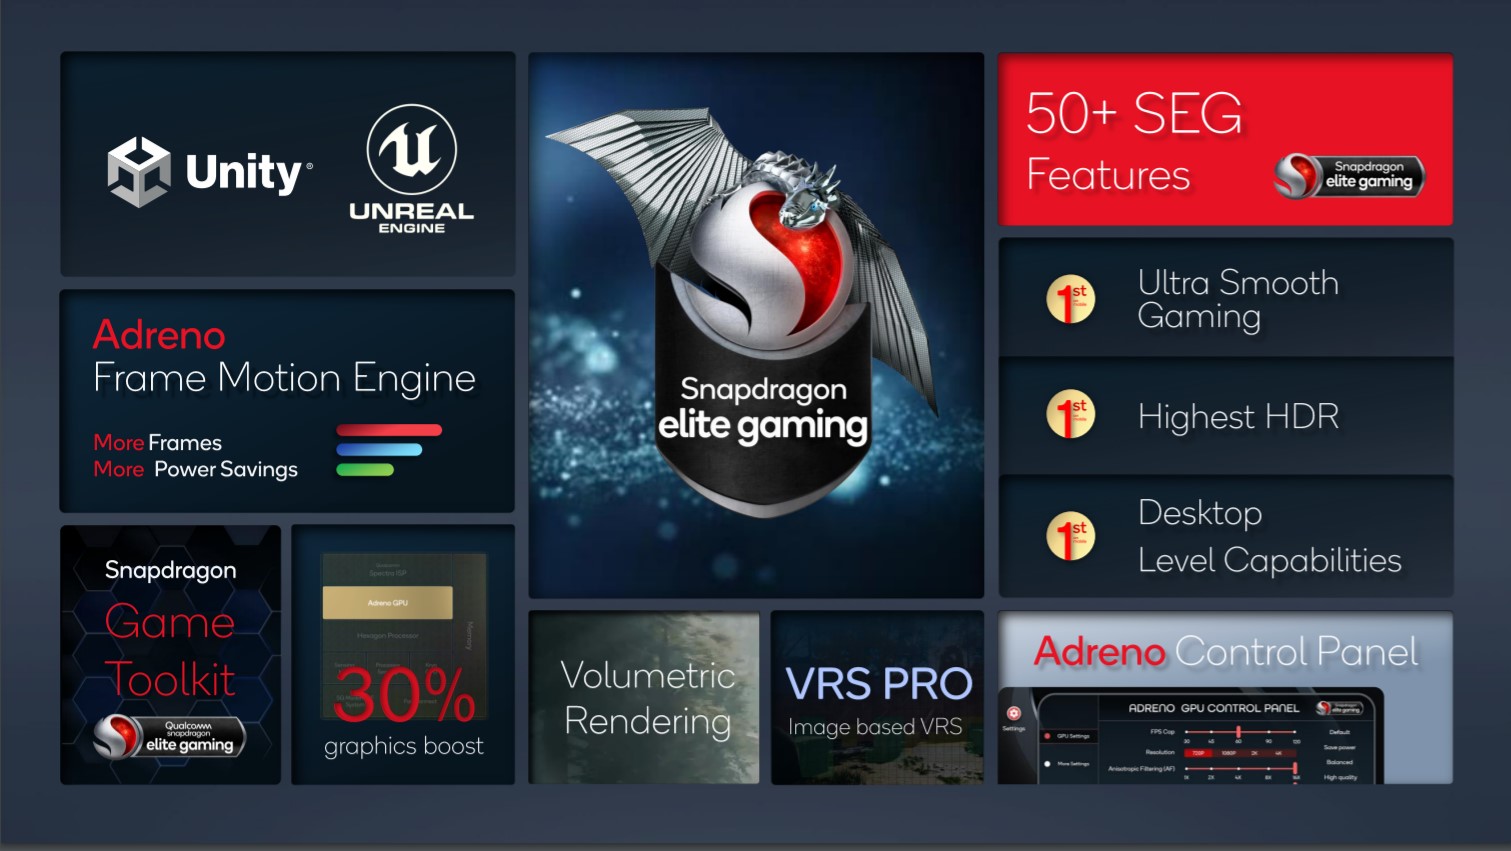
The Adreno 725 supports all common Android APIs like Vulkan 1.1 and is already prepared for use with the Unreal 5 engine.

Qualcomm Adreno 720

► remove from comparison Qualcomm Adreno 720

The Adreno 720 is a graphics unit for smartphones and tablets, which was first used in the Qualcomm Snapdragon 7 Gen 3 was installed. The chip was introduced at the end of 2023 and is primarily used in Android-based upper mid-range devices.

HDR gaming with 10-bit color depth is possible with the graphics chip, and the Adreno 720 also supports the APIs OpenGL ES 3.2, OpenCL 2.0 FP and Vulkan 1.3.

The GPU is capable of driving WFHD+ displays at up to 168 Hz and 4K displays at 60 Hz and offers support for HDR10+, HLG and Dolby Vision.

Qualcomm Adreno 725Qualcomm Adreno 720
Adreno 700 Series
Adreno 750 compare
Adreno 740 compare
Adreno 730 compare @ 0.8 GHz
Adreno 725 @ 0.8 GHz
Adreno 720 @ 0.8 GHz
Adreno 710 compare @ 0.8 GHz
Adreno 750 compare
Adreno 740 compare
Adreno 730 compare @ 0.8 GHz
Adreno 725 @ 0.8 GHz
Adreno 720 @ 0.8 GHz
Adreno 710 compare @ 0.8 GHz
Core Speed800 (Boost) MHz800 (Boost) MHz
Shared Memoryyesyes
APIDirectX 12, OpenGL ES 3.2DirectX 12, OpenGL ES 3.2
technology4 nm4 nm
FeaturesOpenGL ES 3.2, OpenCL 2.0, DirectX 12, Vulkan 1.1OpenGL ES 3.2, OpenCL 2.0, DirectX 12, Vulkan 1.1
Date of Announcement30.11.2021 17.11.2024
CPU in Adreno 725GPU Base SpeedGPU Boost / Turbo
Qualcomm Snapdragon 7+ Gen 28 x 1800 MHz? MHz? MHz
CPU in Adreno 720GPU Base SpeedGPU Boost / Turbo
Qualcomm Snapdragon 7 Gen 38 x 1800 MHz? MHz? MHz

Benchmarks

3DMark - 3DMark Sling Shot (ES 3.0) Unlimited
11837 Points (51%)
3DMark - 3DMark Sling Shot (ES 3.0) Unlimited Graphics
20476 Points (45%)
3DMark - 3DMark Sling Shot Extreme (ES 3.1) Unlimited
10274 Points (51%)
3DMark - 3DMark Sling Shot Extreme (ES 3.1) Unlimited Graphics
14801 Points (44%)
3DMark - 3DMark Wild Life Unlimited
7701 Points (4%)
5434 Points (3%)
3DMark - 3DMark Wild Life Extreme Unlimited
1968 Points (2%)
1451 Points (2%)
GFXBench - GFXBench 5.0 4K Aztec Ruins High Tier Offscreen
16 fps (7%)
11 fps (4%)
GFXBench - GFXBench 5.0 Aztec Ruins High Tier Offscreen
34 fps (6%)
23 fps (4%)
GFXBench - GFXBench 5.0 Aztec Ruins Normal Tier Offscreen
35 fps (3%)
57 fps (4%)
GFXBench - GFXBench Car Chase Offscreen
79 fps (9%)
GFXBench 3.1 - GFXBench Manhattan ES 3.1 Offscreen
137 fps (3%)
84 fps (2%)
GFXBench 3.0 - GFXBench 3.0 Manhattan Offscreen
232 fps (14%)
107 fps (6%)
GFXBench (DX / GLBenchmark) 2.7
GFXBench T-Rex HD Offscreen C24Z16 + Qualcomm Adreno 725
GFXBench (DX / GLBenchmark) 2.7 - GFXBench T-Rex HD Offscreen C24Z16
359 fps (3%)
GFXBench T-Rex HD Offscreen C24Z16 + Qualcomm Adreno 720
174 fps (1%)
Antutu v9 - AnTuTu v9 GPU
min: 333810     avg: 347058     median: 347058 (43%)     max: 360306 Points
236226 Points (29%)
Basemark GPU 1.2 - Basemark GPU 1.2 Vulkan Official Medium Offscreen 1080
120.9 fps (1%)
60.7 fps (0%)
Geekbench 6.2 - Geekbench 6.2 GPU OpenCL
4056 Points (1%)
Geekbench 6.2 - Geekbench 6.2 GPU Vulkan
5338 Points (2%)
PassMark PerformanceTest Mobile V1 - PerformanceTest Mobile V1 2D Graphics Tests
29649 Points (30%)
PassMark PerformanceTest Mobile V1 - PerformanceTest Mobile V1 3D Graphics Tests
37697 Points (66%)
Power Consumption - GFXBench Aztec Ruins Normal Tier Offscreen Power Consumption 150cd *
6.3 Watt (2%)
5.2 Watt (2%)

Average Benchmarks Qualcomm Adreno 725 → 100% n=10

Average Benchmarks Qualcomm Adreno 720 → 72% n=10

- Range of benchmark values for this graphics card
- Average benchmark values for this graphics card
* Smaller numbers mean a higher performance
1 This benchmark is not used for the average calculation

Game Benchmarks

The following benchmarks stem from our benchmarks of review laptops. The performance depends on the used graphics memory, clock rate, processor, system settings, drivers, and operating systems. So the results don't have to be representative for all laptops with this GPU. For detailed information on the benchmark results, click on the fps number.

Genshin Impact

Genshin Impact

2020
low
100%
Adreno 725:
56  fps
ultra
100%
Adreno 725:
32  fps
157%
Adreno 720:
50.1  fps
Armajet

Armajet

2020
high
100%
Adreno 725:
54  fps
PUBG Mobile

PUBG Mobile

2018
low
100%
Adreno 725:
60  fps
96%
Adreno 720:
57.7  fps
high
100%
Adreno 725:
60  fps
96%
Adreno 720:
57.5  fps
ultra
100%
Adreno 725:
40  fps
97%
Adreno 720:
38.7  fps

Average Gaming Qualcomm Adreno 725 → 100%

Average Gaming 30-70 fps → 100%

Average Gaming Qualcomm Adreno 720 → 111%

Average Gaming 30-70 fps → 111%

Qualcomm Adreno 725lowmed.highultraQHD4K
Genshin Impact5632
Armajet54
PUBG Mobile606040
< 30 fps
< 60 fps
< 120 fps
≥ 120 fps

1
1


1
1

2


Qualcomm Adreno 720lowmed.highultraQHD4K
Genshin Impact50.1
PUBG Mobile57.757.538.7
< 30 fps
< 60 fps
< 120 fps
≥ 120 fps

1


1


2


For more games that might be playable and a list of all games and graphics cards visit our Gaming List

Add one or more devices and compare

In the following list you can select (and also search for) devices that should be added to the comparison. You can select more than one device.

restrict list:

show all (including archived), 2024, 2023
v1.26
log 18. 21:35:27

#0 checking url part for id 11590 +0s ... 0s

#1 checking url part for id 12490 +0s ... 0s

#2 not redirecting to Ajax server +0s ... 0s

#3 did not recreate cache, as it is less than 5 days old! Created at Thu, 16 May 2024 05:40:59 +0200 +0.001s ... 0.001s

#4 composed specs +0.123s ... 0.124s

#5 did output specs +0s ... 0.124s

#6 start showIntegratedCPUs +0s ... 0.124s

#7 getting avg benchmarks for device 11590 +0.024s ... 0.149s

#8 got single benchmarks 11590 +0.01s ... 0.159s

#9 getting avg benchmarks for device 12490 +0.002s ... 0.16s

#10 got single benchmarks 12490 +0.007s ... 0.168s

#11 got avg benchmarks for devices +0s ... 0.168s

#12 min, max, avg, median took s +0.061s ... 0.229s

#13 before gaming benchmark output +0s ... 0.229s

#14 Got 10 rows for game benchmarks. +0.004s ... 0.233s

#15 composed SQL query for gamebenchmarks +0s ... 0.233s

#16 got data and put it in $dataArray +0.001s ... 0.234s

#17 benchmarks composed for output. +0.007s ... 0.242s

#18 calculated avg scores. +0s ... 0.242s

#19 return log +0.082s ... 0.323s

Please share our article, every link counts!
> Expert Reviews and News on Laptops, Smartphones and Tech Innovations > Benchmarks / Tech > Graphics Card Comparison - Head 2 Head
Redaktion, 2017-09- 8 (Update: 2023-07- 1)