NVIDIA GeForce RTX 3050 6GB Laptop GPU
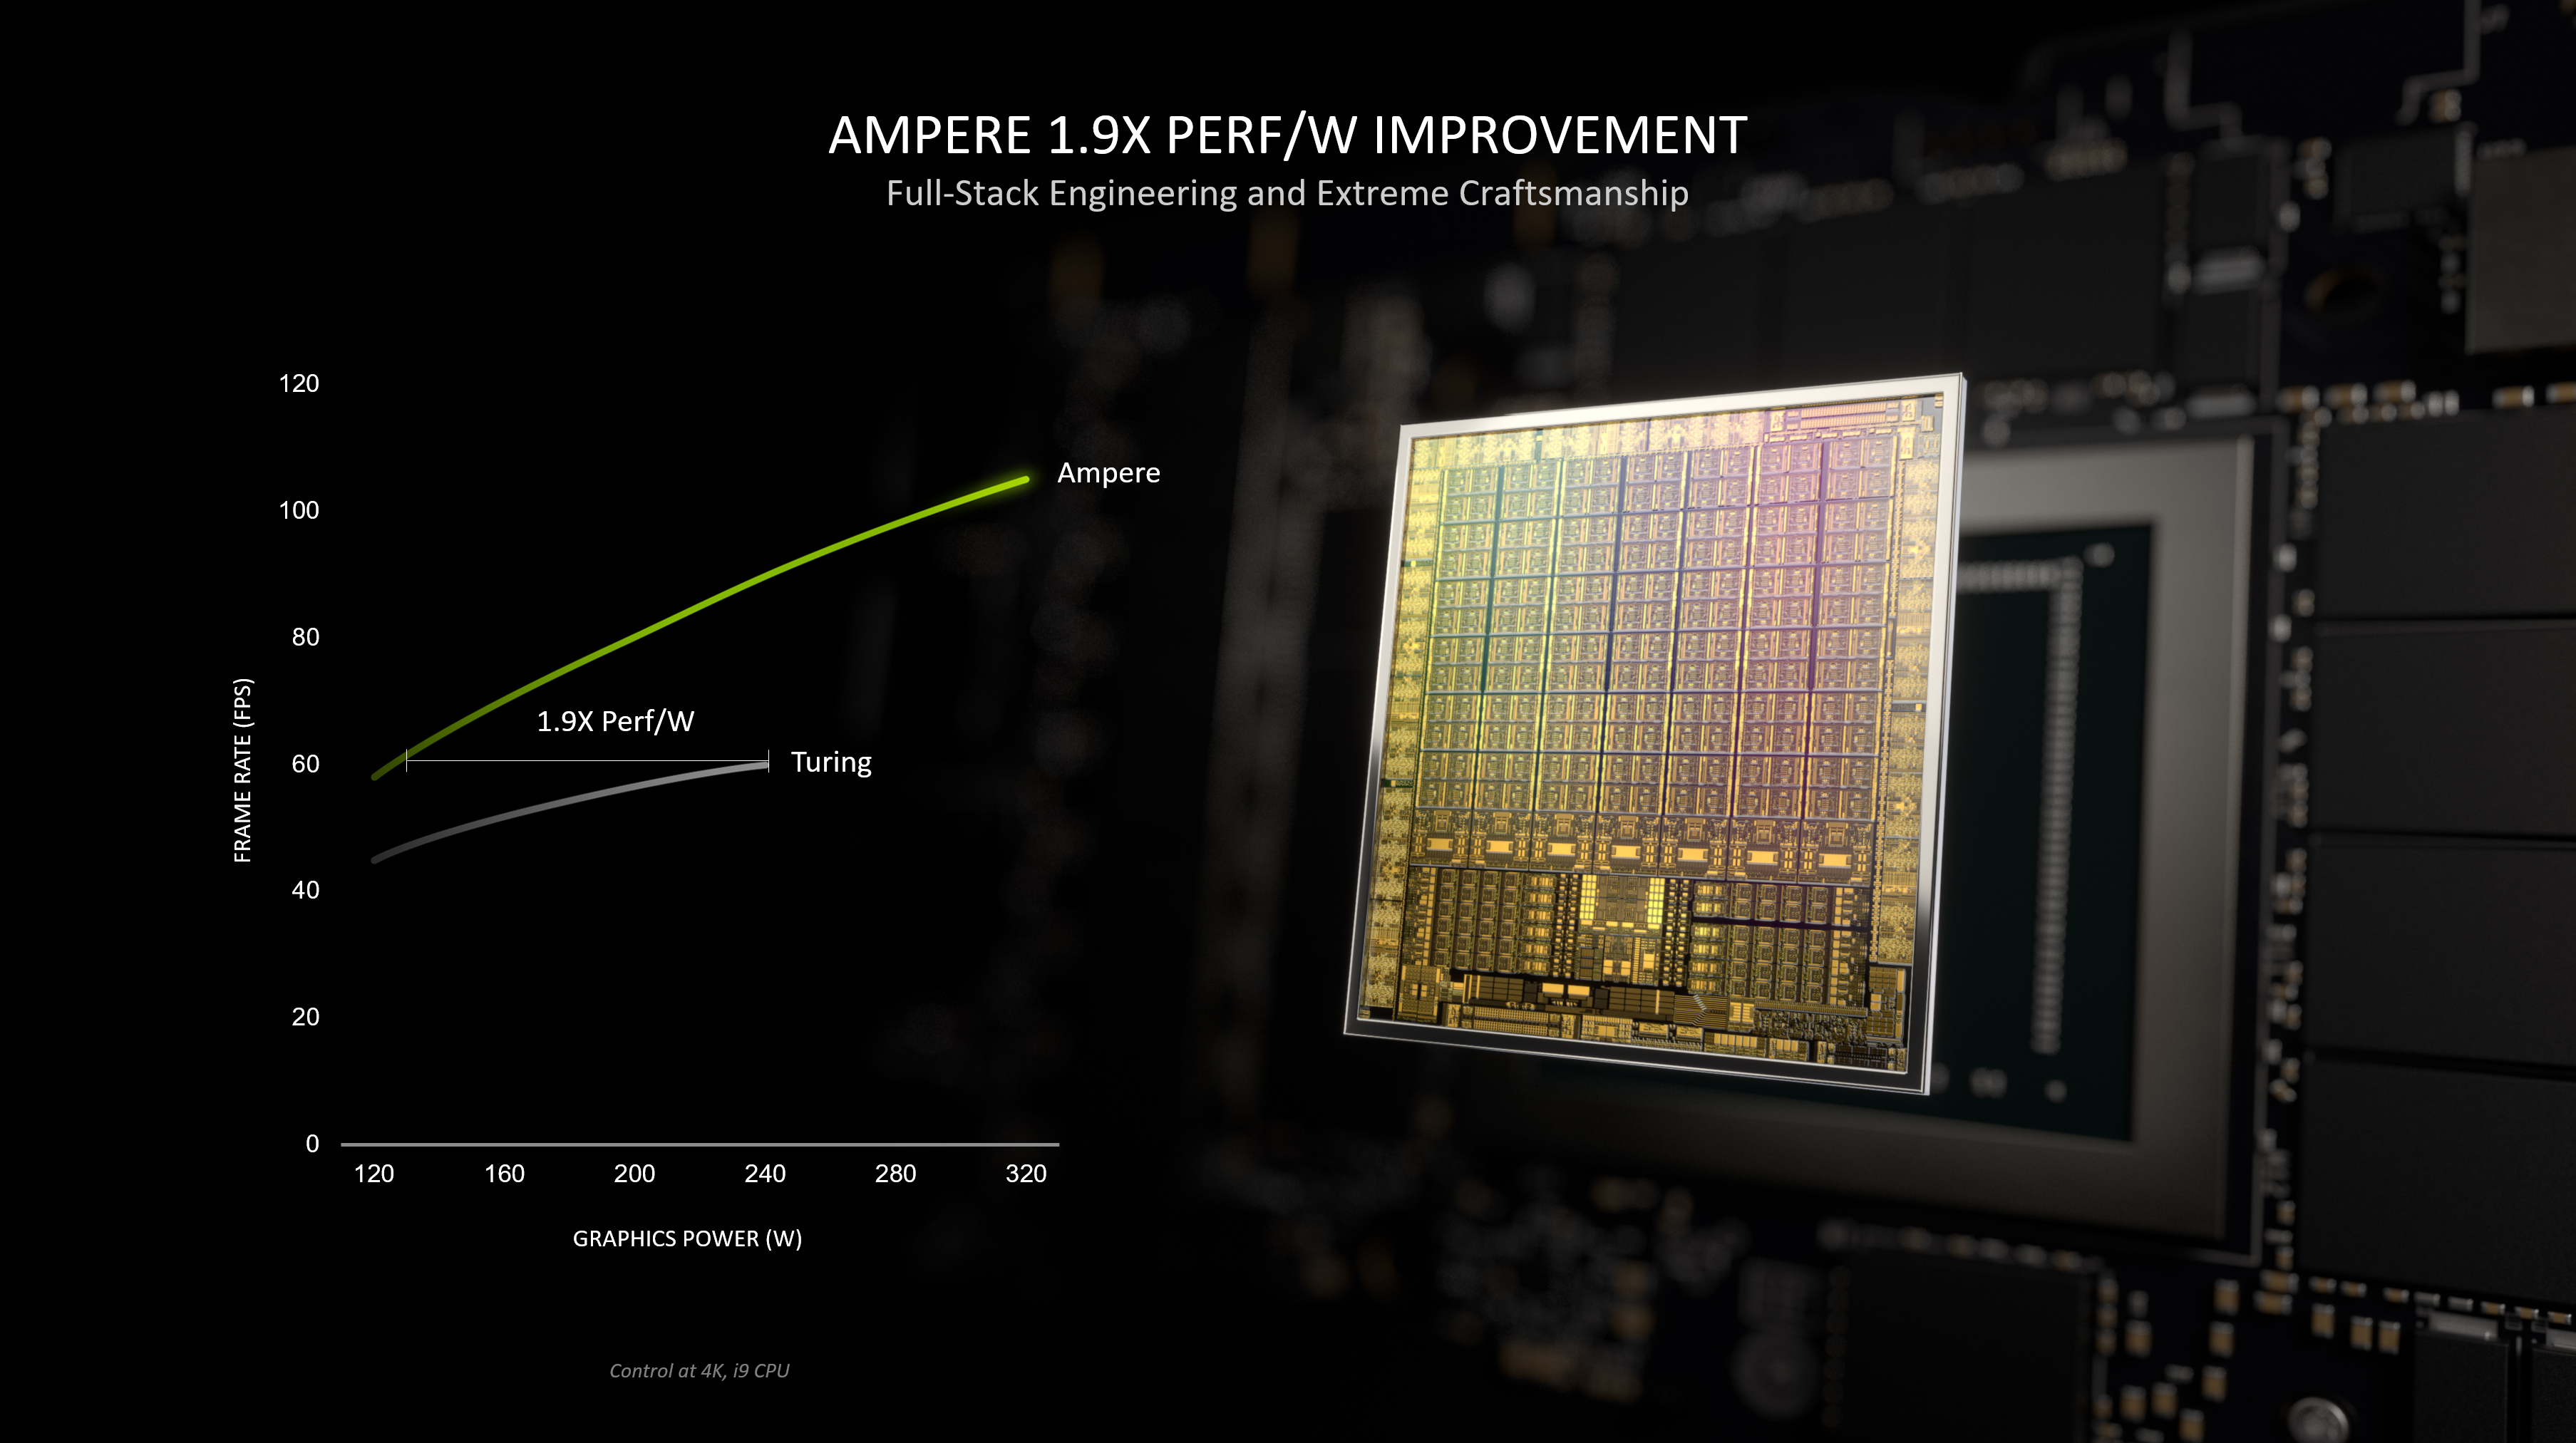
The Nvidia GeForce RTX 3050 6GB Laptop GPU (mobile, GN20-P0-R, 2023 Refresh) is the refresh of the RTX 3050 4GB Laptop GPU (slowest RTX 3000 mobile card) and also based on the GA107 Ampere chip. The 6GB variant offers more CUDA cores (2,560, +25%) but a cut down memory bus to 96 Bit. The clock speed depends on the TGP variant and can range from 713 - 1530 (base) and 1058 - 1740 (boost) for the TGP variants of 35 to 80 Watt (see table below).
The performance is between the old 4GB RTX 3050 and the RTX 3050 Ti and therefore best suited for full HD gaming (1920 x 1080) in medium to high graphic settings. The performance is not sufficient to enable Raytracing in most games, but the Tensor cores can be used for DLSS in some games (and get performance boost with slight quality reduction). Beware, that the low TGP variants will offer a significantly lower performance.
The GA107 chip offers 3,072 FP32 ALUs of which half can also execute INT32 instructions (i.e. 1,536 INT32 ALUs). The RTX 3050 however maybe won't use all ALUs on the chip. With Turing all shaders could still execute FP32 or INT32 instructions. The raytracing and tensor cores on the chip were also improved according to Nvidia. The Ampere chips also include an improved 5th generation video encoder (NVENC for H.264 and H.265) and a 7th generation decoder (for various formats now including AV1).
The GA107 chip is manufactured by Samsung in 8nm (8N), which is not quite able to keep up with the 7nm node at TSMC (e.g. used by AMD and also for the professional GA100 Ampere chip).
GeForce RTX 3000 Series Codename GN20-P0-R 6GB Architecture Ampere Pipelines 2560 - unified TMUs 80 ROPs 32 Raytracing Cores 16 Tensor / AI Cores 64 Core Speed 1237 - 1492 (Boost) MHz Memory Speed 12000 effective = 1500 MHz Memory Bus Width 96 Bit Memory Type GDDR6 Max. Amount of Memory 6 GB Shared Memory no Memory Bandwidth 144 GB/s API DirectX 12_2, Shader 6.7, OpenGL 4.6 Power Consumption 60 Watt (35 - 80 Watt TGP) technology 8 nm PCIe 4.0 Displays HDMI 2.1, DisplayPort 1.4a Features NVIDIA DLSS, NVIDIA Reflex, Resizable BAR, NVIDIA Broadcast, NVIDIA Ansel, NVIDIA ShadowPlay, NVIDIA G-SYNC, Advanced Optimus, Nvidia Max-Q, Dynamic Boost Notebook Size large Date of Announcement 06.01.2023 Predecessor GeForce RTX 3050 4GB Laptop GPU
Benchmarks Performance Rating - 3DMark 11 + Fire Strike + Time Spy
5.5 pt (16%)
...
NVIDIA GeForce RTX 3050 6GB Laptop GPU
...
max:
3DMark - 3DMark Time Spy Score
min: 4933 avg: 5058 median: 5057.5 (15%) max: 5182 Points
GPU TDP 50 W TDP 63 W 95% 100%
...
NVIDIA GeForce RTX 3050 6GB Laptop GPU
...
max:
3DMark - 3DMark Time Spy Graphics
min: 4501 avg: 4661 median: 4660.5 (12%) max: 4820 Points
GPU TDP 50 W TDP 63 W 93% 100%
...
NVIDIA GeForce RTX 3050 6GB Laptop GPU
...
max:
3DMark - 3DMark Ice Storm Unlimited Graphics
500518 Points (57%)
...
NVIDIA GeForce RTX 3050 6GB Laptop GPU
...
max:
3DMark - 3DMark Ice Storm Extreme Graphics
80214 Points (10%)
...
NVIDIA GeForce RTX 3050 6GB Laptop GPU
...
max:
3DMark - 3DMark Cloud Gate Score
43015 Points (46%)
...
NVIDIA GeForce RTX 3050 6GB Laptop GPU
...
max:
3DMark - 3DMark Cloud Gate Graphics
72486 Points (19%)
...
NVIDIA GeForce RTX 3050 6GB Laptop GPU
...
max:
3DMark - 3DMark Fire Strike Standard Score
min: 10765 avg: 10995 median: 10890 (19%) max: 11330 Points
GPU TDP 50 W TDP 60 W TDP 63 W 95% 96% 100%
...
NVIDIA GeForce RTX 3050 6GB Laptop GPU
...
max:
3DMark - 3DMark Fire Strike Standard Graphics
min: 11887 avg: 12155 median: 11960 (14%) max: 12618 Points
GPU TDP 50 W TDP 60 W TDP 63 W 94% 95% 100%
...
NVIDIA GeForce RTX 3050 6GB Laptop GPU
...
max:
3DMark - 3DMark Ice Storm Graphics
80553 Points (10%)
...
NVIDIA GeForce RTX 3050 6GB Laptop GPU
...
max:
3DMark - 3DMark Wild Life Extreme Unlimited
8916 Points (10%)
...
NVIDIA GeForce RTX 3050 6GB Laptop GPU
...
max:
3DMark 11 - 3DM11 Performance Score
min: 15844 avg: 16783 median: 17223 (24%) max: 17282 Points
GPU TDP 50 W TDP 60 W TDP 63 W 92% 100% 100%
...
NVIDIA GeForce RTX 3050 6GB Laptop GPU
...
max:
3DMark 11 - 3DM11 Performance GPU
min: 15860 avg: 17113 median: 17421 (15%) max: 18059 Points
GPU TDP 50 W TDP 60 W TDP 63 W 88% 96% 100%
...
NVIDIA GeForce RTX 3050 6GB Laptop GPU
...
max:
Blender - Blender 3.3 Classroom CUDA *
min: 107 avg: 110.7 median: 110 (16%) max: 115 Seconds
GPU TDP 50 W TDP 60 W TDP 63 W 100% 101% 101%
...
NVIDIA GeForce RTX 3050 6GB Laptop GPU
Blender - Blender 3.3 Classroom OPTIX *
min: 68 avg: 69.3 median: 68 (25%) max: 72 Seconds
GPU TDP 50 W TDP 60 W TDP 63 W 100% 102% 102%
...
NVIDIA GeForce RTX 3050 6GB Laptop GPU
Cinebench R15 + Cinebench R15 - Cinebench R15 OpenGL 64 Bit
min: 117.6 avg: 186.5 median: 221 (13%) max: 221 fps
GPU TDP 50 W TDP 60 W TDP 63 W 100% 100% 53%
...
NVIDIA GeForce RTX 3050 6GB Laptop GPU
...
Cinebench R15 OpenGL Ref. Match 64 Bit + Cinebench R15 - Cinebench R15 OpenGL Ref. Match 64 Bit
99.6 % (100%)
GPU TDP 50 W TDP 60 W TDP 63 W 100% 100% 100%
...
NVIDIA GeForce RTX 3050 6GB Laptop GPU
...
Basemark GPU 1.2 - Basemark GPU 1.2 Vulkan Official Medium Offscreen 1080
min: 104.6 avg: 166.1 median: 104.6 (1%) max: 289 fps
GPU TDP 50 W TDP 60 W TDP 63 W 100% 36% 36%
...
NVIDIA GeForce RTX 3050 6GB Laptop GPU
...
max:
Basemark GPU 1.2 - Basemark GPU 1.2 Vulkan Official High Offscreen 2160
3.6 fps (1%)
NVIDIA GeForce RTX 3050 6GB Laptop GPU
...
Geekbench 6.2 - Geekbench 6.2 GPU OpenCL
min: 52427 avg: 53591 median: 53590.5 (16%) max: 54754 points
GPU TDP 50 W TDP 60 W 96% 100%
...
NVIDIA GeForce RTX 3050 6GB Laptop GPU
...
max:
Geekbench 6.2 - Geekbench 6.2 GPU Vulkan
min: 18152 avg: 19500 median: 19499.5 (6%) max: 20847 points
GPU TDP 50 W TDP 60 W 100% 87%
...
NVIDIA GeForce RTX 3050 6GB Laptop GPU
...
max:
Power Consumption - Furmark Stress Test Power Consumption - external Monitor *
min: 79.4 avg: 87.6 median: 87.3 (12%) max: 96.1 Watt
GPU TDP 50 W TDP 60 W TDP 63 W 101% 100% 103%
...
NVIDIA GeForce RTX 3050 6GB Laptop GPU
...
max:
0 10 20 30 40 50 60 70 80 90 100 Tooltip Lenovo Slim Pro 7 14ARP8: Ø79.4 (78-85)
SCHENKER Vision 14 M23 RTX 3050: Ø87.3 (71.4-95.3)
HP Pavilion Plus 16-ab0456tx: Ø96.1 (93-100.6)
Power Consumption - The Witcher 3 Power Consumption - external Monitor *
min: 83 avg: 87.2 median: 86.1 (12%) max: 92.6 Watt
GPU TDP 50 W TDP 60 W TDP 63 W 102% 100% 101%
...
NVIDIA GeForce RTX 3050 6GB Laptop GPU
...
max:
0 5 10 15 20 25 30 35 40 45 50 55 60 65 70 75 80 85 90 95 Tooltip SCHENKER Vision 14 M23 RTX 3050: Ø83 (80.8-91.2)
Lenovo Slim Pro 7 14ARP8: Ø86.1 (84.7-93.3)
HP Pavilion Plus 16-ab0456tx: Ø92.6 (88.9-98.7)
Power Consumption - Witcher 3 Power Consumption *
min: 86.8 avg: 90.8 median: 89.5 (20%) max: 96.2 Watt
GPU TDP 50 W TDP 60 W TDP 63 W 103% 100% 102%
...
NVIDIA GeForce RTX 3050 6GB Laptop GPU
...
0 5 10 15 20 25 30 35 40 45 50 55 60 65 70 75 80 85 90 95 Tooltip SCHENKER Vision 14 M23 RTX 3050: Ø86.8 (84.5-92)
Lenovo Slim Pro 7 14ARP8: Ø89.5 (87.7-94.7)
HP Pavilion Plus 16-ab0456tx: Ø96.2 (89.2-100)
Power Consumption - Witcher 3 ultra Power Efficiency
min: 0.503 avg: 0.5 median: 0.5 (52%) max: 0.591 fps per Watt
GPU TDP 50 W TDP 60 W TDP 63 W 85% 88% 100%
...
NVIDIA GeForce RTX 3050 6GB Laptop GPU
...
Power Consumption - Witcher 3 ultra Power Efficiency - external Monitor
min: 0.527 avg: 0.6 median: 0.5 (45%) max: 0.614 fps per Watt
GPU TDP 50 W TDP 60 W TDP 63 W 86% 88% 100%
...
NVIDIA GeForce RTX 3050 6GB Laptop GPU
...
Emissions Witcher 3 Fan Noise + Emissions - Witcher 3 Fan Noise
min: 42.1 avg: 44.9 median: 43.8 (70%) max: 48.7 dB(A)
GPU TDP 50 W TDP 60 W TDP 63 W 100% 86% 90%
...
NVIDIA GeForce RTX 3050 6GB Laptop GPU
...
- Range of benchmark values for this graphics card
- Average benchmark values for this graphics card
* Smaller numbers mean a higher performance
Game Benchmarks The following benchmarks stem from our benchmarks of review laptops. The performance depends on the used graphics memory, clock rate, processor, system settings, drivers, and operating systems. So the results don't have to be representative for all laptops with this GPU. For detailed information on the benchmark results, click on the fps number.
0 Tooltip Pavilion Plus 16-ab0456tx: Ø39.5 (31-49)
...
NVIDIA GeForce RTX 3050 6GB Laptop GPU
max:
0 Tooltip Pavilion Plus 16-ab0456tx: Ø36.3 (27-46)
NVIDIA GeForce RTX 3050 6GB Laptop GPU
...
max:
0 Tooltip Pavilion Plus 16-ab0456tx: Ø31.5 (23-42)
NVIDIA GeForce RTX 3050 6GB Laptop GPU
...
max:
0 Tooltip Pavilion Plus 16-ab0456tx: Ø23.4 (17-31)
NVIDIA GeForce RTX 3050 6GB Laptop GPU
...
max:
0 Tooltip Pavilion Plus 16-ab0456tx: Ø15.1 (13-19)
NVIDIA GeForce RTX 3050 6GB Laptop GPU
...
max:
» With all tested laptops playable in detail settings med..
Additional Benchmarks
Low Preset TAA 1280x720
...
NVIDIA GeForce RTX 3050 6GB Laptop GPU
...
max:
...
NVIDIA GeForce RTX 3050 6GB Laptop GPU
...
max:
...
NVIDIA GeForce RTX 3050 6GB Laptop GPU
...
max:
NVIDIA GeForce RTX 3050 6GB Laptop GPU
...
max:
NVIDIA GeForce RTX 3050 6GB Laptop GPU
...
max:
» With all tested laptops playable in detail settings ultra.
Additional Benchmarks
Low Preset (Adaptive Quality Off) 1280x720
...
NVIDIA GeForce RTX 3050 6GB Laptop GPU
...
max:
...
NVIDIA GeForce RTX 3050 6GB Laptop GPU
...
max:
...
NVIDIA GeForce RTX 3050 6GB Laptop GPU
...
max:
...
NVIDIA GeForce RTX 3050 6GB Laptop GPU
...
max:
NVIDIA GeForce RTX 3050 6GB Laptop GPU
...
max:
» With all tested laptops playable in detail settings high.
Additional Benchmarks
Low Preset (FSR off) 1280x720
Ray Tracing Ultra Preset (DLSS off) 1920x1080
...
NVIDIA GeForce RTX 3050 6GB Laptop GPU
...
max:
...
NVIDIA GeForce RTX 3050 6GB Laptop GPU
...
max:
...
NVIDIA GeForce RTX 3050 6GB Laptop GPU
...
max:
...
NVIDIA GeForce RTX 3050 6GB Laptop GPU
...
max:
NVIDIA GeForce RTX 3050 6GB Laptop GPU
...
max:
» With all tested laptops playable in detail settings high.
Additional Benchmarks
Ultra Low Preset TAA 1280x720
...
NVIDIA GeForce RTX 3050 6GB Laptop GPU
...
max:
...
NVIDIA GeForce RTX 3050 6GB Laptop GPU
...
max:
...
NVIDIA GeForce RTX 3050 6GB Laptop GPU
...
max:
...
NVIDIA GeForce RTX 3050 6GB Laptop GPU
...
max:
» With all tested laptops playable in detail settings med..
...
NVIDIA GeForce RTX 3050 6GB Laptop GPU
...
max:
...
NVIDIA GeForce RTX 3050 6GB Laptop GPU
...
max:
...
NVIDIA GeForce RTX 3050 6GB Laptop GPU
...
max:
...
NVIDIA GeForce RTX 3050 6GB Laptop GPU
...
max:
NVIDIA GeForce RTX 3050 6GB Laptop GPU
...
max:
» With all tested laptops playable in detail settings high.
Additional Benchmarks
Ultra Low Preset 16xAF TAA 1280x720
...
NVIDIA GeForce RTX 3050 6GB Laptop GPU
...
max:
...
NVIDIA GeForce RTX 3050 6GB Laptop GPU
...
max:
...
NVIDIA GeForce RTX 3050 6GB Laptop GPU
...
max:
...
NVIDIA GeForce RTX 3050 6GB Laptop GPU
...
max:
» With all tested laptops playable in detail settings ultra.
...
NVIDIA GeForce RTX 3050 6GB Laptop GPU
...
max:
...
NVIDIA GeForce RTX 3050 6GB Laptop GPU
...
max:
...
NVIDIA GeForce RTX 3050 6GB Laptop GPU
...
max:
...
NVIDIA GeForce RTX 3050 6GB Laptop GPU
...
max:
» With all tested laptops playable in detail settings ultra.
...
NVIDIA GeForce RTX 3050 6GB Laptop GPU
...
max:
...
NVIDIA GeForce RTX 3050 6GB Laptop GPU
...
max:
...
NVIDIA GeForce RTX 3050 6GB Laptop GPU
...
max:
...
NVIDIA GeForce RTX 3050 6GB Laptop GPU
...
max:
NVIDIA GeForce RTX 3050 6GB Laptop GPU
...
max:
» With all tested laptops playable in detail settings ultra.
...
NVIDIA GeForce RTX 3050 6GB Laptop GPU
...
max:
...
NVIDIA GeForce RTX 3050 6GB Laptop GPU
...
max:
...
NVIDIA GeForce RTX 3050 6GB Laptop GPU
...
max:
...
NVIDIA GeForce RTX 3050 6GB Laptop GPU
...
max:
...
NVIDIA GeForce RTX 3050 6GB Laptop GPU
...
max:
» With all tested laptops playable in detail settings ultra.
...
NVIDIA GeForce RTX 3050 6GB Laptop GPU
...
max:
0 Tooltip Pavilion Plus 16-ab0456tx: Ø88.7 (75-99)
...
NVIDIA GeForce RTX 3050 6GB Laptop GPU
...
max:
0 Tooltip Pavilion Plus 16-ab0456tx: Ø81.6 (70-94)
...
NVIDIA GeForce RTX 3050 6GB Laptop GPU
...
max:
0 Tooltip Pavilion Plus 16-ab0456tx: Ø75.8 (63-89)
...
NVIDIA GeForce RTX 3050 6GB Laptop GPU
...
max:
0 Tooltip Pavilion Plus 16-ab0456tx: Ø51.8 (43-61)
...
NVIDIA GeForce RTX 3050 6GB Laptop GPU
...
max:
» With all tested laptops playable in detail settings ultra.
Additional Benchmarks
Low Preset TAA 1920x1080
...
NVIDIA GeForce RTX 3050 6GB Laptop GPU
...
max:
...
NVIDIA GeForce RTX 3050 6GB Laptop GPU
...
max:
...
NVIDIA GeForce RTX 3050 6GB Laptop GPU
...
max:
» With all tested laptops playable in detail settings high.
...
NVIDIA GeForce RTX 3050 6GB Laptop GPU
...
max:
...
NVIDIA GeForce RTX 3050 6GB Laptop GPU
...
max:
...
NVIDIA GeForce RTX 3050 6GB Laptop GPU
...
max:
...
NVIDIA GeForce RTX 3050 6GB Laptop GPU
...
max:
» With all tested laptops playable in detail settings high.
...
NVIDIA GeForce RTX 3050 6GB Laptop GPU
...
max:
...
NVIDIA GeForce RTX 3050 6GB Laptop GPU
...
max:
...
NVIDIA GeForce RTX 3050 6GB Laptop GPU
...
max:
...
NVIDIA GeForce RTX 3050 6GB Laptop GPU
...
max:
» With all tested laptops playable in detail settings ultra.
0 100 200 Tooltip Pavilion Plus 16-ab0456tx: Ø244 (223-265)
...
NVIDIA GeForce RTX 3050 6GB Laptop GPU
...
max:
0 100 Tooltip Pavilion Plus 16-ab0456tx: Ø159.1 (142-173)
...
NVIDIA GeForce RTX 3050 6GB Laptop GPU
...
max:
0 Tooltip Pavilion Plus 16-ab0456tx: Ø91.4 (81-100)
...
NVIDIA GeForce RTX 3050 6GB Laptop GPU
...
max:
0 Tooltip Vision 14 M23 RTX 3050: Ø43.7 (41-47)
Pavilion Plus 16-ab0456tx: Ø50.1 (49-52)
Slim Pro 7 14ARP8: Ø50.6 (49-54)
...
NVIDIA GeForce RTX 3050 6GB Laptop GPU
...
max:
0 Tooltip Pavilion Plus 16-ab0456tx: Ø37 (32-40)
NVIDIA GeForce RTX 3050 6GB Laptop GPU
...
max:
» With all tested laptops playable in detail settings ultra.
Additional Benchmarks
Medium Graphics & Postprocessing 1920x1080
...
NVIDIA GeForce RTX 3050 6GB Laptop GPU
...
max:
...
NVIDIA GeForce RTX 3050 6GB Laptop GPU
...
max:
...
NVIDIA GeForce RTX 3050 6GB Laptop GPU
...
max:
...
NVIDIA GeForce RTX 3050 6GB Laptop GPU
...
max:
...
NVIDIA GeForce RTX 3050 6GB Laptop GPU
...
max:
» With all tested laptops playable in detail settings ultra.
Additional Benchmarks
Normal/Off 4xAF 1920x1080
Lowest Settings possible 1920x1080
low med. high ultra QHD 4K Avatar Frontiers of Pandora 39.5 36.3 31.5 23.4 15.1 Assassin's Creed Mirage 70 63 55 41 31 Cyberpunk 2077 2.0 Phantom Liberty 61 48 40 34 21.3 F1 23 132 125 92 23 12 Returnal 40 38 34 29 F1 22 142 134 102 33 19 Tiny Tina's Wonderlands 113.3 89.7 59.2 46.4 Cyberpunk 2077 1.6 80.8 64.2 46.4 38.5 F1 2021 218 127.4 104.8 61.9 40 Strange Brigade 233 105 86 76 57.1 Far Cry 5 132 83 76 71 52 X-Plane 11.11 124 103 85 Final Fantasy XV Benchmark 123 67 49 35 Dota 2 Reborn 142 127 114 105 The Witcher 3 222 139 86 49 37 GTA V 173 172 113 60 40 < 30 fps < 60 fps < 120 fps ≥ 120 fps 2 4 10 3 7 6 7 9 3 6 5 4 7
For more games that might be playable and a list of all games and graphics cards visit our Gaming List
v1.26
log 25. 03:54:49
#0 no ids found in url (should be separated by "_") +0s ... 0s
#1 not redirecting to Ajax server +0s ... 0s
#2 did not recreate cache, as it is less than 5 days old! Created at Mon, 22 Apr 2024 05:40:21 +0200 +0.001s ... 0.001s
#3 composed specs +0.063s ... 0.064s
#4 did output specs +0s ... 0.064s
#5 start showIntegratedCPUs +0s ... 0.064s
#6 getting avg benchmarks for device 11576 +0.033s ... 0.097s
#7 got single benchmarks 11576 +0.03s ... 0.128s
#8 got avg benchmarks for devices +0s ... 0.128s
#9 min, max, avg, median took s +0.601s ... 0.728s
#10 before gaming benchmark output +0s ... 0.728s
#11 Got 134 rows for game benchmarks. +0.039s ... 0.767s
#12 composed SQL query for gamebenchmarks +0s ... 0.767s
#13 got data and put it in $dataArray +0.011s ... 0.779s
#14 benchmarks composed for output. +0.882s ... 1.661s
#15 return log +0.053s ... 1.714s
Notebook reviews with NVIDIA GeForce RTX 3050 6GB Laptop GPU graphics card
HP Pavilion Plus 16 Review: Premium multimedia laptop that could have benefitted from an RTX 4050 HP aims to tap into the burgeoning entry-level creator market with the Pavilion Plus 16. The Pavilion Plus 16 is among the few laptops to feature the RTX 3050 6...
Intel Core i7-13700H | NVIDIA GeForce RTX 3050 6GB Laptop GPU | 16.00" | 1.9 kg
Schenker Vision 14 M23 review - The magnesium ultrabook now with a GeForce RTX 3050 6 GB Schenker offers its Vision 14 with the GeForce RTX 3050 Refresh, featuring more graphics memory. All-in-all, its performance has remained almost the same and it...
Intel Core i7-13700H | NVIDIA GeForce RTX 3050 6GB Laptop GPU | 14.00" | 1.3 kg
New CPU name, old CPU performance: Lenovo Slim 7 Pro Ryzen 7 7735HS laptop review The Slim Pro 7 is a versatile multimedia solution with H-series CPUs and GeForce RTX graphics. The latest model is one of the first to ship with the Ryzen 7 773...
AMD Ryzen 7 7735HS | NVIDIA GeForce RTX 3050 6GB Laptop GPU | 14.50" | 1.6 kg
Lenovo IdeaPad Pro 5 14IRH8, i5-13500H : Intel Core i5-13500H, 14.00", 1.5 kgExternal Review » Lenovo IdeaPad Pro 5 14IRH8, i5-13500H
MSI Thin 15 B12UC : Intel Core i7-12650H, 15.60", 1.9 kgExternal Review » MSI Thin 15 B12UC
Lenovo LOQ 15IRH8, i5-13450HX RTX 3050 : Intel Core i5-13450HX, 15.60", 2.4 kgExternal Review » Lenovo LOQ 15IRH8, i5-13450HX RTX 3050
Lenovo IdeaPad Pro 5 14IRH8 : Intel Core i7-13700H, 14.00", 1.5 kgExternal Review » Lenovo IdeaPad Pro 5 14IRH8
Acer Nitro V 15 ANV15-51, RTX 3050 : Intel Core i5-13420H, 15.60", 2.1 kgExternal Review » Acer Nitro V 15 ANV15-51, RTX 3050
HP Pavilion Plus 16-ab0000 : Intel Core i7-13700H, 16.00", 1.9 kgExternal Review » HP Pavilion Plus 16-ab0000
Acer Nitro 16 AN16-51, i7-13700H RTX 3050 : Intel Core i7-13700H, 16.00", 2.7 kgExternal Review » Acer Nitro 16 AN16-51, i7-13700H RTX 3050
MSI Bravo 15 C7UDX : AMD Ryzen 7 7735HS, 15.60", 2.3 kgExternal Review » MSI Bravo 15 C7UDX
Lenovo LOQ 15IRH8, i5-13500H RTX 3050 : Intel Core i5-13500H, 15.60", 2.4 kgExternal Review » Lenovo LOQ 15IRH8, i5-13500H RTX 3050
Lenovo Yoga Pro 7 14ARP G8, R5 7535HS RTX 3050 : AMD Ryzen 5 7535HS, 14.50", 1.6 kgExternal Review » Lenovo Yoga Pro 7 14ARP G8, R5 7535HS RTX 3050
Lenovo Slim Pro 7 14ARP8 : AMD Ryzen 7 7735HS, 14.50", 1.6 kgExternal Review » Lenovo Slim Pro 7 14ARP8
Gigabyte G5 KE : Intel Core i5-12500H, 15.60", 2 kgExternal Review » Gigabyte G5 KE
Lenovo Slim Pro 7 14ARP8 : AMD Ryzen 7 7735HS, 14.50", 1.6 kgGeForce RTX 3050 vs. GTX 1660 Ti: Two GPUs for two different purposes
Please share our article, every link counts!
» Comparison of GPUs
» Benchmark List
» Notebook Gaming List
Class 1
Class 2 Radeon PRO W6600M *
Class 3 UHD Graphics 32EUs
UHD Graphics 750
Class 4
Class 5 * Approximate position of the graphics adapter
Working For Notebookcheck
Are you a techie who knows how to translate? Then join our Team!
Details here
Top 10 Laptops Multimedia , Budget Multimedia , Gaming , Budget Gaming , Lightweight Gaming , Business , Budget Office , Workstation , Subnotebooks , Ultrabooks , Chromebooks
under 300 USD/Euros , under 500 USD/Euros , 1,000 USD/Euros , for University Students , Best Displays
Top 10 Smartphones Smartphones , Phablets , ≤6-inch , Camera Smartphones
Klaus Hinum (Update: 2023-03- 5)
 Deutsch
 English
 Español
 Français
 Italiano
 Nederlands
 Polski
 Português
 Русский
 Türkçe
 Svenska
 Chinese
 Magyar