AMD Radeon RX 6600M
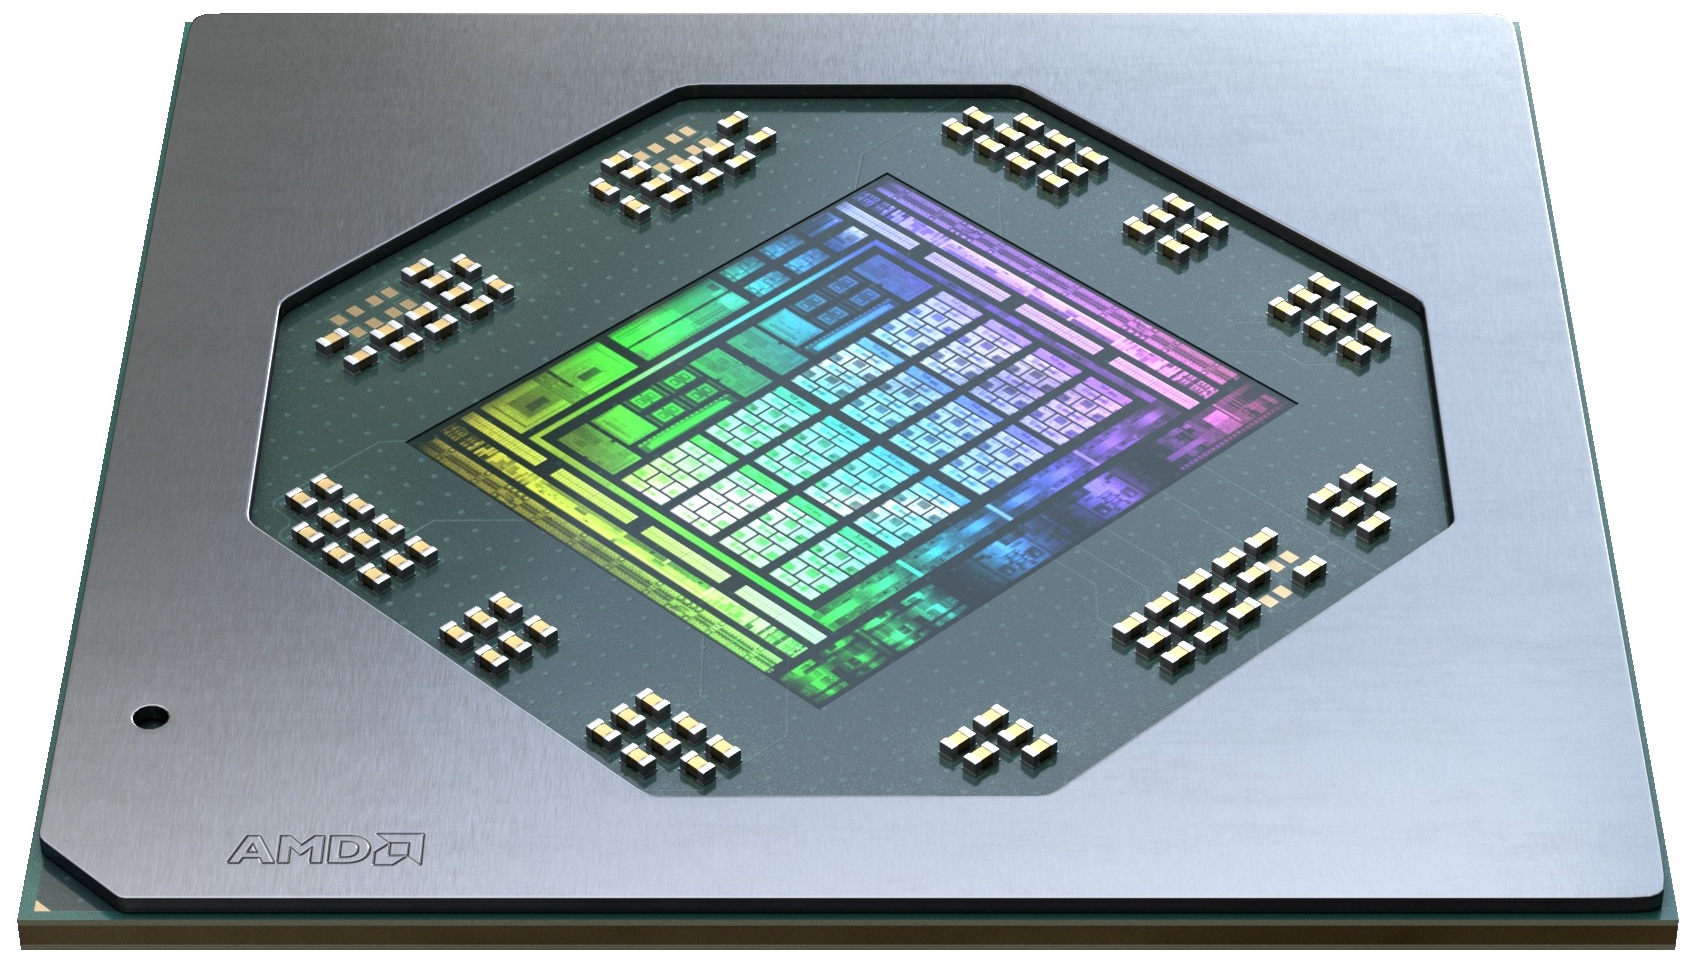
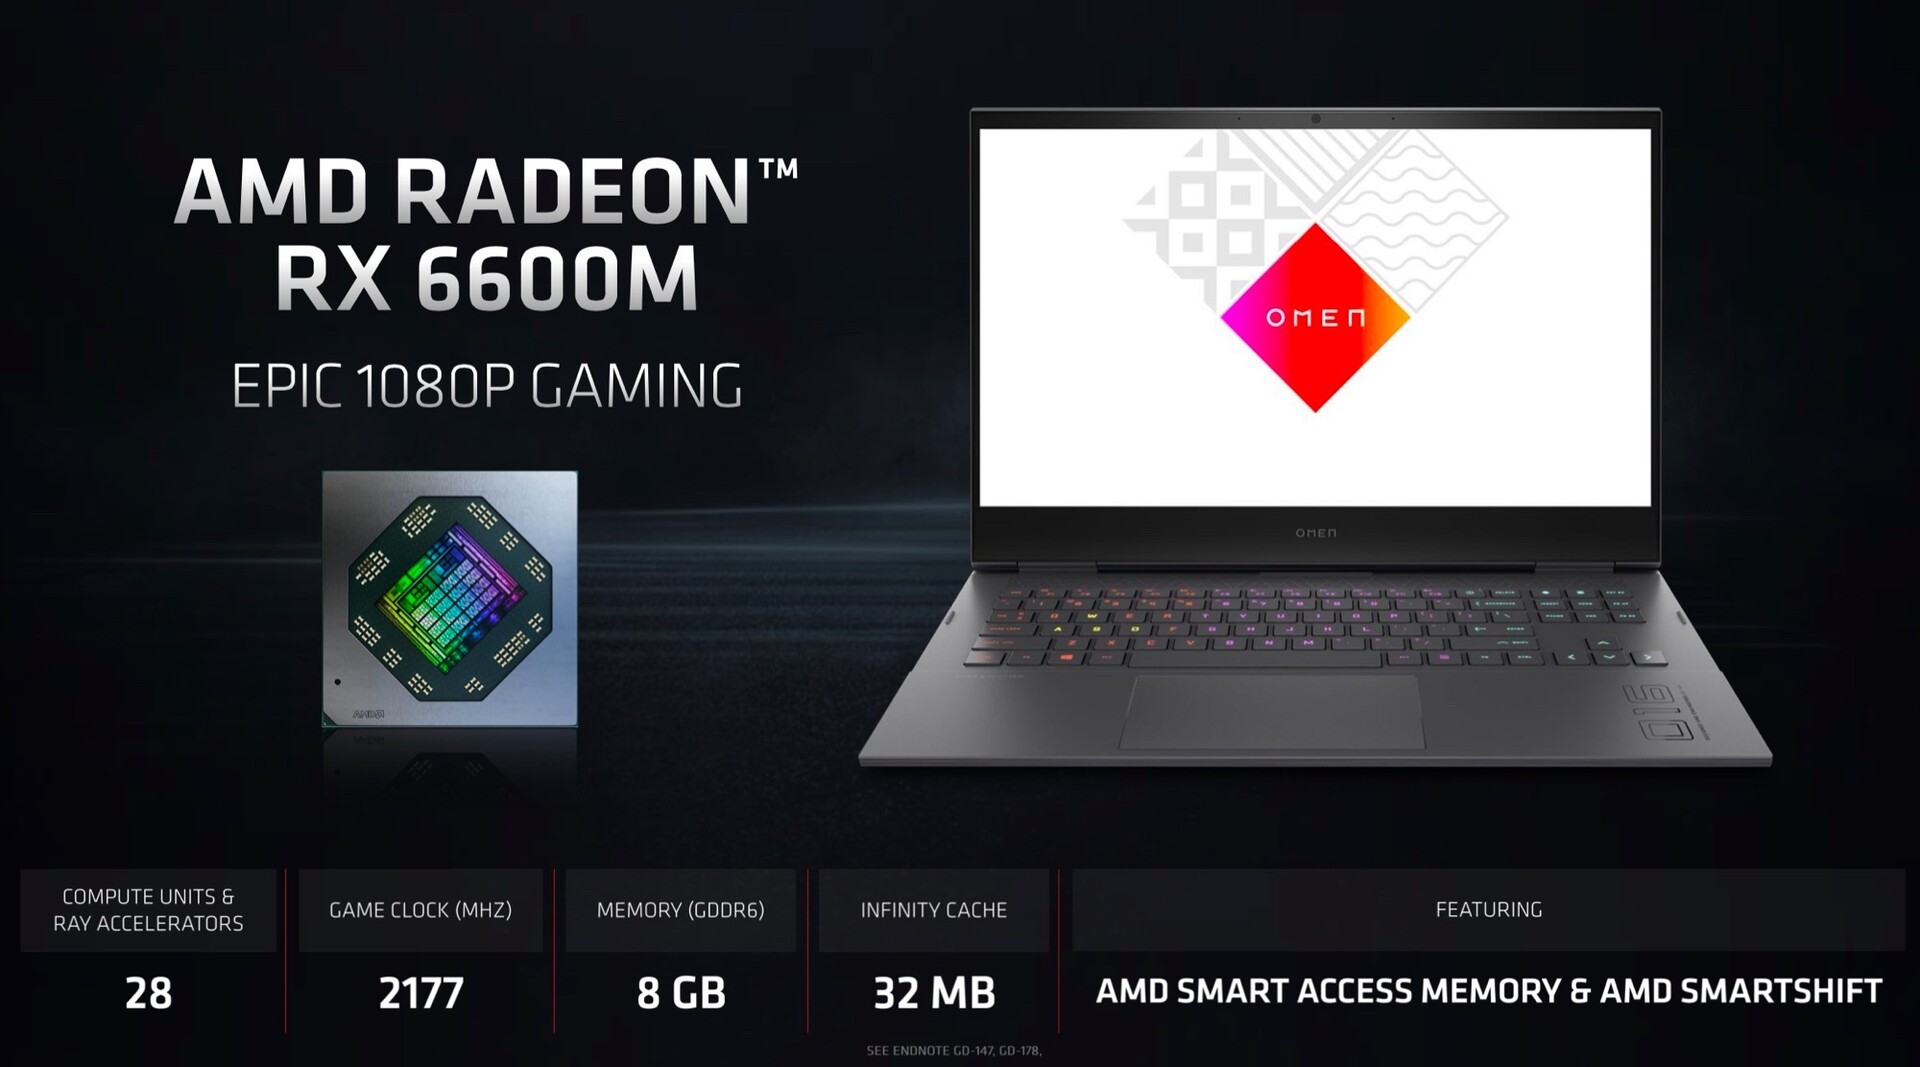
The AMD Radeon RX 6600M is a mobile mid-range graphics card based on the Navi 23 chip (RDNA 2 architecture) manufactured in the modern 7nm process. It features 1,792 cores (28 CUs - compute units) and 8 GB of fast GDDR6 graphics memory connected with a 128 Bit memory bus. The chip also includes 32 MB Infinity Cache. The clock speed of the cores will depend on the laptop according to AMD. The power consumption (TDP settings) ranges from 50 - 100 Watt with different clock speeds (similar to Nvidia).
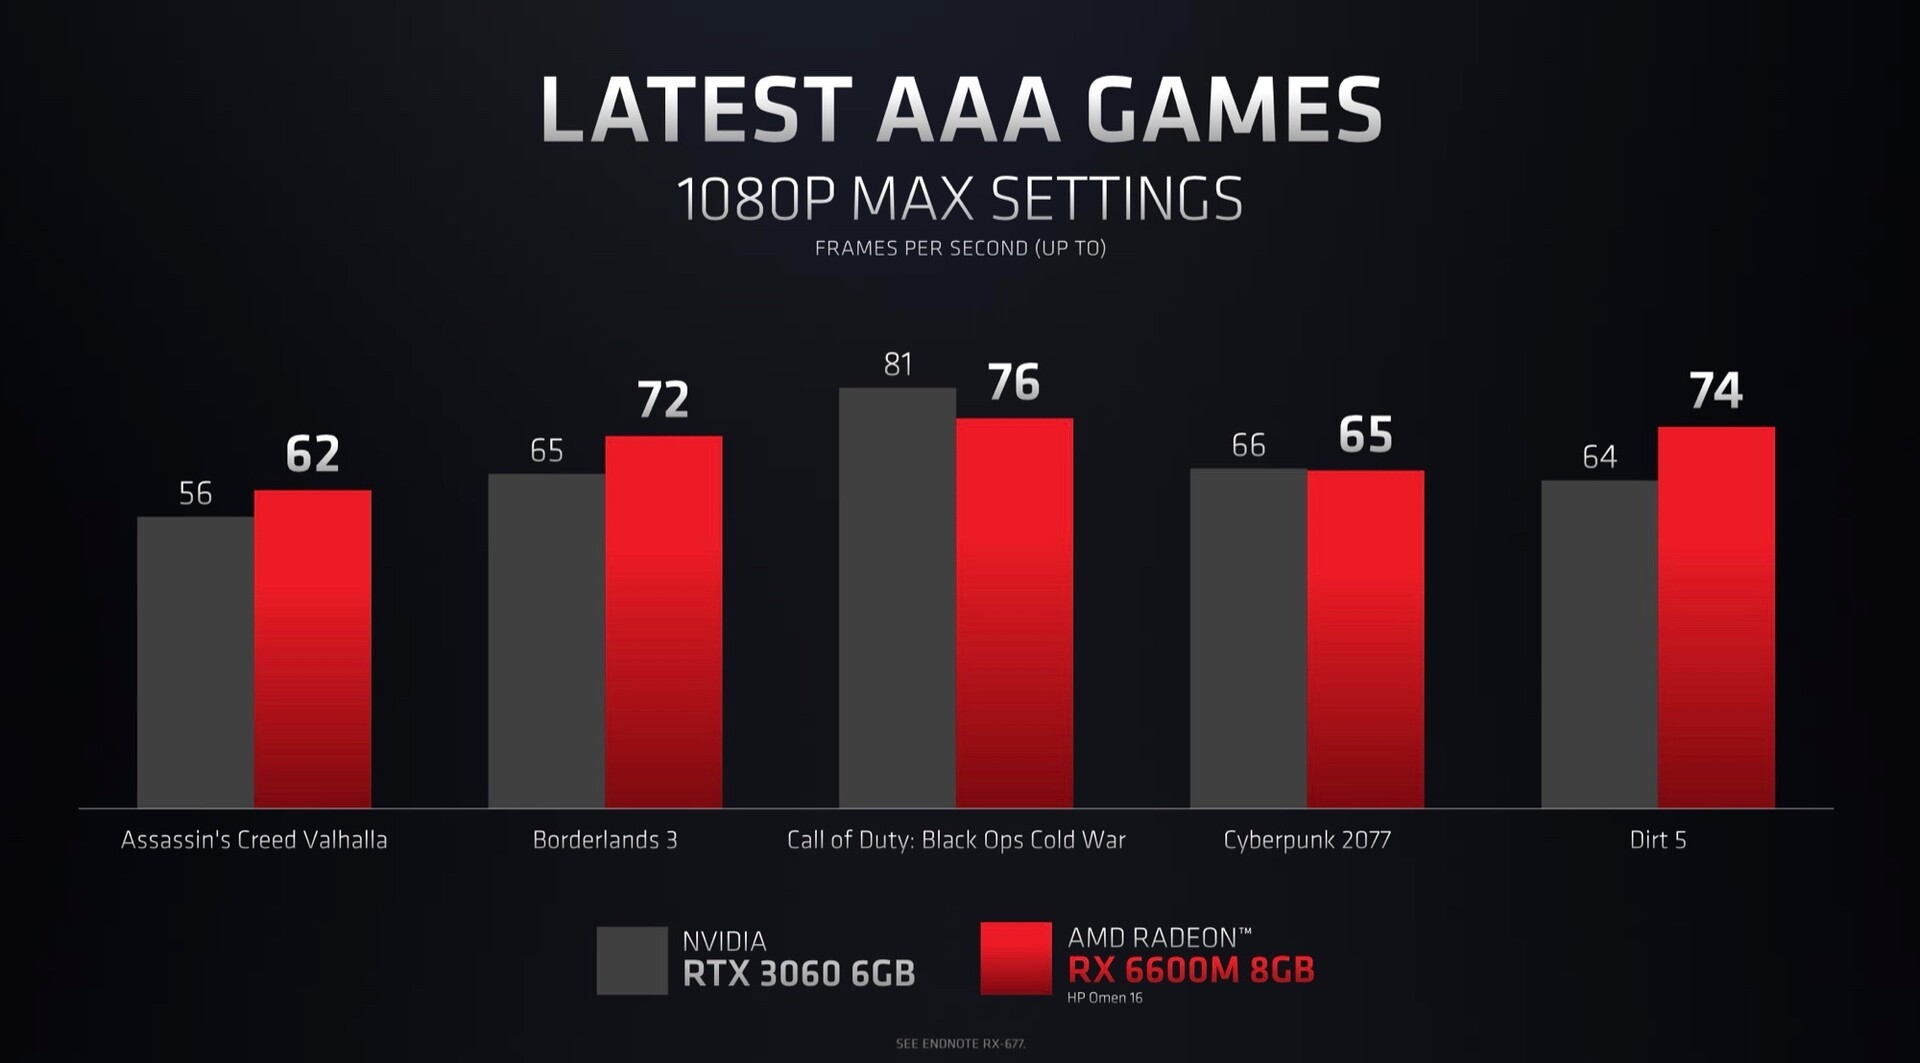
At 100 Watt the game clock reaches 2177 MHz (max boost 2416 MHz) and the performance should be similar to a RTX 3060 for laptops . When Raytracing effects are activated, it falls behind the GeForce GPUs.
The Navi 21 chip is manufactured at TSMC in the modern 7nm process.
Radeon RX 6000M Series Codename R21M-E65-70 Architecture RDNA 2 Pipelines 1792 - unified TMUs 112 ROPs 64 Raytracing Cores 28 Core Speed 2068 - 2177 (Boost) MHz Theoretical Performance 17.32 TFLOPS FP16, 8.66 TFLOPS FP32, 0.54 TFLOPS FP64 Cache L2: 2 MB, L3: 32 MB Memory Speed 14000 effective = 1750 MHz Memory Bus Width 128 Bit Memory Type GDDR6 Max. Amount of Memory 8 GB Shared Memory no Memory Bandwidth 224 GB/s API DirectX 12, Shader 6.4, OpenGL 4.6, OpenCL 2.1, Vulkan 1.3 Power Consumption 100 Watt (50 - 100 Watt TGP) Transistor Count 11.1 Billion Die Size 237 mm² technology 7 nm PCIe 4.0 Displays HDMI 2.0b, DisplayPort 1.4 Features DisplayPort 1.4 w/DFSC, HDMI 2.0b, Radeon Media Engine (H.264 4K150 decode, 4K90 encode / H.265 4K90 decode, 4K60 encode / VP9 4K90 decode), Resizable BAR, Ray Tracing Notebook Size medium sized Date of Announcement 01.09.2020 Link to Manufacturer Page www.amd.com Predecessor Radeon RX 5600M
Benchmarks Performance Rating - 3DMark 11 + Fire Strike + Time Spy
10.7 pt (32%)
...
...
max:
3DMark - 3DMark Time Spy Score
min: 7476 avg: 8054 median: 8094 (23%) max: 8353 Points
GPU TDP ? TDP 100 W TDP 115 W 96% 96% 100%
...
...
max:
3DMark - 3DMark Time Spy Graphics
min: 7200 avg: 7864 median: 7840 (21%) max: 8234 Points
GPU TDP ? TDP 100 W TDP 115 W 100% 94% 100%
...
...
max:
3DMark - 3DMark Ice Storm Unlimited Graphics
min: 450349 avg: 485125 median: 479404 (54%) max: 526430 Points
GPU TDP ? TDP 100 W 97% 100%
...
...
max:
3DMark - 3DMark Ice Storm Extreme Graphics
min: 137746 avg: 272780 median: 192901 (25%) max: 434327 Points
GPU TDP ? TDP 100 W 66% 100%
...
...
max:
3DMark - 3DMark Cloud Gate Score
min: 44854 avg: 54175 median: 54130.5 (58%) max: 60629 Points
GPU TDP ? TDP 100 W TDP 115 W 78% 100% 90%
...
...
max:
3DMark - 3DMark Cloud Gate Graphics
min: 117448 avg: 139228 median: 144612 (38%) max: 155788 Points
GPU TDP ? TDP 100 W TDP 115 W 100% 89% 82%
...
...
max:
3DMark - 3DMark Fire Strike Standard Score
min: 19451 avg: 20707 median: 20855 (37%) max: 21360 Points
GPU TDP ? TDP 100 W TDP 115 W 98% 96% 100%
...
...
max:
3DMark - 3DMark Fire Strike Standard Graphics
min: 21876 avg: 23563 median: 23525 (27%) max: 24788 Points
GPU TDP ? TDP 100 W TDP 115 W 100% 93% 99%
...
...
max:
3DMark - 3DMark Ice Storm Graphics
min: 89427 avg: 283359 median: 194303 (23%) max: 485058 Points
GPU TDP ? TDP 100 W 64% 100%
...
...
max:
3DMark - 3DMark Wild Life Unlimited
47360 Points (24%)
...
max:
3DMark - 3DMark Wild Life Extreme Unlimited
12910 Points (15%)
...
...
max:
3DMark - 3DMark Night Raid
min: 48867 avg: 52623 median: 52623 (50%) max: 56379 Points
...
max:
3DMark - 3DMark Night Raid Graphics Score
min: 93309 avg: 97341 median: 97341 (37%) max: 101373 Points
...
max:
3DMark 11 - 3DM11 Performance Score
min: 22934 avg: 25214 median: 25585 (35%) max: 27359 Points
GPU TDP ? TDP 100 W TDP 115 W 90% 100% 97%
...
...
max:
3DMark 11 - 3DM11 Performance GPU
min: 27030 avg: 31142 median: 31868 (27%) max: 32340 Points
GPU TDP ? TDP 100 W TDP 115 W 100% 97% 100%
...
...
max:
3DMark Vantage + 3DMark Vantage - 3DM Vant. Perf. total
min: 38371 avg: 65460 median: 72685.5 (21%) max: 78096 Points
GPU TDP ? TDP 100 W 100% 94%
...
...
max:
3DM Vant. Perf. GPU no PhysX + 3DMark Vantage - 3DM Vant. Perf. GPU no PhysX
min: 33027 avg: 66376 median: 76111 (43%) max: 80254 Points
GPU TDP ? TDP 100 W 100% 85%
...
...
max:
3DMark 05 - 3DMark 05 - Standard
min: 44004 avg: 50971 median: 51445 (56%) max: 57463 Points
GPU TDP ? TDP 100 W 81% 100%
...
max:
3DMark 06 3DMark 06 - Standard 1280x1024 +
min: 40789 avg: 45985 median: 45858.5 (60%) max: 51434 Points
GPU TDP ? TDP 100 W 93% 100%
...
...
max:
Unigine Valley 1.0 - Unigine Valley 1.0 DX
min: 83.6 avg: 91.1 median: 93.1 (31%) max: 94.5 fps
GPU TDP ? TDP 100 W 89% 100%
...
...
max:
Blender - Blender 3.3 Classroom HIP *
min: 4 avg: 52 median: 65 (5%) max: 87 Seconds
...
...
SPECviewperf 12 + SPECviewperf 12 - specvp12 sw-03
min: 105 avg: 159 median: 180 (45%) max: 214 fps
GPU TDP ? TDP 100 W 54% 100%
...
max:
specvp12 snx-02 + SPECviewperf 12 - specvp12 snx-02
min: 36.2 avg: 123.3 median: 164 (24%) max: 191 fps
GPU TDP ? TDP 100 W 20% 100%
...
...
max:
specvp12 showcase-01 + SPECviewperf 12 - specvp12 showcase-01
min: 98.4 avg: 113.6 median: 120 (26%) max: 129 fps
GPU TDP ? TDP 100 W 80% 100%
...
...
max:
specvp12 mediacal-01 + SPECviewperf 12 - specvp12 mediacal-01
min: 44.1 avg: 75.8 median: 96.1 (25%) max: 97.6 fps
GPU TDP ? TDP 100 W 46% 100%
...
max:
specvp12 maya-04 + SPECviewperf 12 - specvp12 maya-04
min: 90.1 avg: 145.4 median: 159 (43%) max: 198 fps
GPU TDP ? TDP 100 W 49% 100%
...
...
max:
specvp12 energy-01 + SPECviewperf 12 - specvp12 energy-01
min: 2.13 avg: 19.3 median: 29.5 (26%) max: 31.4 fps
GPU TDP ? TDP 100 W 7% 100%
...
...
max:
specvp12 creo-01 + SPECviewperf 12 - specvp12 creo-01
min: 86 avg: 98 median: 102 (41%) max: 109 fps
GPU TDP ? TDP 100 W 81% 100%
...
...
max:
specvp12 catia-04 + SPECviewperf 12 - specvp12 catia-04
min: 141 avg: 195.4 median: 207 (34%) max: 248 fps
GPU TDP ? TDP 100 W 61% 100%
...
max:
specvp12 3dsmax-05 + SPECviewperf 12 - specvp12 3dsmax-05
min: 154 avg: 189.6 median: 172 (30%) max: 246 fps
GPU TDP ? TDP 100 W 85% 100%
...
max:
SPECviewperf 13 specvp13 sw-04 + SPECviewperf 13 - specvp13 sw-04
min: 127 avg: 170.8 median: 177.5 (48%) max: 201 fps
GPU TDP ? TDP 100 W 69% 100%
...
max:
specvp13 snx-03 + SPECviewperf 13 - specvp13 snx-03
min: 64.2 avg: 262.6 median: 321 (36%) max: 344 fps
GPU TDP ? TDP 100 W 20% 100%
...
...
max:
specvp13 showcase-02 + SPECviewperf 13 - specvp13 showcase-02
min: 98.5 avg: 117.6 median: 121.5 (26%) max: 129 fps
GPU TDP ? TDP 100 W 79% 100%
...
...
max:
specvp13 medical-02 + SPECviewperf 13 - specvp13 medical-02
min: 63 avg: 85.4 median: 74.2 (15%) max: 130 fps
GPU TDP ? TDP 100 W 68% 100%
...
...
max:
specvp13 maya-05 + SPECviewperf 13 - specvp13 maya-05
min: 187 avg: 283.3 median: 303 (34%) max: 340 fps
GPU TDP ? TDP 100 W 59% 100%
...
...
max:
specvp13 energy-02 + SPECviewperf 13 - specvp13 energy-02
min: 2.05 avg: 32.2 median: 41.7 (13%) max: 43.5 fps
GPU TDP ? TDP 100 W 5% 100%
...
...
specvp13 creo-02 + SPECviewperf 13 - specvp13 creo-02
min: 166 avg: 228.3 median: 237 (35%) max: 273 fps
GPU TDP ? TDP 100 W 67% 100%
...
...
max:
specvp13 catia-05 + SPECviewperf 13 - specvp13 catia-05
min: 211 avg: 317.8 median: 339.5 (38%) max: 381 fps
GPU TDP ? TDP 100 W 60% 100%
...
max:
specvp13 3dsmax-06 + SPECviewperf 13 - specvp13 3dsmax-06
min: 156 avg: 194.5 median: 188 (33%) max: 246 fps
GPU TDP ? TDP 100 W 86% 100%
...
...
max:
SPECviewperf 2020 specvp2020 solidworks-05 4k + SPECviewperf 2020 - specvp2020 solidworks-05 4k
min: 71 avg: 101 median: 113 (33%) max: 129 fps
GPU TDP ? TDP 100 W 100% 82%
...
...
max:
specvp2020 snx-04 4k + SPECviewperf 2020 - specvp2020 snx-04 4k
min: 62.5 avg: 143.3 median: 142.5 (15%) max: 226 fps
GPU TDP ? TDP 100 W 34% 100%
...
max:
specvp2020 medical-03 4k + SPECviewperf 2020 - specvp2020 medical-03 4k
min: 18.1 avg: 25 median: 25 (24%) max: 34 fps
GPU TDP ? TDP 100 W 100% 78%
...
max:
specvp2020 maya-06 4k + SPECviewperf 2020 - specvp2020 maya-06 4k
min: 143 avg: 186.5 median: 179 (29%) max: 266 fps
GPU TDP ? TDP 100 W 100% 93%
...
max:
specvp2020 energy-03 4k + SPECviewperf 2020 - specvp2020 energy-03 4k
min: 2.05 avg: 20.4 median: 12.6 (3%) max: 47.9 fps
GPU TDP ? TDP 100 W 7% 100%
...
...
max:
specvp2020 creo-03 4k + SPECviewperf 2020 - specvp2020 creo-03 4k
min: 65 avg: 72.9 median: 70.3 (33%) max: 88.4 fps
GPU TDP ? TDP 100 W 85% 100%
...
...
max:
specvp2020 catia-06 4k + SPECviewperf 2020 - specvp2020 catia-06 4k
min: 16.8 avg: 37.7 median: 39.7 (26%) max: 57.9 fps
GPU TDP ? TDP 100 W 35% 100%
...
...
max:
specvp2020 3dsmax-07 4k + SPECviewperf 2020 - specvp2020 3dsmax-07 4k
min: 37.5 avg: 53.7 median: 54.5 (23%) max: 66.5 fps
GPU TDP ? TDP 100 W 100% 71%
...
...
max:
Cinebench R10 Cinebench R10 Shading (32bit) + Cinebench R10 - Cinebench R10 Shading (32bit)
min: 14081 avg: 15065 median: 14717 (10%) max: 16745 points
GPU TDP ? TDP 100 W 91% 100%
...
...
Cinebench R11.5 Cinebench R11.5 OpenGL 64 Bit + Cinebench R11.5 - Cinebench R11.5 OpenGL 64 Bit
77 fps (27%)
...
...
max:
Cinebench R15 + Cinebench R15 - Cinebench R15 OpenGL 64 Bit
min: 136.78 avg: 186.6 median: 179.6 (10%) max: 232.63 fps
GPU TDP ? TDP 100 W TDP 115 W 86% 100% 71%
...
...
Cinebench R15 OpenGL Ref. Match 64 Bit + Cinebench R15 - Cinebench R15 OpenGL Ref. Match 64 Bit
min: 97.9 avg: 98.1 median: 98 (98%) max: 99.6 %
GPU TDP ? TDP 100 W TDP 115 W 100% 99% 99%
...
...
Basemark GPU 1.2 - Basemark GPU 1.2 Vulkan Official Medium Offscreen 1080
217 fps (1%)
...
...
max:
Basemark GPU 1.2 - Basemark GPU 1.2 Vulkan Official High Offscreen 2160
15.3 fps (3%)
...
Geekbench 6.2 - Geekbench 6.2 GPU OpenCL
62915 points (18%)
...
...
max:
Geekbench 6.2 - Geekbench 6.2 GPU Vulkan
63493 points (21%)
...
max:
LuxMark v2.0 64Bit - LuxMark v2.0 Room GPU
2294 Samples/s (10%)
...
...
max:
LuxMark v2.0 64Bit - LuxMark v2.0 Sala GPU
5564 Samples/s (10%)
...
...
max:
ComputeMark v2.1 - ComputeMark v2.1 Result
min: 15716 avg: 16021 median: 16123 (17%) max: 16223 points
...
...
max:
Power Consumption - Furmark Stress Test Power Consumption - external Monitor *
min: 113 avg: 166 median: 174.2 (25%) max: 187 Watt
GPU TDP ? TDP 100 W TDP 115 W 104% 105% 100%
...
...
max:
0 15 30 45 60 75 90 105 120 135 150 165 180 195 Tooltip MSI Alpha 15 B5EEK-008: Ø112.6 (111-119)
Lenovo Legion 5 15ACH6A-82NW0010GE: Ø165.2 (138-178)
Minisforum Neptune Series HX90G: Ø174.1 (164.6-195.4)
Minisforum Neptune Series HX99G: Ø174.2 (172.7-175.8)
Minisforum Neptune Series HX77G: Ø182.4 (173.1-193.3)
HP Omen 16-c0077ng: Ø186.8 (181-205)
Power Consumption - The Witcher 3 Power Consumption - external Monitor *
min: 124 avg: 164.5 median: 169.4 (24%) max: 191 Watt
GPU TDP ? TDP 100 W TDP 115 W 103% 107% 100%
...
...
max:
0 15 30 45 60 75 90 105 120 135 150 165 180 195 210 Tooltip MSI Alpha 15 B5EEK-008: Ø124.3 (122-139)
Minisforum Neptune Series HX77G: Ø147.9 (144.1-154.1)
Minisforum Neptune Series HX99G: Ø161.7 (149.9-168.5)
Lenovo Legion 5 15ACH6A-82NW0010GE: Ø177.5 (175-189)
Minisforum Neptune Series HX90G: Ø185.6 (177.8-218)
HP Omen 16-c0077ng: Ø191.2 (156-200)
Power Consumption - Witcher 3 Power Consumption *
min: 131 avg: 168.7 median: 181 (40%) max: 194 Watt
GPU TDP ? TDP 100 W TDP 115 W 105% 124% 100%
...
...
0 15 30 45 60 75 90 105 120 135 150 165 180 195 Tooltip MSI Alpha 15 B5EEK-008: Ø131.3 (123-141)
Lenovo Legion 5 15ACH6A-82NW0010GE: Ø181 (176-185)
HP Omen 16-c0077ng: Ø194.1 (160-204)
Power Consumption - Witcher 3 ultra Power Efficiency
min: 0.433 avg: 0.5 median: 0.4 (45%) max: 0.576 fps per Watt
GPU TDP ? TDP 100 W TDP 115 W 78% 100% 75%
...
...
Power Consumption - Witcher 3 ultra Power Efficiency - external Monitor
min: 0.4398 avg: 0.5 median: 0.5 (42%) max: 0.608 fps per Watt
GPU TDP ? TDP 100 W TDP 115 W 83% 100% 79%
...
...
Emissions Witcher 3 Fan Noise + Emissions - Witcher 3 Fan Noise
min: 35.26 avg: 48.1 median: 49.1 (79%) max: 59 dB(A)
...
...
- Range of benchmark values for this graphics card
- Average benchmark values for this graphics card
* Smaller numbers mean a higher performance
Game Benchmarks The following benchmarks stem from our benchmarks of review laptops. The performance depends on the used graphics memory, clock rate, processor, system settings, drivers, and operating systems. So the results don't have to be representative for all laptops with this GPU. For detailed information on the benchmark results, click on the fps number.
0 100 200 300 400 500 600 700 Tooltip Neptune Series HX77G: Ø87.8 (49.023-751)
...
...
max:
0 100 200 Tooltip Neptune Series HX77G: Ø58.8 (40.471-291)
...
...
max:
0 Tooltip Neptune Series HX77G: Ø45.5 (36.36-63.1)
...
...
max:
0 Tooltip Neptune Series HX77G: Ø27.9 (22.758-49.5)
...
max:
0 Tooltip Neptune Series HX77G: Ø17.4 (12.01-82.8)
...
max:
» With all tested laptops playable in detail settings high.
Additional Benchmarks
Low Preset 1280x720
0 100 200 Tooltip Neptune Series HX77G: Ø73.5 (57.13-202.5)
...
max:
0 100 Tooltip Neptune Series HX77G: Ø61.3 (49.775-109.6)
...
...
max:
0 Tooltip Neptune Series HX77G: Ø43.4 (34.309-97.3)
...
...
max:
0 100 Tooltip Neptune Series HX77G: Ø34.9 (23.004-124.6)
...
...
max:
0 Tooltip Neptune Series HX77G: Ø19.3 (15.306-37.3)
...
max:
0 Tooltip Neptune Series HX77G: Ø15.2 (7.079-87.2)
...
max:
» With all tested laptops playable in detail settings high.
Additional Benchmarks
Low Preset 1280x720
...
max:
...
max:
...
...
max:
...
...
max:
...
max:
...
max:
» With all tested laptops playable in detail settings ultra.
Additional Benchmarks
Low Preset 1280x720
...
max:
...
...
max:
...
...
max:
...
...
max:
...
max:
...
max:
» With all tested laptops playable in detail settings ultra.
Additional Benchmarks
Low Preset (Adaptive Quality Off) 1280x720
...
...
max:
...
...
max:
...
...
max:
...
...
max:
...
max:
...
max:
» With all tested laptops playable in detail settings ultra.
Additional Benchmarks
Low Preset (FSR off) 1280x720
Ray Tracing Ultra Preset (DLSS off) 1920x1080
0 100 200 300 Tooltip Neptune Series HX77G: Ø144.6 (123.005-391)
...
max:
0 100 Tooltip Neptune Series HX77G: Ø128 (115.015-151.43)
...
...
max:
0 100 200 300 400 500 600 700 800 900 1000 1100 1200 Tooltip Neptune Series HX77G: Ø156.4 (94.14-1267)
...
...
max:
0 100 200 300 400 500 600 700 800 900 1000 1100 1200 1300 1400 1500 1600 1700 1800 1900 2000 2100 2200 2300 2400 2500 2600 Tooltip Neptune Series HX77G: Ø180.8 (86.073-2636)
...
...
max:
0 Tooltip Neptune Series HX77G: Ø62.2 (54.001-75)
...
max:
0 Tooltip Neptune Series HX77G: Ø31.5 (25.057-63)
...
max:
» With all tested laptops playable in detail settings ultra.
Additional Benchmarks
Low Preset 1280x720
0 Tooltip Neptune Series HX77G: Ø57.2 (51.07-75.567)
Neptune Series HX77G: Ø64.1 (54.219-80.7)
...
max:
0 Tooltip Neptune Series HX77G: Ø51.4 (43.695-99.7)
Neptune Series HX77G: Ø55.4 (46.133-89.2)
...
...
max:
0 Tooltip Neptune Series HX77G: Ø44.3 (34.005-76.9)
Neptune Series HX77G: Ø43.5 (36.762-56.8)
...
...
max:
0 Tooltip Neptune Series HX77G: Ø38.3 (31.141-57.9)
Neptune Series HX77G: Ø39.2 (33.727-62.5)
...
...
max:
0 Tooltip Neptune Series HX77G: Ø32.8 (26.19-84.4)
Neptune Series HX77G: Ø31.3 (26.265-42)
...
max:
0 Tooltip Neptune Series HX77G: Ø19.6 (15.654-38.6)
Neptune Series HX77G: Ø19.8 (16.766-40.7)
...
max:
» With all tested laptops playable in detail settings ultra.
Additional Benchmarks
Low Preset 1280x720
0 100 Tooltip Neptune Series HX77G: Ø80.5 (57.209-167.2)
...
max:
0 100 Tooltip Neptune Series HX77G: Ø75.6 (54.699-139)
...
...
max:
0 100 200 Tooltip Neptune Series HX77G: Ø86.3 (55.547-285)
...
...
max:
0 Tooltip Neptune Series HX77G: Ø70.4 (61.051-88.63)
...
...
max:
0 Tooltip Neptune Series HX77G: Ø54.9 (46.51-72)
...
max:
0 Tooltip Neptune Series HX77G: Ø33.7 (29.05-48.4)
...
max:
» With all tested laptops playable in detail settings ultra.
Additional Benchmarks
Low Preset 1280x720
0 Tooltip Neptune Series HX77G: Ø64.4 (53.693-98.8)
...
max:
0 Tooltip Neptune Series HX77G: Ø54.4 (43.244-83)
...
...
max:
0 100 Tooltip Neptune Series HX77G: Ø44 (32.751-175.5)
...
max:
0 Tooltip Neptune Series HX77G: Ø27.7 (22.007-85.3)
...
max:
0 Tooltip Neptune Series HX77G: Ø14.8 (9.007-28.7)
max:
» With all tested laptops playable in detail settings ultra.
Additional Benchmarks
Low 1280x720
0 100 Tooltip Neptune Series HX77G: Ø108.4 (90.06-143.7)
...
max:
0 100 Tooltip Neptune Series HX77G: Ø105.1 (90.73-119.07)
...
...
max:
0 100 Tooltip Neptune Series HX77G: Ø95.1 (79.727-108.76)
...
...
max:
0 100 Tooltip Neptune Series HX77G: Ø72.6 (65.043-125.2)
...
...
max:
0 100 Tooltip Neptune Series HX77G: Ø53.2 (43.59-113.5)
...
max:
0 Tooltip Neptune Series HX77G: Ø26.6 (20.465-38)
...
max:
» With all tested laptops playable in detail settings ultra.
Additional Benchmarks
Low Preset 1280x720
0 100 200 Tooltip Neptune Series HX77G: Ø119.8 (102.006-221.8)
...
max:
0 100 Tooltip Neptune Series HX77G: Ø94.9 (84.005-120.4)
...
...
max:
0 100 200 300 Tooltip Neptune Series HX77G: Ø88.1 (70.395-332)
...
...
max:
0 Tooltip Neptune Series HX77G: Ø75.6 (66.218-95.6)
...
...
max:
0 Tooltip Neptune Series HX77G: Ø53 (44.874-84.5)
...
max:
0 Tooltip Neptune Series HX77G: Ø27.8 (21.361-51.7)
...
max:
» With all tested laptops playable in detail settings ultra.
Additional Benchmarks
Low Preset 1280x720
0 Tooltip Neptune Series HX77G: Ø65.9 (50.65-91.3)
...
max:
0 100 200 300 400 500 600 700 800 900 1000 1100 1200 1300 1400 1500 1600 1700 1800 1900 2000 Tooltip Neptune Series HX77G: Ø130.2 (51.821-2014)
...
...
max:
0 100 Tooltip Neptune Series HX77G: Ø51.3 (39.43-104.5)
...
max:
0 100 Tooltip Neptune Series HX77G: Ø44.9 (33.092-109.3)
...
...
max:
0 Tooltip Neptune Series HX77G: Ø38.1 (28.296-66.2)
...
max:
0 100 Tooltip Neptune Series HX77G: Ø35.7 (24.047-120.1)
max:
» With all tested laptops playable in detail settings ultra.
Additional Benchmarks
Very Low Preset 1280x720
Very High Preset + Very High Raytracing TAA 1920x1080
...
max:
...
max:
...
max:
...
...
max:
max:
...
max:
» With all tested laptops playable in detail settings high.
Additional Benchmarks
Ultra Low Preset TAA 1280x720
0 100 200 Tooltip Neptune Series HX77G: Ø208 (169.514-231.15)
...
max:
0 100 200 Tooltip Neptune Series HX77G: Ø183.6 (153.36-221.6)
...
...
max:
0 100 200 300 Tooltip Neptune Series HX77G: Ø173.2 (126.728-375)
...
...
max:
0 100 Tooltip Neptune Series HX77G: Ø122.9 (95.31-148.1)
...
...
max:
0 100 Tooltip Neptune Series HX77G: Ø83.4 (59.238-147.8)
...
max:
0 Tooltip Neptune Series HX77G: Ø41.9 (31.522-58.9)
...
max:
» With all tested laptops playable in detail settings ultra.
Additional Benchmarks
Low Preset 1280x720
0 100 Tooltip Neptune Series HX99G: Ø69.5 (56.354-118.6)
Neptune Series HX77G: Ø70.7 (52.587-120.3)
...
max:
0 Tooltip Neptune Series HX77G: Ø61.1 (49.11-79.5)
Neptune Series HX99G: Ø61.4 (45.073-88)
...
...
max:
0 100 Tooltip Neptune Series HX99G: Ø58.6 (43.92-92.7)
Neptune Series HX77G: Ø58.1 (42.108-107.3)
...
...
max:
0 100 200 300 Tooltip Neptune Series HX77G: Ø65.6 (41.726-386)
Neptune Series HX99G: Ø53.4 (42.217-91.6)
...
...
max:
0 Tooltip Neptune Series HX77G: Ø31.6 (23.075-45.6)
Neptune Series HX99G: Ø34.5 (24.353-100)
...
max:
0 Tooltip Neptune Series HX77G: Ø17.4 (11.172-36.5)
Neptune Series HX99G: Ø16.6 (14.071-28.8)
...
max:
» With all tested laptops playable in detail settings ultra.
Additional Benchmarks
Low Preset 1280x720
Epic Preset + Ray Tracing 1920x1080
0 100 200 Tooltip Neptune Series HX99G: Ø202 (120.149-298.8)
Neptune Series HX77G: Ø204 (168.008-286.6)
...
max:
0 100 200 Tooltip Neptune Series HX99G: Ø171.7 (147-212.63)
Neptune Series HX77G: Ø173.2 (146.02-223.2)
...
max:
0 100 200 300 400 500 600 700 Tooltip Neptune Series HX77G: Ø155 (114.14-746)
Neptune Series HX99G: Ø133.4 (113.144-180.3)
...
...
max:
0 100 200 Tooltip Neptune Series HX77G: Ø98.3 (82.068-165.9)
Neptune Series HX99G: Ø124.1 (97.222-208.3)
...
...
max:
0 100 200 Tooltip Neptune Series HX77G: Ø67.2 (57.241-93.3)
Neptune Series HX99G: Ø86.6 (66.112-261.4)
max:
0 Tooltip Neptune Series HX77G: Ø33.8 (27.575-42.8)
Neptune Series HX99G: Ø38.8 (31.27-76.8)
max:
» With all tested laptops playable in detail settings ultra.
Additional Benchmarks
Low Preset Low TAA 1280x720
0 100 200 Tooltip : Ø73.1 (53.101-97.8)
Neptune Series HX99G: Ø91.2 (69.059-270.7)
Neptune Series HX77G: Ø91 (70.61-151.4)
...
max:
0 Tooltip : Ø61.4 (52.01-87.8)
Neptune Series HX99G: Ø70.6 (58.003-87.4)
Neptune Series HX77G: Ø74.1 (57.206-93.2)
...
max:
0 100 200 300 400 500 600 700 800 Tooltip : Ø56.5 (48.2-97.7)
Neptune Series HX77G: Ø60.6 (50.11-103)
Neptune Series HX99G: Ø81.6 (53.724-828)
...
...
max:
0 100 200 Tooltip : Ø40.4 (31.123-77.1)
Neptune Series HX77G: Ø49.6 (35.083-231.4)
Neptune Series HX99G: Ø52.9 (39.37-112.8)
max:
0 100 Tooltip : Ø28.3 (15.437-160.1)
Neptune Series HX77G: Ø30.3 (21.993-79.2)
Neptune Series HX99G: Ø35.9 (24.323-124)
...
max:
0 100 200 300 400 500 600 700 800 900 1000 1100 1200 1300 1400 1500 1600 1700 1800 1900 2000 2100 2200 2300 2400 2500 2600 2700 2800 Tooltip : Ø13.2 (4.69-58.7)
Neptune Series HX77G: Ø56.3 (3.118-2883)
Neptune Series HX99G: Ø22.4 (9.195-196)
max:
» With all tested laptops playable in detail settings ultra.
Additional Benchmarks
Low Preset 1280x720
0 100 200 300 400 Tooltip : Ø106.8 (59.13-120.07)
Neptune Series HX99G: Ø128.4 (107.22-401)
Neptune Series HX77G: Ø126.9 (112.472-175.7)
...
max:
0 100 Tooltip Neptune Series HX99G: Ø89.7 (79.524-118.827)
: Ø91.5 (82.061-108)
Neptune Series HX77G: Ø95.9 (86.639-113.14)
...
...
max:
0 100 Tooltip : Ø82.3 (70.379-151.9)
Neptune Series HX99G: Ø80 (69.56-108.3)
Neptune Series HX77G: Ø86.1 (73.189-132)
...
...
max:
0 100 200 Tooltip : Ø52.9 (50.2-56.97)
Neptune Series HX99G: Ø61.4 (48.25-230.3)
Neptune Series HX77G: Ø54.6 (44.127-70.5)
...
...
max:
0 Tooltip Neptune Series HX99G: Ø39.4 (23.241-65.7)
: Ø42.5 (37.049-63.1)
Neptune Series HX77G: Ø40.5 (34.114-49.9)
...
max:
0 100 Tooltip Neptune Series HX77G: Ø13.5 (8.04-19.444)
Neptune Series HX99G: Ø28.9 (20.055-166.9)
max:
» With all tested laptops playable in detail settings ultra.
Additional Benchmarks
Prioritize Performance Preset 1280x720
...
max:
...
...
max:
...
...
max:
...
...
max:
...
max:
...
max:
» With all tested laptops playable in detail settings ultra.
Additional Benchmarks
Minimum Settings 1280x720
0 100 200 300 400 500 Tooltip : Ø73.8 (65.065-101.4)
Neptune Series HX99G: Ø96.2 (72.286-581)
Neptune Series HX77G: Ø92.9 (77.026-213.4)
...
...
max:
0 100 Tooltip : Ø76.9 (63.059-175.7)
Neptune Series HX99G: Ø77 (65.25-115)
Neptune Series HX77G: Ø83.4 (67.26-180.8)
...
...
max:
0 100 Tooltip : Ø68.7 (60.063-95.4)
Neptune Series HX99G: Ø75.7 (60.176-175.1)
Neptune Series HX77G: Ø79.4 (61.101-131.2)
...
...
max:
0 100 200 Tooltip : Ø67.9 (54.91-104.2)
Neptune Series HX99G: Ø71.4 (59.036-89.8)
Neptune Series HX77G: Ø80 (60.05-230.4)
...
...
max:
0 100 200 300 400 500 600 700 800 900 1000 1100 1200 1300 1400 1500 1600 1700 1800 1900 2000 2100 Tooltip : Ø59.6 (42.182-270)
Neptune Series HX99G: Ø58.4 (42.434-256)
Neptune Series HX77G: Ø105.7 (43.199-2111)
...
max:
0 100 Tooltip Neptune Series HX77G: Ø31.2 (20.266-109.6)
: Ø32.5 (23.11-96.1)
Neptune Series HX99G: Ø37.1 (22.04-127.3)
max:
» With all tested laptops playable in detail settings ultra.
Additional Benchmarks
Ultra Low Preset 1280x720
0 100 200 300 400 500 600 Tooltip : Ø161 (141.598-301.6)
Neptune Series HX77G: Ø168.2 (153.21-231)
Neptune Series HX99G: Ø182.9 (155.351-672)
...
max:
0 100 200 300 400 500 Tooltip : Ø112.8 (101.037-179.9)
Neptune Series HX77G: Ø118.1 (104.389-163.7)
Neptune Series HX99G: Ø129.5 (108.534-509)
...
...
max:
0 100 200 300 400 Tooltip : Ø70.4 (59.002-275)
Neptune Series HX77G: Ø76.3 (62.262-423)
Neptune Series HX99G: Ø72.4 (64.453-103.2)
...
...
max:
0 100 200 300 Tooltip : Ø57.2 (46.094-298)
Neptune Series HX77G: Ø60.5 (47.039-357)
Neptune Series HX99G: Ø61.4 (49.79-308)
...
...
max:
0 100 200 300 400 500 Tooltip Neptune Series HX77G: Ø43.9 (35.205-219.2)
: Ø42.1 (36.308-88)
Neptune Series HX99G: Ø51.4 (37.01-567)
...
max:
0 100 200 300 400 500 Tooltip Neptune Series HX77G: Ø32.4 (20.002-520)
: Ø29.1 (21.052-98.6)
Neptune Series HX99G: Ø32 (21.059-447)
...
max:
» With all tested laptops playable in detail settings ultra.
Additional Benchmarks
Low Preset 1280x720
...
max:
...
...
max:
...
...
max:
...
...
max:
...
max:
...
max:
» With all tested laptops playable in detail settings ultra.
Additional Benchmarks
Low Preset 1280x720
Epic Preset + Epic Ray-Tracing 1920x1080
35 [X] Lenovo Legion 5 AMD Ryzen 7 5800H 3.2GHz
Radeon RX 6600M
min:
12 fps
Epic Preset + Epic Ray-Tracing 3840x2160
11 [X] Lenovo Legion 5 AMD Ryzen 7 5800H 3.2GHz
Radeon RX 6600M
min:
3 fps
0 100 Tooltip Neptune Series HX99G: Ø105 (86.229-157)
...
max:
0 Tooltip : Ø85 (69.17-95.41)
Neptune Series HX99G: Ø89.8 (78.911-97.96)
...
...
max:
0 100 Tooltip : Ø74.7 (62.011-141.5)
Neptune Series HX99G: Ø77.3 (62.075-134.2)
...
...
max:
0 Tooltip : Ø54.6 (44.187-80.3)
Neptune Series HX99G: Ø55.1 (43.729-77.1)
...
...
max:
0 Tooltip : Ø38.5 (29.211-72.1)
Neptune Series HX99G: Ø38.4 (33.137-44.21)
...
max:
0 Tooltip : Ø18.8 (16.039-24.71)
Neptune Series HX99G: Ø26.4 (19.322-74.5)
...
max:
» With all tested laptops playable in detail settings ultra.
Additional Benchmarks
Low Preset Low TAA 1280x720
Ultra Preset + Full Ray Tracing High TAA 1920x1080
13.3 [X] Lenovo Legion 5 AMD Ryzen 7 5800H 3.2GHz
Radeon RX 6600M
min:
2.92 fps, P0.1:
2.98 fps, P1:
3.21 fps, max:
68.1 fps
Ultra Preset + Full Ray Tracing High TAA 3840x2160
1.1 [X] Lenovo Legion 5 AMD Ryzen 7 5800H 3.2GHz
Radeon RX 6600M
min:
0.619 fps, P0.1:
0.623 fps, P1:
0.665 fps, max:
2.46 fps
0 100 Tooltip : Ø66.5 (51.73-87)
Neptune Series HX99G: Ø68.8 (55.171-96.3)
Neptune Series HX77G: Ø73.7 (61.382-127.6)
...
...
max:
0 100 200 Tooltip : Ø63.5 (51.32-98.9)
Neptune Series HX99G: Ø64.6 (51.466-90.58)
Neptune Series HX77G: Ø77.5 (54.514-221)
...
...
max:
0 100 200 Tooltip : Ø61 (42.166-229.3)
Neptune Series HX99G: Ø54 (44.136-70.21)
Neptune Series HX77G: Ø60.3 (45.36-140)
...
...
max:
0 100 200 Tooltip : Ø54.3 (38.29-148.7)
Neptune Series HX99G: Ø66.5 (43.458-272)
Neptune Series HX77G: Ø57.7 (44.06-118.6)
...
...
max:
0 100 200 Tooltip : Ø31.7 (26.198-51.5)
Neptune Series HX99G: Ø37.7 (28.056-77.9)
Neptune Series HX77G: Ø48.8 (28.155-238)
...
max:
0 Tooltip : Ø13.7 (8.025-42.7)
Neptune Series HX77G: Ø12 (8.1-20.63)
Neptune Series HX99G: Ø17.7 (12.033-78.9)
...
...
max:
» With all tested laptops playable in detail settings ultra.
Additional Benchmarks
Low Preset TAA 1280x720
0 100 Tooltip Neptune Series HX99G: Ø153.9 (136.716-180.1)
...
max:
0 100 200 Tooltip : Ø113.1 (95.24-139.8)
Neptune Series HX99G: Ø126.4 (109.329-245.1)
...
...
max:
0 100 Tooltip : Ø99 (84.035-133.7)
Neptune Series HX99G: Ø109.6 (95.023-147)
...
...
max:
0 100 Tooltip : Ø81.3 (60.036-148.4)
Neptune Series HX99G: Ø96.1 (81.07-198.1)
...
...
max:
0 Tooltip : Ø54.3 (45.177-77.7)
Neptune Series HX99G: Ø60.7 (51.112-76.7)
max:
0 100 200 300 400 500 600 700 800 900 1000 1100 Tooltip : Ø54.2 (25.158-1185)
Neptune Series HX99G: Ø34.7 (27.124-117.7)
...
max:
» With all tested laptops playable in detail settings ultra.
Additional Benchmarks
Low Preset / Off 1280x720
RT Ultra Preset / On FXAA 1920x1080
15.6 [X] Lenovo Legion 5 AMD Ryzen 7 5800H 3.2GHz
Radeon RX 6600M
min:
2.76 fps, P0.1:
3.08 fps, P1:
6.06 fps, max:
95.5 fps
0 100 200 Tooltip : Ø169.6 (144.154-239)
Neptune Series HX99G: Ø204 (175.103-237.4)
...
max:
0 100 200 Tooltip : Ø122.7 (102.15-147.259)
Neptune Series HX99G: Ø156.3 (107.7-233.9)
...
...
max:
0 100 Tooltip : Ø108.1 (85.29-182.3)
Neptune Series HX99G: Ø110.8 (83.338-126.7)
...
...
max:
0 100 Tooltip : Ø82.6 (66.787-106.9)
Neptune Series HX99G: Ø91.1 (66.521-136.9)
...
...
max:
0 100 Tooltip : Ø51.2 (37.245-101.1)
Neptune Series HX99G: Ø53.2 (40.014-74.9)
...
max:
0 100 Tooltip : Ø26 (16.897-128.8)
Neptune Series HX99G: Ø23.7 (16.014-47.9)
...
max:
» With all tested laptops playable in detail settings ultra.
Additional Benchmarks
Low Preset 1280x720
...
max:
...
...
max:
...
...
max:
...
...
max:
...
max:
max:
» With all tested laptops playable in detail settings ultra.
Additional Benchmarks
Low Preset (without FSR Upscaling) 1280x720
Ultra Preset (without FSR Upscaling) + Full Ray-Tracing 1920x1080
38.6 [X] Lenovo Legion 5 AMD Ryzen 7 5800H 3.2GHz
Radeon RX 6600M
0 100 Tooltip Neptune Series HX99G: Ø115 (100.579-151)
Neptune Series HX77G: Ø146.5 (130.113-196.8)
...
max:
0 100 200 300 400 500 Tooltip : Ø102.6 (79.099-379)
Neptune Series HX99G: Ø118 (94.08-548)
Neptune Series HX77G: Ø122 (112.159-160.8)
...
max:
0 100 200 Tooltip : Ø82.4 (62.154-258.8)
Neptune Series HX99G: Ø84 (73.281-96.2)
Neptune Series HX77G: Ø93.2 (75.991-119.4)
...
max:
0 100 Tooltip : Ø61.3 (42.05-75.45)
Neptune Series HX99G: Ø72.1 (58.08-151.4)
Neptune Series HX77G: Ø95.9 (83.87-160.8)
...
max:
0 Tooltip : Ø40.9 (21.156-68.7)
Neptune Series HX99G: Ø55.2 (44.271-87.4)
Neptune Series HX77G: Ø64.9 (55.184-88.9)
max:
0 Tooltip : Ø29.7 (23.845-45.8)
Neptune Series HX99G: Ø28.9 (23.113-45.8)
Neptune Series HX77G: Ø33.7 (27.755-49.5)
max:
» With all tested laptops playable in detail settings ultra.
Additional Benchmarks
Low Preset 1280x720
0 100 Tooltip Neptune Series HX90G: Ø94.6 (72.011-143.49)
...
max:
0 100 Tooltip : Ø86 (71.845-168.8)
Neptune Series HX90G: Ø87.3 (72.096-128.06)
...
...
max:
0 100 Tooltip : Ø73.9 (63.086-88.8)
Neptune Series HX90G: Ø85.9 (68.09-122.22)
...
...
max:
0 100 Tooltip : Ø73.1 (63.112-131.5)
Neptune Series HX90G: Ø72.4 (63.549-121.1)
...
...
max:
0 100 200 300 400 500 600 700 800 Tooltip Neptune Series HX90G: Ø50.1 (41.982-70.61)
: Ø85.8 (45.07-825)
...
max:
0 100 200 300 Tooltip Neptune Series HX90G: Ø39.3 (17.16-344)
: Ø30.5 (23.695-56.4)
max:
» With all tested laptops playable in detail settings ultra.
Additional Benchmarks
Very Low Preset 1280x720
Very High Preset + Ray-Tracing TAA 1920x0180
5.6 [X] Lenovo Legion 5 AMD Ryzen 7 5800H 3.2GHz
Radeon RX 6600M
min:
3.21 fps, P0.1:
3.25 fps, P1:
3.8 fps, max:
10.2 fps
...
max:
...
...
max:
...
max:
...
...
max:
...
max:
...
max:
» With all tested laptops playable in detail settings ultra.
Additional Benchmarks
Basic Quality Preset T2X SMAA 1280x720
0 100 Tooltip Neptune Series HX90G: Ø78.4 (71.04-88.7)
Neptune Series HX77G: Ø84.3 (75.596-105.7)
...
max:
0 100 Tooltip : Ø78.5 (66.06-133.9)
Neptune Series HX90G: Ø75.9 (67.944-84.2)
Neptune Series HX77G: Ø81.2 (72.818-102.4)
...
max:
0 100 Tooltip : Ø75 (59.46-192.5)
Neptune Series HX90G: Ø73.1 (62.553-134.2)
Neptune Series HX77G: Ø73 (64.244-84.9)
...
max:
0 100 Tooltip : Ø67.6 (56.272-172.4)
Neptune Series HX90G: Ø68 (61.728-86.5)
Neptune Series HX77G: Ø71.9 (63.697-163.5)
...
...
max:
0 100 Tooltip Neptune Series HX90G: Ø37.3 (30.014-64)
Neptune Series HX77G: Ø45.7 (41.02-56.9)
: Ø51.6 (43.123-136.2)
...
max:
0 100 200 300 400 500 600 700 Tooltip : Ø43.5 (11.371-716)
Neptune Series HX90G: Ø20 (18.399-22.58)
Neptune Series HX77G: Ø23.8 (19.679-46.2)
max:
» With all tested laptops playable in detail settings ultra.
Additional Benchmarks
Low Preset 1280x720
0 100 200 300 400 500 600 700 800 900 Tooltip Neptune Series HX90G: Ø103 (70.156-995)
Neptune Series HX77G: Ø100.4 (81.079-182.2)
...
max:
0 100 200 Tooltip : Ø56.9 (44.758-175)
Neptune Series HX90G: Ø72.6 (60.039-224.6)
Neptune Series HX77G: Ø72.8 (63.52-128)
...
...
max:
0 Tooltip : Ø43.4 (37.135-62.8)
Neptune Series HX77G: Ø53.3 (47.006-68.9)
Neptune Series HX90G: Ø58.3 (49.125-85.1)
...
...
max:
0 100 200 300 400 Tooltip : Ø56.7 (31.304-477)
Neptune Series HX77G: Ø43.1 (34.023-126.1)
Neptune Series HX90G: Ø58.4 (40.178-407)
...
...
max:
0 100 200 300 Tooltip : Ø28.4 (23.043-51)
Neptune Series HX77G: Ø43.6 (24.79-343)
Neptune Series HX90G: Ø39.9 (31.222-118.2)
max:
0 100 200 Tooltip : Ø16.2 (13.003-41.5)
Neptune Series HX77G: Ø20.4 (13.076-73.2)
Neptune Series HX90G: Ø32.2 (19.065-250)
...
max:
» With all tested laptops playable in detail settings ultra.
Additional Benchmarks
Low Preset 1280x720
0 100 Tooltip Neptune Series HX90G: Ø173.2 (166.237-196.9)
...
max:
0 100 200 Tooltip : Ø113.1 (96.543-219.9)
Neptune Series HX90G: Ø172.8 (167.152-208.6)
...
max:
0 100 200 300 400 500 600 700 800 900 1000 Tooltip : Ø105.1 (93.2-180.4)
Neptune Series HX90G: Ø196.9 (165.33-1019)
...
max:
0 100 Tooltip : Ø100.4 (81.94-143.5)
Neptune Series HX90G: Ø173.2 (160.296-192.5)
...
max:
0 100 200 Tooltip : Ø82.5 (76.75-89.53)
Neptune Series HX90G: Ø141.3 (130.89-245)
...
max:
0 100 Tooltip : Ø44.3 (32.139-58.4)
Neptune Series HX90G: Ø76.3 (72.168-104.7)
max:
» With all tested laptops playable in detail settings ultra.
Additional Benchmarks
Low Rendering Quality 1280x720
0 100 200 Tooltip Neptune Series HX90G: Ø124.5 (99.313-224.4)
Neptune Series HX77G: Ø123.8 (101.222-175.4)
...
max:
0 100 200 Tooltip Neptune Series HX77G: Ø92.3 (72.028-137.7)
Neptune Series HX90G: Ø95.6 (72.702-202.9)
: Ø97.9 (76.858-127.9)
...
...
max:
0 100 200 300 400 500 600 Tooltip Neptune Series HX77G: Ø75.2 (57.112-93.9)
Neptune Series HX90G: Ø96.3 (63.532-665)
: Ø89.2 (63.126-287)
...
...
max:
0 100 200 300 400 500 600 700 800 Tooltip : Ø76 (45.176-816)
Neptune Series HX77G: Ø53.8 (45.615-71.5)
Neptune Series HX90G: Ø58 (46.045-98.1)
...
...
max:
0 100 Tooltip Neptune Series HX77G: Ø38.1 (22.636-146.3)
Neptune Series HX90G: Ø40.6 (24.99-146.9)
...
max:
0 100 Tooltip Neptune Series HX90G: Ø21.1 (-0.87767-195.7)
Neptune Series HX77G: Ø17.1 (8.246-42.5)
max:
» With all tested laptops playable in detail settings ultra.
Additional Benchmarks
Low Preset 1280x720
...
...
max:
...
...
max:
...
...
max:
...
...
max:
...
...
max:
...
max:
» With all tested laptops playable in detail settings ultra.
Additional Benchmarks
Ultra Low Preset 16xAF TAA 1280x720
...
...
max:
...
...
max:
...
...
max:
» With all tested laptops playable in detail settings ultra.
...
...
max:
...
...
max:
...
...
max:
» With all tested laptops playable in detail settings ultra.
...
...
max:
...
...
max:
...
...
max:
...
...
max:
...
...
max:
...
max:
» With all tested laptops playable in detail settings ultra.
Additional Benchmarks
Lowest Preset (DX12) 1280x720
...
...
max:
...
...
max:
...
...
max:
...
...
max:
...
...
max:
...
...
max:
» With all tested laptops playable in detail settings ultra.
Additional Benchmarks
Low Preset 1280x720
Ray Tracing Ultra Preset (DLSS off) 1920x1080
Ray Tracing Ultra Preset (DLSS off) 3840x2160
0 100 Tooltip Legion 5 15ACH6A-82NW0010GE: Ø76.3 (60.66-148.9)
Legion 5 15ACH6A-82NW0010GE: Ø76.3 (60.66-148.9)
Legion 5 15ACH6A-82NW0010GE: Ø76.3 (60.66-148.9)
...
0 100 Tooltip Legion 5 15ACH6A-82NW0010GE: Ø74 (56.028-104.6)
Legion 5 15ACH6A-82NW0010GE: Ø74 (56.028-104.6)
Legion 5 15ACH6A-82NW0010GE: Ø74 (56.028-104.6)
...
...
0 100 Tooltip Legion 5 15ACH6A-82NW0010GE: Ø72.2 (52.749-107.8)
Legion 5 15ACH6A-82NW0010GE: Ø72.2 (52.749-107.8)
Legion 5 15ACH6A-82NW0010GE: Ø72.2 (52.749-107.8)
...
...
0 100 Tooltip Legion 5 15ACH6A-82NW0010GE: Ø69.4 (50.1-105.4)
Legion 5 15ACH6A-82NW0010GE: Ø69.4 (50.1-105.4)
Legion 5 15ACH6A-82NW0010GE: Ø69.4 (50.1-105.4)
...
...
» With all tested laptops playable in detail settings ultra.
Additional Benchmarks
Low / Off 1280x720
...
max:
...
max:
...
max:
...
...
max:
...
max:
...
max:
» With all tested laptops playable in detail settings ultra.
Additional Benchmarks
Low Preset 1280x720
...
max:
...
...
max:
...
max:
» With all tested laptops playable in detail settings ultra.
0 100 Tooltip Legion 5 15ACH6A-82NW0010GE: Ø106.9 (98.17-135.3)
Legion 5 15ACH6A-82NW0010GE: Ø106.9 (98.17-135.3)
...
max:
0 Tooltip Legion 5 15ACH6A-82NW0010GE: Ø81.7 (74.19-92.8)
Legion 5 15ACH6A-82NW0010GE: Ø81.7 (74.19-92.8)
...
...
max:
0 Tooltip Legion 5 15ACH6A-82NW0010GE: Ø65 (59.14-89.5)
Legion 5 15ACH6A-82NW0010GE: Ø65 (59.14-89.5)
...
...
max:
» With all tested laptops playable in detail settings high.
Additional Benchmarks
Low Quality 1280x720
...
max:
...
...
max:
...
...
max:
...
...
max:
» With all tested laptops playable in detail settings ultra.
0 100 200 Tooltip Legion 5 15ACH6A-82NW0010GE: Ø80.3 (62.113-233)
Legion 5 15ACH6A-82NW0010GE: Ø80.3 (62.113-233.1)
Neptune Series HX99G: Ø93.7 (73.221-111.7)
Neptune Series HX90G: Ø112.3 (92.07-156.5)
Neptune Series HX77G: Ø112.9 (90.41-131.4)
...
...
max:
0 100 Tooltip Legion 5 15ACH6A-82NW0010GE: Ø77.9 (62.325-200)
Legion 5 15ACH6A-82NW0010GE: Ø77.9 (62.325-200)
Neptune Series HX99G: Ø87.3 (61.12-104)
Neptune Series HX90G: Ø100.9 (90.423-125.2)
Neptune Series HX77G: Ø105.1 (90.855-113.77)
...
...
max:
0 100 Tooltip Legion 5 15ACH6A-82NW0010GE: Ø66.7 (53.391-84.8)
Legion 5 15ACH6A-82NW0010GE: Ø66.7 (53.391-84.8)
Neptune Series HX90G: Ø84 (71.028-166.1)
Neptune Series HX99G: Ø85.7 (73.433-128.5)
Neptune Series HX77G: Ø86.5 (76.023-165.8)
...
...
max:
0 100 200 300 400 500 600 700 800 900 1000 1100 1200 Tooltip Legion 5 15ACH6A-82NW0010GE: Ø67.3 (47.09-292)
Legion 5 15ACH6A-82NW0010GE: Ø67.3 (47.09-292)
Neptune Series HX90G: Ø63.7 (47.348-269)
Neptune Series HX99G: Ø126.8 (49.005-1226)
Neptune Series HX77G: Ø62.8 (52.064-95.8)
...
...
max:
0 100 Tooltip Neptune Series HX90G: Ø49.2 (40.665-128.2)
Neptune Series HX99G: Ø47.9 (40.398-89.2)
Neptune Series HX77G: Ø52.8 (42.258-102.9)
...
...
max:
0 100 200 Tooltip Neptune Series HX90G: Ø32.3 (23.401-202.4)
Neptune Series HX99G: Ø28.6 (24.075-46.6)
Neptune Series HX77G: Ø32.4 (27.042-87.8)
...
max:
» With all tested laptops playable in detail settings ultra.
Additional Benchmarks
Low Preset 1280x720
...
...
...
...
...
...
» With all tested laptops playable in detail settings ultra.
0 100 200 Tooltip Legion 5 15ACH6A-82NW0010GE: Ø175.6 (148.4-264.8)
Legion 5 15ACH6A-82NW0010GE: Ø175.6 (148.4-264.8)
Neptune Series HX90G: Ø209 (185.074-247.4)
...
max:
0 100 200 Tooltip Neptune Series HX90G: Ø135.2 (44.789-186.48)
Legion 5 15ACH6A-82NW0010GE: Ø141.3 (115.65-242.7)
Legion 5 15ACH6A-82NW0010GE: Ø141.3 (115.65-242.7)
...
...
max:
0 100 200 300 400 500 600 700 800 900 1000 1100 1200 Tooltip Neptune Series HX90G: Ø143 (20.4-1226)
Legion 5 15ACH6A-82NW0010GE: Ø122.4 (100.598-173.4)
Legion 5 15ACH6A-82NW0010GE: Ø122.4 (100.598-173.4)
...
...
max:
0 100 200 300 400 500 600 Tooltip Neptune Series HX90G: Ø112.7 (46.719-144)
Legion 5 15ACH6A-82NW0010GE: Ø129.6 (103.397-644)
Legion 5 15ACH6A-82NW0010GE: Ø129.6 (103.397-644)
...
...
max:
0 100 200 Tooltip Neptune Series HX90G: Ø117.2 (90.294-208.5)
...
max:
0 100 200 Tooltip Neptune Series HX90G: Ø76.3 (59.616-277)
...
max:
» With all tested laptops playable in detail settings ultra.
Additional Benchmarks
Low Preset 1920x1080
...
max:
...
...
max:
...
...
max:
...
...
max:
...
max:
max:
» With all tested laptops playable in detail settings ultra.
Additional Benchmarks
Low Preset 1920x1080
...
...
max:
...
...
max:
...
...
max:
...
...
max:
» With all tested laptops playable in detail settings ultra.
...
...
max:
...
...
max:
...
...
max:
...
...
max:
...
max:
...
max:
» With all tested laptops playable in detail settings ultra.
Additional Benchmarks
Low Preset 1920x1080
Ultra Preset + Ultra Ray-Tracing 1920x1080
...
...
...
» With all tested laptops playable in detail settings ultra.
0 100 Tooltip Neptune Series HX90G: Ø102 (78-174)
Legion 5 15ACH6A-82NW0010GE: Ø105.6 (82-144)
Legion 5 15ACH6A-82NW0010GE: Ø105.6 (82-144)
Alpha 15 B5EEK-008: Ø112.8 (89-144)
Neptune Series HX99G: Ø125.3 (100-162)
Neptune Series HX77G: Ø135.9 (89-192)
...
...
max:
0 100 Tooltip Neptune Series HX90G: Ø86.6 (68-125)
Legion 5 15ACH6A-82NW0010GE: Ø88.1 (69-112)
Legion 5 15ACH6A-82NW0010GE: Ø88.1 (69-112)
Alpha 15 B5EEK-008: Ø98.5 (78-114)
Neptune Series HX99G: Ø101.2 (80-127)
Neptune Series HX77G: Ø117 (92-149)
...
...
max:
0 100 Tooltip Neptune Series HX90G: Ø78.2 (61-117)
Legion 5 15ACH6A-82NW0010GE: Ø80.5 (59-102)
Legion 5 15ACH6A-82NW0010GE: Ø80.5 (59-102)
Alpha 15 B5EEK-008: Ø86.6 (70-98)
Neptune Series HX99G: Ø92.2 (70-113)
Neptune Series HX77G: Ø108.9 (82-132)
...
...
max:
0 100 Tooltip Legion 5 15ACH6A-82NW0010GE: Ø51.6 (10-78)
Legion 5 15ACH6A-82NW0010GE: Ø76.1 (56-97)
Neptune Series HX90G: Ø71.5 (51-93)
Alpha 15 B5EEK-008: Ø75.2 (62-85)
Neptune Series HX77G: Ø87.2 (70-100)
Neptune Series HX99G: Ø91.7 (68-112)
...
...
max:
0 Tooltip Neptune Series HX90G: Ø61.7 (50-69)
Neptune Series HX77G: Ø63.8 (55-70)
Neptune Series HX99G: Ø68.6 (59-77)
...
...
max:
0 Tooltip Neptune Series HX90G: Ø2.85 (2-3)
Neptune Series HX77G: Ø9.03 (7-10)
Neptune Series HX99G: Ø15 (13-17)
...
...
max:
» With all tested laptops playable in detail settings ultra.
Additional Benchmarks
Low Graphics Quality 1920x1080
Ultra Graphics Quality + HD Textures + DXR TAA 1920x1080
0 100 200 Tooltip Legion 5 15ACH6A-82NW0010GE: Ø129.3 (106.116-206.73)
Legion 5 15ACH6A-82NW0010GE: Ø129.3 (106.116-206.73)
...
0 100 200 Tooltip Legion 5 15ACH6A-82NW0010GE: Ø126.6 (104.279-242)
Legion 5 15ACH6A-82NW0010GE: Ø126.6 (104.279-241.6)
...
max:
» With all tested laptops playable in detail settings high.
Additional Benchmarks
Low Preset 1920x1080
0 100 200 Tooltip Neptune Series HX90G: Ø120.5 (81.2-256.4)
...
max:
0 100 Tooltip : Ø80.1 (56.339-130.5)
Neptune Series HX90G: Ø93.9 (62.58-149.8)
...
max:
0 100 Tooltip : Ø74.6 (54.621-132.8)
Neptune Series HX90G: Ø87.4 (57.101-129.4)
...
max:
0 100 200 Tooltip : Ø67.3 (45.3-124)
Neptune Series HX90G: Ø83.2 (49.662-228.8)
...
max:
0 Tooltip Neptune Series HX90G: Ø54.1 (41.619-79.5)
max:
0 100 Tooltip Neptune Series HX90G: Ø36.7 (29.211-164.7)
max:
» With all tested laptops playable in detail settings ultra.
Additional Benchmarks
Low Video Quality 1920x1080
...
...
...
...
...
...
» With all tested laptops playable in detail settings ultra.
...
max:
...
...
max:
...
...
max:
...
...
max:
...
...
max:
...
max:
» With all tested laptops playable in detail settings ultra.
...
...
...
...
...
...
max:
» With all tested laptops playable in detail settings ultra.
0 100 200 Tooltip : Ø171.5 (147.52-201.461)
...
max:
0 100 200 Tooltip : Ø169.6 (112.455-214.53)
...
max:
...
» With all tested laptops playable in detail settings ultra.
...
...
max:
...
...
max:
...
...
max:
» With all tested laptops playable in detail settings ultra.
...
...
max:
...
...
max:
...
...
max:
» With all tested laptops playable in detail settings ultra.
0 100 200 Tooltip Alpha 15 B5EEK-008: Ø130.6 (108.01-297)
...
max:
0 100 Tooltip Alpha 15 B5EEK-008: Ø74.1 (64.01-153.8)
...
...
max:
0 100 200 300 400 500 600 700 800 900 1000 1100 1200 1300 1400 1500 1600 1700 1800 1900 2000 2100 2200 2300 2400 2500 2600 2700 2800 2900 3000 3100 3200 3300 3400 3500 3600 3700 3800 3900 4000 4100 4200 4300 4400 4500 4600 4700 4800 4900 5000 5100 5200 5300 5400 5500 5600 5700 5800 5900 6000 6100 6200 6300 6400 6500 6600 6700 6800 6900 7000 7100 7200 7300 7400 7500 7600 7700 7800 7900 8000 8100 8200 8300 8400 8500 8600 8700 8800 8900 9000 9100 9200 9300 9400 9500 9600 9700 9800 9900 Tooltip Alpha 15 B5EEK-008: Ø320 (52.212-18093)
...
...
max:
0 100 Tooltip Alpha 15 B5EEK-008: Ø50.2 (37.16-103.7)
...
...
max:
» With all tested laptops playable in detail settings ultra.
Additional Benchmarks
Low Preset 1920x1080
Ray Tracing Ultra Preset (DLSS off) 1920x1080
...
max:
...
...
max:
...
...
max:
...
...
max:
...
...
max:
...
max:
» With all tested laptops playable in detail settings ultra.
...
...
max:
...
...
max:
...
...
max:
...
...
max:
...
max:
...
max:
» With all tested laptops playable in detail settings ultra.
0 100 Tooltip Neptune Series HX77G: Ø121.7 (62-166)
...
max:
0 100 Tooltip Neptune Series HX77G: Ø120.5 (67-158)
...
max:
0 100 Tooltip Neptune Series HX77G: Ø108.1 (51-147)
...
max:
0 Tooltip Neptune Series HX77G: Ø59.1 (34-100)
...
...
max:
0 Tooltip Neptune Series HX77G: Ø41.4 (24-82)
...
...
max:
0 Tooltip Neptune Series HX77G: Ø21 (16-25)
...
...
max:
» With all tested laptops playable in detail settings ultra.
Additional Benchmarks
Ultra Preset + Ultra Ray Tracing (DX12) 1920x1080
0 100 200 300 400 500 600 700 800 900 1000 1100 Tooltip Legion 5 15ACH6A-82NW0010GE: Ø97.8 (74.783-143.694)
Legion 5 15ACH6A-82NW0010GE: Ø97.8 (74.783-143.694)
Legion 5 15ACH6A-82NW0010GE: Ø97.8 (74.783-143.694)
Neptune Series HX90G: Ø172.7 (101.266-1112)
...
...
max:
0 100 Tooltip Legion 5 15ACH6A-82NW0010GE: Ø86.5 (69.671-115.52)
Legion 5 15ACH6A-82NW0010GE: Ø86.5 (69.671-115.52)
Legion 5 15ACH6A-82NW0010GE: Ø86.5 (69.671-115.52)
Neptune Series HX90G: Ø95.2 (81.017-115.74)
...
...
max:
0 100 Tooltip Legion 5 15ACH6A-82NW0010GE: Ø81.6 (65.453-129.4)
Legion 5 15ACH6A-82NW0010GE: Ø81.6 (65.453-129.4)
Legion 5 15ACH6A-82NW0010GE: Ø81.6 (65.453-129.4)
Neptune Series HX90G: Ø88.6 (74.11-128.6)
...
...
max:
0 100 Tooltip Neptune Series HX90G: Ø62.3 (55.193-132.3)
...
...
max:
0 100 200 300 400 Tooltip Neptune Series HX90G: Ø46.4 (26.129-498)
...
...
max:
» With all tested laptops playable in detail settings high.
...
max:
...
max:
...
max:
...
...
max:
...
...
max:
...
...
max:
» With all tested laptops playable in detail settings ultra.
Additional Benchmarks
Ultimate Quality FidelityFX Quality 3840x2160
0 100 Tooltip Legion 5 15ACH6A-82NW0010GE: Ø130 (119.38-156.7)
Legion 5 15ACH6A-82NW0010GE: Ø144.8 (118.776-173.1)
...
...
max:
0 100 Tooltip Legion 5 15ACH6A-82NW0010GE: Ø127.3 (111.127-164)
Legion 5 15ACH6A-82NW0010GE: Ø127.3 (111.127-164)
...
...
max:
0 100 200 300 Tooltip Legion 5 15ACH6A-82NW0010GE: Ø123.6 (108.007-305)
Legion 5 15ACH6A-82NW0010GE: Ø123.6 (108.007-305)
...
...
max:
0 100 Tooltip Legion 5 15ACH6A-82NW0010GE: Ø114.1 (101.032-129.3)
Legion 5 15ACH6A-82NW0010GE: Ø114.1 (101.032-129.3)
...
...
max:
» With all tested laptops playable in detail settings ultra.
...
max:
...
max:
...
max:
...
max:
...
max:
...
max:
» With all tested laptops playable in detail settings ultra.
0 100 200 300 400 Tooltip Alpha 15 B5EEK-008: Ø320 (177-461)
...
max:
0 100 Tooltip Alpha 15 B5EEK-008: Ø161.7 (133.99-174.264)
...
...
max:
0 100 Tooltip Alpha 15 B5EEK-008: Ø153 (133.47-195.1)
...
...
max:
0 100 200 Tooltip Alpha 15 B5EEK-008: Ø153.3 (121.44-275)
...
...
max:
» With all tested laptops playable in detail settings ultra.
...
...
max:
...
...
max:
...
...
max:
...
...
max:
...
...
max:
...
...
max:
» With all tested laptops playable in detail settings ultra.
Additional Benchmarks
Very Low Overall Quality (DX11) 1920x1080
0 100 200 300 Tooltip Legion 5 15ACH6A-82NW0010GE: Ø211 (148.7-261.4)
Legion 5 15ACH6A-82NW0010GE: Ø211 (148.7-261.4)
Neptune Series HX90G: Ø223 (163.216-279.6)
Neptune Series HX77G: Ø240 (201.5-333.2)
...
...
max:
0 100 Tooltip Legion 5 15ACH6A-82NW0010GE: Ø97.5 (83.156-172.3)
Legion 5 15ACH6A-82NW0010GE: Ø97.5 (83.156-172.3)
Neptune Series HX90G: Ø107.1 (91.12-151.9)
Neptune Series HX77G: Ø110 (93.095-144.6)
...
...
max:
0 100 200 300 Tooltip Legion 5 15ACH6A-82NW0010GE: Ø74.4 (62.003-133.6)
Legion 5 15ACH6A-82NW0010GE: Ø74.4 (62.003-133.6)
Neptune Series HX90G: Ø82.3 (62.635-308)
Neptune Series HX77G: Ø79.1 (64.25-247.6)
...
...
max:
0 100 200 300 400 500 600 700 800 Tooltip Neptune Series HX90G: Ø56.1 (40.654-376)
Neptune Series HX77G: Ø72.7 (41.369-812)
...
...
max:
0 Tooltip Neptune Series HX90G: Ø23.2 (19.027-34.5)
Neptune Series HX77G: Ø24.1 (20.861-36)
...
...
max:
» With all tested laptops playable in detail settings high.
Additional Benchmarks
High Quality Preset & High Ray Tracing Preset (DX12) 1920x1080
High Quality Preset & High Ray Tracing Preset (DX12) 3840x2160
0 100 Tooltip Neptune Series HX90G: Ø112.1 (88.026-143.1)
...
max:
Intel Arc A580
0 100 Tooltip Neptune Series HX90G: Ø99.7 (81.008-128.1)
...
max:
0 100 Tooltip Neptune Series HX90G: Ø88.3 (66.538-188)
...
max:
0 100 Tooltip Neptune Series HX90G: Ø51 (41.038-117)
...
max:
0 100 Tooltip Neptune Series HX90G: Ø41.7 (35.169-148.4)
...
...
max:
0 Tooltip Neptune Series HX90G: Ø25.1 (19.036-57)
...
...
max:
» With all tested laptops playable in detail settings ultra.
0 100 Tooltip Legion 5 15ACH6A-82NW0010GE: Ø86.3 (65-118)
Legion 5 15ACH6A-82NW0010GE: Ø86.3 (65-118)
Neptune Series HX90G: Ø114.5 (90-166)
Neptune Series HX99G: Ø115.1 (84-166)
Neptune Series HX77G: Ø116.8 (92-170)
...
...
max:
0 100 Tooltip Legion 5 15ACH6A-82NW0010GE: Ø75.9 (61-105)
Legion 5 15ACH6A-82NW0010GE: Ø75.9 (61-105)
Neptune Series HX99G: Ø99.9 (79-146)
Neptune Series HX90G: Ø102.5 (81-153)
Neptune Series HX77G: Ø104.5 (83-153)
...
...
max:
0 100 Tooltip Legion 5 15ACH6A-82NW0010GE: Ø73.4 (59-100)
Legion 5 15ACH6A-82NW0010GE: Ø73.4 (59-100)
Neptune Series HX99G: Ø96.5 (76-139)
Neptune Series HX90G: Ø99 (77-144)
Neptune Series HX77G: Ø100.8 (78-147)
...
...
max:
0 100 Tooltip Legion 5 15ACH6A-82NW0010GE: Ø67.3 (48-100)
Neptune Series HX99G: Ø87.2 (62-137)
Neptune Series HX90G: Ø90 (63-144)
Neptune Series HX77G: Ø91.2 (64-144)
...
...
max:
0 100 Tooltip Neptune Series HX99G: Ø82.7 (60-124)
Neptune Series HX90G: Ø84.9 (63-124)
Neptune Series HX77G: Ø85.4 (63-126)
...
max:
0 Tooltip Neptune Series HX90G: Ø47.7 (38-62)
Neptune Series HX77G: Ø48.3 (39-63)
Neptune Series HX99G: Ø48.6 (39-63)
...
...
max:
» With all tested laptops playable in detail settings ultra.
...
max:
...
...
max:
...
...
max:
...
...
max:
...
...
max:
...
...
max:
» With all tested laptops playable in detail settings ultra.
Additional Benchmarks
Ultra Quality DXR 16xAF 1920x1080
...
max:
...
max:
...
max:
...
...
max:
...
max:
...
...
max:
» With all tested laptops playable in detail settings ultra.
...
max:
...
max:
...
max:
...
max:
max:
...
max:
» With all tested laptops playable in detail settings ultra.
...
...
max:
...
...
max:
...
...
max:
...
...
max:
...
...
max:
...
...
max:
» With all tested laptops playable in detail settings ultra.
Additional Benchmarks
Lowest Preset 1920x1080
...
...
max:
...
...
max:
...
...
max:
...
...
max:
...
...
max:
...
...
max:
» With all tested laptops playable in detail settings ultra.
0 100 Tooltip Legion 5 15ACH6A-82NW0010GE: Ø110.4 (75-141)
Alpha 15 B5EEK-008: Ø124.6 (100-162)
Neptune Series HX99G: Ø133.4 (107-170)
Neptune Series HX77G: Ø133.2 (107-175)
Neptune Series HX90G: Ø137.3 (108-178)
...
...
max:
0 100 Tooltip Legion 5 15ACH6A-82NW0010GE: Ø96.7 (79-124)
Alpha 15 B5EEK-008: Ø106.1 (90-131)
Neptune Series HX99G: Ø115.7 (94-150)
Neptune Series HX77G: Ø121.1 (101-160)
Neptune Series HX90G: Ø122.3 (97-160)
...
...
max:
0 100 Tooltip Legion 5 15ACH6A-82NW0010GE: Ø93.3 (74-119)
Alpha 15 B5EEK-008: Ø102.2 (84-123)
Omen 16-c0077ng: Ø102.7 (82-132)
Neptune Series HX99G: Ø112 (90-145)
Neptune Series HX77G: Ø114.8 (93-152)
Neptune Series HX90G: Ø116.3 (92-152)
...
...
max:
0 100 Tooltip Legion 5 15ACH6A-82NW0010GE: Ø86.2 (64-108)
Alpha 15 B5EEK-008: Ø95.3 (78-121)
Omen 16-c0077ng: Ø96.1 (73-124)
Neptune Series HX99G: Ø104.8 (82-136)
Neptune Series HX77G: Ø108.2 (82-142)
Neptune Series HX90G: Ø109.7 (87-142)
...
...
max:
0 100 Tooltip Omen 16-c0077ng: Ø81.4 (69-97)
Neptune Series HX90G: Ø88.8 (77-111)
Neptune Series HX99G: Ø89.9 (79-107)
Neptune Series HX77G: Ø90 (77-113)
...
...
max:
0 Tooltip Neptune Series HX90G: Ø43.3 (36-57)
Neptune Series HX99G: Ø44.3 (37-58)
Neptune Series HX77G: Ø44 (37-58)
...
...
max:
» With all tested laptops playable in detail settings ultra.
Additional Benchmarks
Low Preset TAA 1920x1080
...
...
max:
...
...
max:
...
...
max:
...
...
max:
» With all tested laptops playable in detail settings high.
...
...
max:
...
...
max:
...
...
max:
...
...
max:
...
...
max:
» With all tested laptops playable in detail settings high.
...
max:
...
max:
...
max:
...
max:
...
max:
...
max:
» With all tested laptops playable in detail settings ultra.
0 100 200 300 Tooltip Legion 5 15ACH6A-82NW0010GE: Ø207 (197.203-225.5)
Legion 5 15ACH6A-82NW0010GE: Ø207 (197.203-225.5)
Neptune Series HX90G: Ø267 (238.63-292.7)
Neptune Series HX77G: Ø272 (241.636-304.42)
...
max:
0 100 200 300 Tooltip Legion 5 15ACH6A-82NW0010GE: Ø166.7 (156.088-255.3)
Legion 5 15ACH6A-82NW0010GE: Ø166.7 (156.088-255.3)
Neptune Series HX77G: Ø190.3 (168.398-215.467)
Neptune Series HX90G: Ø214 (200.078-331.1)
...
max:
0 100 Tooltip Neptune Series HX77G: Ø113.7 (102.055-130.2)
Legion 5 15ACH6A-82NW0010GE: Ø124 (110.732-142.36)
Legion 5 15ACH6A-82NW0010GE: Ø124 (110.732-142.36)
Neptune Series HX90G: Ø132.6 (115.491-155.4)
...
...
max:
0 100 Tooltip Neptune Series HX77G: Ø93.3 (76.699-106.67)
Legion 5 15ACH6A-82NW0010GE: Ø101.5 (87.063-189.8)
Legion 5 15ACH6A-82NW0010GE: Ø101.5 (87.063-189.8)
Neptune Series HX90G: Ø107.5 (90.077-118.345)
...
...
max:
0 100 Tooltip Neptune Series HX90G: Ø50.2 (38.248-187)
Neptune Series HX77G: Ø43.5 (37.004-57.4)
...
...
max:
» With all tested laptops playable in detail settings ultra.
...
...
max:
...
...
max:
...
...
max:
...
...
max:
...
...
max:
» With all tested laptops playable in detail settings ultra.
0 100 200 300 400 Tooltip Legion 5 15ACH6A-82NW0010GE: Ø261 (201.59-411)
Alpha 15 B5EEK-008: Ø292 (274-317)
Neptune Series HX77G: Ø354 (299.441-405.568)
Neptune Series HX90G: Ø371 (270.313-415.847)
...
...
max:
0 100 200 300 400 500 600 Tooltip Legion 5 15ACH6A-82NW0010GE: Ø196.3 (165.38-253.2)
Alpha 15 B5EEK-008: Ø217 (200-234)
Neptune Series HX77G: Ø268 (235.42-602)
Neptune Series HX90G: Ø264 (241.478-292.87)
...
...
max:
0 100 200 300 400 Tooltip Alpha 15 B5EEK-008: Ø132.6 (114-150)
Legion 5 15ACH6A-82NW0010GE: Ø147.1 (127.361-305)
Neptune Series HX77G: Ø154.7 (132.65-438)
Neptune Series HX90G: Ø146.9 (134.42-160.86)
...
...
max:
0 100 Tooltip Alpha 15 B5EEK-008: Ø74.6 (40-80)
Legion 5 15ACH6A-82NW0010GE: Ø85.3 (70.433-114.9)
Omen 16-c0077ng: Ø79.4 (76-86)
Neptune Series HX77G: Ø90 (79.09-130.2)
Neptune Series HX90G: Ø90.1 (81.029-109.8)
...
...
max:
0 100 Tooltip Neptune Series HX77G: Ø68.5 (57.27-165.4)
max:
0 100 200 300 400 Tooltip Neptune Series HX77G: Ø46.4 (41.05-69.5)
Neptune Series HX90G: Ø54.4 (41.266-459)
...
...
max:
» With all tested laptops playable in detail settings ultra.
Additional Benchmarks
Ultra Graphics & Postprocessing (HBAO+) 3840x2160
Medium Graphics & Postprocessing 1920x1080
...
...
max:
...
...
max:
...
...
max:
...
...
max:
...
...
max:
...
...
max:
» With all tested laptops playable in detail settings ultra.
Additional Benchmarks
Highest Settings possible 16xAF 4xMSAA + FXAA 3840x2160
Normal/Off 4xAF 1920x1080
Lowest Settings possible 1920x1080
...
...
...
...
...
max:
» With all tested laptops playable in detail settings ultra.
low med. high ultra QHD 4K Alan Wake 2 52.4 44.1 40.6 25.2 12.6 Lords of the Fallen 66.4 56 38.7 26.5 17 7.64 Total War Pharaoh 286.2 186.4 112.6 91.4 59.2 27.4 Assassin's Creed Mirage 103 91 84 64 48 25 Cyberpunk 2077 2.0 Phantom Liberty 105.6 80.7 66.1 60.8 36.2 16 Lies of P 134.2 126 106.3 95.5 59.6 28.7 Starfield 58 50 40 36 28 17 Armored Core 6 74.9 72.6 69 68.9 52.3 31.2 Immortals of Aveum 61.1 49.8 36.6 23.8 11.5 Atlas Fallen 104.4 102.5 93.2 69.1 48.6 23.1 Baldur's Gate 3 114.4 91.8 74.8 72.9 48.6 23.7 Ratchet & Clank Rift Apart 62.8 59 47 39.4 34.9 30 F1 23 264 240 168.7 31.3 19.1 8.43 Diablo 4 206 179.2 159.4 120.6 75 39 Star Wars Jedi Survivor 66 58 54 51 30 15 Dead Island 2 196 171 129 107 70 34 The Last of Us 80 66 57 44 27 11 Resident Evil 4 Remake 114 90 79 51 38 17 Company of Heroes 3 127 113 85 84 60 34 Sons of the Forest 78 74 71 69 50 27 Atomic Heart 161 113 67 52 39 23 Returnal 88 85 76 62 44 23 Hogwarts Legacy 100.3 86 68 52 36 19 Dead Space Remake 66 62 52 50 31 11 The Witcher 3 v4.00 149.3 115 101 83 55 29 High On Life 181 136 104 82 47 20 The Callisto Protocol 129 92 69 57 41 24 Need for Speed Unbound 127 103 82 72 50 28 Spider-Man Miles Morales 94 81 77 68 48 26 Call of Duty Modern Warfare 2 2022 113 115 84 77 54 29 Uncharted Legacy of Thieves Collection 79 74 68 65 41 18 A Plague Tale Requiem 88 62 49 40 29 17 FIFA 23 170.4 137 134 133 107 57 The Quarry 118 92 74 52 34 13 F1 22 243 225 177 41 25 12 Vampire Bloodhunt 169.1 158.7 157.7 Ghostwire Tokyo 115.1 113.2 112 Tiny Tina's Wonderlands 186 143 91 70 49 21 Cyberpunk 2077 1.6 98 82 67 59 39 19 Elex 2 71 71 67 64 58 GRID Legends 190 171 141 116 94 56 Elden Ring 60 60 60 Dying Light 2 105 78 62 Rainbow Six Extraction 141 126 120 94 God of War 90 84 74 55 44 26 Halo Infinite 60.7 55.6 53.9 Farming Simulator 22 182 134 118 112 110.9 65.4 Forza Horizon 5 181 126 117 70 54 33 Riders Republic 89 83 77 76 Guardians of the Galaxy 104 102 101 101 100 58 Back 4 Blood 189 172 124 Far Cry 6 115 97 88 76 65 9 Alan Wake Remastered 124 121 New World 113.7 85 78 70 52.4 31.3 Deathloop 98 80.9 58.8 F1 2021 318 243 198 92 65 33 Days Gone 103.1 97.9 76.7 Resident Evil Village 170.7 168.7 146 Outriders 92.9 90.2 88.7 Hitman 3 154 147 140 Cyberpunk 2077 1.0 125 68.6 56.1 46.4 Assassin´s Creed Valhalla 155 95 79 69 52 27 Dirt 5 160 101 77 63 55 40 Watch Dogs Legion 120.6 119.7 107.4 59 41.6 21.4 Mafia Definitive Edition 107 88 81 57.7 27.3 Horizon Zero Dawn 171 124 106 89 66 34 Death Stranding 134 122 115 111 F1 2020 304 229 194 133 98 54 Doom Eternal 309 160 148 144 Borderlands 3 116 101 85 65 45 24 Control 215 99 70 45 22 Anno 1800 109.6 96.7 79.6 47 37.3 20.3 Far Cry New Dawn 104 92 88 84 84 48 Metro Exodus 192 103 76 60 47 28 Assassin´s Creed Odyssey 120 108 106 79 51 29 Forza Horizon 4 227 202 199 168 128 74 Shadow of the Tomb Raider 152 126 119 105 68 32 Strange Brigade 373 208 173 152 100 52 Far Cry 5 128 112 107 100 88 44 X-Plane 11.11 70 55 46 29 Final Fantasy XV Benchmark 180 107 79 56 30 Assassin´s Creed Origins 109 107 107 85 68 37 Rise of the Tomb Raider 236 179 120 97 42 Dota 2 Reborn 146 125 118 101 81 The Witcher 3 322 238 141 84 61.6 44 GTA V 172 161 144 79 59 58 BioShock Infinite 379.8 316.8 291 162.9 < 30 fps < 60 fps < 120 fps ≥ 120 fps 2 34 40 6 49 30 12 54 21 1 21 47 11 8 40 17 2 42 23 3
For more games that might be playable and a list of all games and graphics cards visit our Gaming List
v1.26
log 11. 13:33:46
#0 no ids found in url (should be separated by "_") +0s ... 0s
#1 not redirecting to Ajax server +0s ... 0s
#2 did not recreate cache, as it is less than 5 days old! Created at Fri, 10 May 2024 05:38:50 +0200 +0.001s ... 0.001s
#3 composed specs +0.051s ... 0.052s
#4 did output specs +0s ... 0.052s
#5 start showIntegratedCPUs +0s ... 0.052s
#6 getting avg benchmarks for device 10609 +0.03s ... 0.082s
#7 got single benchmarks 10609 +0.039s ... 0.121s
#8 got avg benchmarks for devices +0s ... 0.121s
#9 min, max, avg, median took s +1.281s ... 1.402s
#10 before gaming benchmark output +0s ... 1.402s
#11 Got 1120 rows for game benchmarks. +0.202s ... 1.603s
#12 composed SQL query for gamebenchmarks +0s ... 1.603s
#13 got data and put it in $dataArray +0.064s ... 1.667s
#14 benchmarks composed for output. +4.736s ... 6.403s
#15 return log +0.075s ... 6.478s
Notebook reviews with AMD Radeon RX 6600M graphics card
Minisforum Neptune Series HX77G review: The mini gaming PC with an AMD Ryzen 7 7735HS, AMD Radeon RX 6600M and 2x USB4 Compact mini PCs with dedicated graphics cards aren't all too widespread at the moment. Nevertheless, Minisforum's Neptune Series HX77G is a compact mini PC wit...
AMD Ryzen 7 7735HS | AMD Radeon RX 6600M | | 1.6 kg
Minisforum Neptune Series HX99G review: Compact gaming PC with AMD Ryzen 9 6900HX and AMD Radeon RX 6600M also includes USB4 and Thunderbolt Those who are currently looking for a compact gaming PC should definitely take a closer look at the Neptune Series HX99G from Minisforum. Find out in this revie...
AMD Ryzen 9 6900HX | AMD Radeon RX 6600M | | 1.6 kg
Minisforum HX90G review: Compact gaming PC with AMD Ryzen 9 5900HX and AMD Radeon RX 6600M Minisforum and its line of compact desktop computers is becoming more and more popular. The Chinese manufacturer's current lineup focuses increasingly on gaming...
AMD Ryzen 9 5900HX | AMD Radeon RX 6600M | | 1.4 kg
Lenovo Legion 5 15 review: AMD's new Radeon RX 6600M meets Ryzen 5 5600H Lenovo takes advantage of raw AMD power for its current Legion 5 15. We took a closer look at how well the Ryzen 5 5600H and the new Radeon RX 6600M work togeth...
AMD Ryzen 5 5600H | AMD Radeon RX 6600M | 15.60" | 2.5 kg
HP Omen 16 Gaming Laptop Review: Less is More HP's Omen 16 with AMD's Ryzen processor is sparing in its use of gaming components. Top performance thus cannot be expected, but this is not strictly necessary ...
AMD Ryzen 7 5800H | AMD Radeon RX 6600M | 16.10" | 2.3 kg
MSI Alpha 15 B5EEK-008 : AMD Ryzen 7 5800H, 15.60", 2.4 kgReview » MSI Alpha 15 Gaming Laptop Review: Ryzen 7 5800H and Radeon RX 6600M augur well for mainstream 1080p gaming
MSI Alpha 15 B5EEK : AMD Ryzen 5 5600H, 15.60", 2.4 kgExternal Review » MSI Alpha 15 B5EEK
HP Omen 16-c0026ns : AMD Ryzen 7 5800H, 16.10", 2.3 kgExternal Review » HP Omen 16-c0026ns
HP Omen 16-c0075ng : AMD Ryzen 7 5800H, 16.10", 2.3 kgExternal Review » HP Omen 16-c0075ng
MSI Alpha 15 B5EEK-008 : AMD Ryzen 7 5800H, 15.60", 2.4 kgExternal Review » MSI Alpha 15 B5EEK-008
Lenovo Legion 5 15ACH6A-82NW0037GE : AMD Ryzen 7 5800H, 15.60", 2.4 kgExternal Review » Lenovo Legion 5 15ACH6A-82NW0037GE
HP Omen 16-c0007ns : AMD Ryzen 9 5900HX, 16.10", 2.3 kgExternal Review » HP Omen 16-c0007ns
HP Omen 16-c0099AX : AMD Ryzen 9 5900HX, 16.10", 2.3 kgExternal Review » HP Omen 16-c0099AX
MSI Alpha 15 B5EEK-008 : AMD Ryzen 7 5800H, 15.60", 2.4 kgExternal Review » MSI Alpha 15 B5EEK-008
HP Omen 16-c0077ng : AMD Ryzen 7 5800H, 16.10", 2.3 kgAMD Ryzen unleashed: HP Omen 16 Gaming Notebook in review
Please share our article, every link counts!
» Comparison of GPUs
» Benchmark List
» Notebook Gaming List
Class 1
Class 2 Radeon PRO W6600M *
Class 3 UHD Graphics 32EUs
UHD Graphics 750
Class 4
Class 5 * Approximate position of the graphics adapter
Working For Notebookcheck
Are you a techie who knows how to translate? Then join our Team!
Details here
Top 10 Laptops Multimedia , Budget Multimedia , Gaming , Budget Gaming , Lightweight Gaming , Business , Budget Office , Workstation , Subnotebooks , Ultrabooks , Chromebooks
under 300 USD/Euros , under 500 USD/Euros , 1,000 USD/Euros , for University Students , Best Displays
Top 10 Smartphones Smartphones , Phablets , ≤6-inch , Camera Smartphones
Klaus Hinum (Update: 2021-06- 1)
 Deutsch
 English
 Español
 Français
 Italiano
 Nederlands
 Polski
 Português
 Русский
 Türkçe
 Svenska
 Chinese
 Magyar